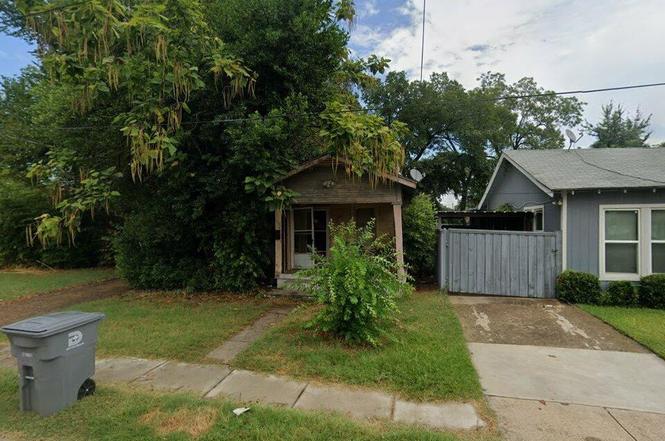
3806 Crozier St · Dallas, TX
Flood risk 1/10 · Minimal
- FEMA flood zone
- X (unshaded)
- Chance of flooding over 30 yrs
- 0.0%
- Est. flood insurance / yr
- $507 – $1,088
Fire risk 1/10 · Minimal
- Est. fire insurance / yr
- $1,222 – $2,270
Heat risk 7/10 · Major
- Hot days now (above 110°F)
- 7 days/yr
- Hot days in 30 yrs
- 24 days/yr
Wind risk 6/10 · Moderate
- Chance of severe wind over 30 yrs
- 27.0%
Air-quality risk 3/10 · Minor
- Unhealthy air days now
- 2 days/yr
- Unhealthy air days in 30 yrs
- 3 days/yr
Risk factors via First Street. Map © Google.
Why this score? — see what drove the B+ grade
The composite is a weighted blend of 9 inputs, each scored 0–100. Each bar is that input's sub-score; the figure is the points it added to the 100-point composite (weight × sub-score).
- Cash flow +30.0/30.0
- 1% rule +10.0/10.0
- DSCR +10.0/10.0
- ARV discount +7.5/15.0
- Appreciation +5.4/10.0
- Rent growth +4.3/5.0
- Livability +4.0/5.0
- Schools +2.8/10.0
- Condition / age +2.5/5.0
$75,000
🖨 Deal sheet 📄 Offer letter ✓ Due diligence
Key facts
- 3,441 sq ft lot
- Built 1926
- Listed 6 days
Property features AI
Finance
- Other: Property type: Single Family Residence; Subdivision: Jenkins & Broughtons; County: Dallas
- Financial info: Treated as clear for loan purposes; No second mortgage indicated
- HOA & community: No association
Exterior
- Parking: No covered parking or carport; no parking features listed
- Utilities: City water; City sewer; Electricity available; Not in a municipal utility district
- Home design: Single-family residence (Residential); Built in 1926
- Construction: Year built: 1926
- Exterior features: Lot is smaller than 0.5 acre (about 0.079 acres); Property is subdivided
Interior
- Kitchen: No appliances listed
- Bedrooms: 1 bedroom (Primary bedroom on level 1)
- Bathrooms: 1 full bathroom
- Interior features: One-level layout; Other interior features
- Laundry & utility: No laundry appliances listed
Neighborhood map
What this means for you Summary
Snapshot
- This is a 1-bed/1.0-bath single-family listed at $75k.
Deal economics
- At list price, monthly cash flow is $372 ($4k/yr) — positive.
- The deal already cash-flows at list — no discount required.
- Meets the 1% rule at list price ($1k rent vs $75k).
- Cap rate 12.2% vs local median 2.3% in Dallas — top-decile yield for the area; either an underpriced asset or a hidden risk that comps aren't pricing in. Stress-test before assuming the spread holds.
Location & tenants
- Location reads 81/100 on livability (#24 in TX, #1,380 nationally) — a professional / high-income tenant draw. Strengths: amenities A+, commute A+, housing A+; Watch: crime F.
- Dallas ISD (urban): math 31% / reading 36% proficiency, ranked #559 of 826 in TX (top 68%) — families likely to look elsewhere, expect single-tenant / working-renter base with shorter leases; 83% free/reduced lunch — lower-income household profile, screen leases tightly.
- Zoned schools: Charles Rice Learning Center (math 22% / reading 27%, grade F, #3,052 of 4,322 statewide, top 74%, 433 students, 98% FRL).
- Market conditions: Rents rising fast (+7.2%/yr); 248 active listings in the ZIP; 10 comparable units currently listed for rent nearby; rentals lingering (median 44d on market — plan ~5-8 weeks vacancy on turnover, expect pricing pressure); 50% of comp listings sitting > 30 days — soft ceiling on asking rent; 12,577 units permitted in Dallas County in 2024 (6,829 in 5+ unit buildings).
- This rent runs 31% of the median local income ($46k/yr) — at the standard rent-burdened threshold; future hikes will face affordability resistance.
Forward outlook
- In year one you build about $1k of equity ($519 loan paydown + $592 appreciation (0.8% local appreciation)).
- Dallas County population projected at +35% by 2050 — long-run rental-demand tailwind backs the buy-and-hold thesis.
- At projected returns (0.8% appreciation + 7.2% rent growth), your $21k cash investment doubles in ~4 years — after that, you're playing with house money.
Negotiation context
- Only 7 days on market — expect competitive offers; lowballing is unlikely to land.
Risks & watch-outs
- Watch-outs: built in 1926 — expect roof / HVAC / electrical / plumbing capex.
- Climate carrying-cost: major wind risk, 27% chance of damaging wind over 30y; extreme-heat days projected 7→24/yr by 2055 (HVAC capex compounding) — expect insurance premiums to compound above CPI over the hold.
Questions for the listing agent
- Built in 1926 — when were the roof, HVAC, electrical panel, plumbing, and water heater last replaced?
- Is there a deadline driving the sale (1031 exchange, divorce, estate, relocation)? That informs how much negotiation room exists.
- Crime grade is F in this area — have there been break-ins, vandalism, or insurance claims at this property in the last 3 years? What carrier currently insures it and at what premium?
- What's the average days-on-market for RENTAL listings here right now (not sales)? A rising rental-DOM trend means longer vacancies and softer asking-rent achievability than the comps imply.
- What's the recent tenant-quality profile in this submarket — average credit score on applications, eviction rate, late-payment / NSF rate, and stable-employment percentage? A property-management company in the area should have these aggregated.
- How much new for-sale + rental construction is in the pipeline within 1–3 miles? Heavy new supply typically softens prices + rents 12–24 months out; constrained supply supports both.
Investment metrics
- 1% rule
- 1.58% ✓
- Cap rate
- 12.24%
- Cash-on-cash
- 21.23%
- DSCR
- 1.94
- GRM
- 5.3
CMA / ARV
- ARV (on-the-fly)
- $151,536
- Comps found
- 2
Show comp detail 2 sales within ~0.75 mi
| Address | Dist | Beds/Ba | Sqft | Sold | Price | $/sf | Match |
|---|---|---|---|---|---|---|---|
| 3913 Crozier St | 0.10mi | 1/1.0 | 594 (+4%) | 17mo | $87,550 | $147 | 75 |
| 2223 Marburg St | 0.52mi | 1/1.0 | 512 (-11%) | 11mo | $135,000 | $264 | 48 |
Match score weights: distance 35% · size 25% · config 20% · recency 20%. Top-matched comps best support the ARV.
Projected returns pro-forma
0.79% appreciation · 7.19% rent growth · sell at horizon
- IRR
- 26.6%
- Equity multiple
- 2.41×
- Total profit
- $29,537
- Equity at exit
- $24,784
- IRR
- 32.1%
- Equity multiple
- 5.42×
- Total profit
- $92,757
- Equity at exit
- $32,312
Cash invested: $21,000 (down + closing). Projections, not guarantees.
Landlord ↔ Tenant lean methodology
- Overall (STATE)
- 87 Strongly Landlord-Friendly
- State Texas
- 87 Strongly Landlord-Friendly · R+5
- County
- — inherits STATE
- City
- — inherits STATE
ZIP-level market 75215
- Home prices YoY
- 0.3%
- Rents YoY
- 7.2%
- Active inventory
- 248
- Price-to-rent
- 5.3×
Monthly cashflow live
- Estimated rent
- $1,182 high interval (Pro) →
- Mortgage (P&I)
- −$393
- Tax from tax record
- −$138 /mo · $1,651/yr
- Insurance
- −$31
- HOA
- −$0
- Vacancy / Maint / Mgmt
- −$248
- Net cashflow
- $372
Break-even live
UW: 25.0% down · 7.5% · 30yr · 1.5% tax · 5.0% vac · 8.0% maint · 8.0% mgmt
Financing live
Cash to close
- Down payment
- $18,750
- Closing costs
- $2,250
- Reserves months
- —
- Total cash needed
- —
Loan-product check · same deal, 3 products live
Conventional
25% down · 7.5% · 30yr
- Down + closing
- —
- Monthly P&I
- —
- Monthly cashflow
- —
- DSCR
- —
- Eligible?
- —
Personal DTI + credit; lowest rate.
DSCR
20% down · 8.5% · 30yr
- Down + closing
- —
- Monthly P&I
- —
- Monthly cashflow
- —
- DSCR
- —
- Eligible?
- —
No personal income docs; deal must DSCR.
Hard money
10% down · 12.0% · 12mo
- Down + closing
- —
- Monthly P&I
- —
- Monthly cashflow
- —
- DSCR
- —
- Eligible?
- —
Short-term bridge; refi at stabilization.
Rent comps 10 comps
| Address | Beds | Baths | Sqft | Rent | $/sqft | DOM | Units | Dist |
|---|---|---|---|---|---|---|---|---|
| 1724 Pear St Unit 1 Dallas, TX | 2.0 | 1.0 | 605 | $875 | $1.45 | 44d | 1 | 0.49mi |
| 3529 Herrling St Dallas, TX | 2.0 | 1.0 | 632 | $1,200 | $1.90 | 11d | 1 | 1.03mi |
| 2711 Cross St Dallas, TX | 2.0 | 1.0 | 700 | $1,275 | $1.82 | 6d | 1 | 1.12mi |
| 2408 Meyers St Unit 204 Dallas, TX | 2.0 | 1.0 | 700 | $770 | $1.10 | 14d | 1 | 1.30mi |
| 2020 S Ervay St Dallas, TX | 2.0 | 1.0–2.0 | 821 | $1,778 | $2.17 | 3d | 54 | 1.36mi |
| 2016 S Ervay St Unit A1 Dallas, TX | 1.0 | 1.0 | 660 | $1,449 | $2.20 | 44d | 1 | 1.36mi |
| 2016 S Ervay St Unit S1 Dallas, TX | — | 1.0 | 540 | $1,355 | $2.51 | 44d | 1 | 1.36mi |
| 4205 Metropolitan Ave Dallas, TX | 2.0 | 1.0 | 625 | $1,150 | $1.84 | 44d | 1 | 1.42mi |
| 1812 Hickory St Dallas, TX | 1.0–2.0 | 1.0–2.0 | 825 | $1,426 | $1.73 | 44d | 19 | 1.42mi |
| 4228 Copeland St Unit A Dallas, TX | 1.0 | 1.0 | 468 | $750 | $1.60 | 24d | 1 | 1.49mi |
Listing history 5 events
-
2026-06-18days on market $75,000 Active 7 DOM
-
2026-06-17days on market $75,000 Active 6 DOM
-
2026-06-16days on market $75,000 Active 5 DOM
-
2026-06-15days on market $75,000 Active 4 DOM
-
2026-06-13$75,000 Active 2 DOM
ⓘ Source: listings_history table (triggers on properties + properties_extension) + one-shot
backfill from property_details.listing_events for pre-trigger history.
Tax reassessment forecast TX · Resets to sale price
- Current annual tax
- $1,651 · $138/mo
- Projected year-2 tax
- $1,651 · $138/mo
- Expected delta
- $0/yr ($0/mo · 0.0%)
ⓘ Screening estimate from a state-policy table — verify with the county assessor before closing.
Climate risk First Street
- Flood 1/10 Low FEMA zone X (unshaded) · 0% chance over 30 yrs
- Wildfire 1/10 Low
- Heat 7/10 Severe 7 d/yr ≥110°F today · 24 d/yr by 30 yrs out
- Wind 6/10 Major 27% chance of damaging wind over 30 yrs
- Air quality 3/10 Moderate 2 unhealthy d/yr today · 3 by 30 yrs out
Nearby sold comps map
Loading sold comps map…
Walkable amenities ~0.75 mi
Loading nearby amenities…
Taxation est. · year 1
- Rental income
- $14,183
- − Mortgage interest
- −$4,201
- − Property taxes
- −$1,651
- − Insurance
- −$375
- − Repairs & maintenance
- −$1,135
- − Management
- −$1,135
- − Depreciation
- −$2,182
- Taxable income
- $3,505
- Est. tax owed @ 24.0%
- −$841
- After-tax cash flow
- $3,618/yr
For passive investors: Depreciation is non-cash, so a rental often shows a tax loss while cash-flowing — sheltering income. Rental losses are passive: they offset passive income freely, and up to $25,000/yr can offset ordinary (W-2) income if you actively participate and your MAGI is under $100k (phasing out to $0 by $150k); unused losses carry forward. On sale, claimed depreciation is recaptured at up to 25%, and gains may owe capital-gains tax (a 1031 exchange can defer both). Figures are a year-1 estimate at your 24.0% rate — not tax advice; consult a CPA.
Schools (NCES district)
- District
- Dallas ISD
- NCES district ID
- 4816230
- Math proficiency
- 31% ▼ -16.00%
- Reading proficiency
- 36% ▼ -4.00%
- Median HH income
- $42,881
- Composite
- 28.41/100
- National rank
- #6763
- State rank
- #559 of 826 in TX
Livability — Dallas
- Score
- 81/100
- State rank
- #24
- US rank
- #1380
Category grades
Schools grade is shown separately in the Schools card above.
Census & demographics
- Census place
- Dallas, TX
- County
- Dallas County · 2,612,404 people
- City population
- 1,168,437
- Metro
- Dallas-Fort Worth-Arlington, TX
- Population (ZIP)
- 18,895
- Household income
- $45,557
- Rent vs Own
- Severe rent burden
- 1464.0
Population outlook (Dallas County) Hauer SSP2
- Today (2025)
- 2,979,839 people
- By 2030
- 3,191,823 · +7.1%
- By 2040
- 3,619,611 · +21.5%
- By 2050
- 4,026,915 · +35.1%
- By 2075
- 4,957,073 · +66.4%
- By 2100
- 5,508,725 · +84.9%
Race, ethnicity, and origin ACS 2023
- Neighborhood character
- Diverse neighborhood (Simpson 0.58)
- Race & ethnicity
- Black 59% Hispanic / Latino 25% White 11% Two or more races 10%
- Hispanic origin (detail)
- Mexican 21%
- Common ancestry
- Italian 1% Hispanic 1%
- Foreign-born
- 16% · Canada
- Languages at home
- 74% English-only · Spanish 26%
Political lean MEDSL · Dallas
- 2024 margin
- Strong D (+22.2) · D 60.2% · R 38.0% · Other 1.8%
- 2008→2024 swing
- +6.9pp toward D · 2008: 15.3pp · 2024: 22.2pp
- All cycles
- 2024: D+22.2 2020: D+31.6 2016: D+26.2 2012: D+15.4 2008: D+15.3
Not yet ingested
- Civics
- —
Market trends
- HPI YoY
- ▲ 0.79%
- Current HPI
- 224.2955
- Rent YoY
- ▲ 7.19%
- Metro
- Dallas-Fort Worth-Arlington, TX
- State GDP YoY
- ▲ 3.95%
- F500 in state
- 110
Industry mix (Fortune 500 HQ in TX)
| Industry | F500 HQs | Revenue |
|---|---|---|
| Energy | 16 | $1,198B |
|
||
| Technology | 5 | $198B |
|
||
| Engineering / Construction | 4 | $72B |
|
||
| Energy Services | 3 | $60B |
|
||
| Utilities | 3 | $41B |
|
||
| Healthcare | 2 | $330B |
|
||
Price history
3 events — show timeline
- 2026-06-11 Listed $75,000 NTREIS
- 2025-09-10 Sold (Public Records) — Public Records
- 2003-12-22 Sold (Public Records) — Public Records
Property tax history
+8.3%/yrLatest (2025): $1,651 · -24.5% YoY. Source: county tax records.
Cash-flow waterfall
monthlySold comps — $/sqft
last 12 mo · ≤1 miLoading sold comps…