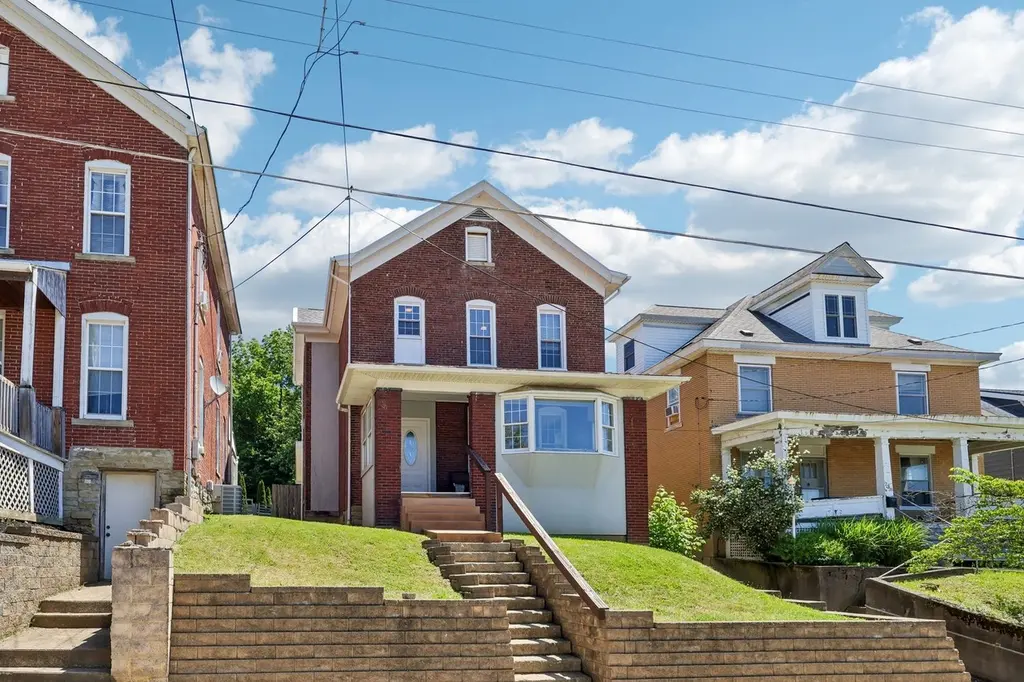
None · Canonsburg, PA
Flood risk 1/10 · Minimal
- FEMA flood zone
- X (unshaded)
- Chance of flooding over 30 yrs
- 0.0%
- Est. flood insurance / yr
- $473 – $860
Fire risk 1/10 · Minimal
- Est. fire insurance / yr
- $511 – $949
Heat risk 3/10 · Minor
- Hot days now (above 95°F)
- 7 days/yr
- Hot days in 30 yrs
- 19 days/yr
Wind risk 2/10 · Minimal
- Chance of severe wind over 30 yrs
- —
Air-quality risk 2/10 · Minimal
- Unhealthy air days now
- 1 days/yr
- Unhealthy air days in 30 yrs
- 2 days/yr
Risk factors via First Street. Map © Google.
Why this score? — see what drove the C- grade
The composite is a weighted blend of 9 inputs, each scored 0–100. Each bar is that input's sub-score; the figure is the points it added to the 100-point composite (weight × sub-score).
- Cash flow +14.9/30.0
- ARV discount +13.5/15.0
- Schools +5.3/10.0
- DSCR +4.6/10.0
- Livability +4.2/5.0
- 1% rule +3.6/10.0
- Condition / age +2.5/5.0
- Rent growth +1.9/5.0
- Appreciation +0.0/10.0
$230,000
🖨 Deal sheet (PDF) 📄 Offer letter ✓ Due diligence
Listing remarks MLS
Charming mix of old and new in the heart of Canonsburg. This 3-Bedroom, 2-story home has been updated and well maintained. Beautiful HW flooring. Kitchen has all stainless steel appliances and is open to the Dining Room. There's a two-sided decorative FP, which was at one point gas, between Kitchen and Dining Room. Walk out of the kitchen door to a concrete patio and a huge fenced-in yard for privacy or that furbaby of yours. Bedrooms are large with plenty of closet space, new ceiling fans. Updated Bath. A short walk up the street takes you to the lovely Canonsburg Town Park and Pool. A short walk down the street, and there's restaurants, library, SS, post office, etc. Convenient to interstates and Casino and Outlets. Move right in!
Key facts
- Decorative fireplace
- Fenced flat yard
- Concrete patio
Tags
Property features AI
Exterior
- Parking: On-street parking
- Utilities: Public water; Public sewer
- Home design: 2-story brick home; Asphalt roof; Resale property
- Construction: Brick construction; Asphalt roof
- Exterior features: Interior-entry basement
Interior
- Kitchen: Dishwasher; Microwave; Refrigerator; Stove
- Bedrooms: Two bedrooms on the upper level; One additional bedroom (level not specified)
- Flooring: Hardwood; Carpet; Ceramic tile
- Bathrooms: 1 full bathroom
- Heating & cooling: Forced air heating (electric); Central air conditioning
- Interior features: 2 fireplaces
- Laundry & utility: Washer; Dryer
Neighborhood map
What this means for you Summary
Snapshot
- This is a 3-bed/1.0-bath single-family listed at $230k.
Deal economics
- At list price, monthly cash flow is $68 ($820/yr) — positive.
- The deal already cash-flows at list — no discount required.
- To meet the 1% rule (rent ≥ 1% of price), the offer needs to be $198k (14.0% below list).
- Recommended offer: $198k (14.0% below list) — sets the bar for 1% rule.
- Cap rate 6.6% vs local median 4.1% in Canonsburg — top-decile yield for the area; either an underpriced asset or a hidden risk that comps aren't pricing in. Stress-test before assuming the spread holds.
Location & tenants
- Location reads 83/100 on livability (#127 in PA, #997 nationally) — a professional / high-income tenant draw. Strengths: crime A+, cost of living A+, housing A+; Watch: health & safety D+, amenities F.
- Canon-Mcmillan SD (suburban): math 49% / reading 72% proficiency, ranked #66 of 539 in PA (top 12%) — acceptable for families but not a draw, mixed tenant base, ~2y average lease; only 19% free/reduced lunch — higher-income household profile.
- Zoned schools: South Central El (math 42% / reading 67%, grade C, #504 of 1,518 statewide, top 37%, 431 students, 44% FRL); Canonsburg Ms (math 37% / reading 71%, grade B-, #82 of 512 statewide, top 16%, 777 students, 26% FRL); Canon-Mcmillan Shs (math 83%, 1,655 students, 26% FRL).
- Market conditions: Rents soft (-2.3%/yr); 196 active listings in the ZIP; 4 comparable units currently listed for rent nearby; rentals at typical pace (median 19d on market — plan ~3-4 weeks tenant-placement turnaround); solid renter incomes; 489 units permitted in Washington County in 2024 (30 in 5+ unit buildings).
Forward outlook
- Local home prices are declining (-3.0%/yr); year-one equity from $2k of loan paydown is wiped out by about $7k of value loss. Plan a longer hold.
- Washington County population projected to shrink 6% by 2050 — rents likely to lag national; underwrite the cash flow, not the appreciation.
Negotiation context
- It's been on market 17 days — a 2% lower offer ($227k) is reasonable based on typical stale-listing flexibility.
- 3 sale attempts since 18y ago with the ask held roughly flat each time — persistent listings suggest the price (not the market) is what's stuck; bring a comps-based counter.
- Current owner paid $175k; 31% above their basis — modest negotiation headroom, anchor on the comps not their cost.
Risks & watch-outs
- Watch-outs: built in 1913 — expect roof / HVAC / electrical / plumbing capex.
Questions for the listing agent
- Built in 1913 — when were the roof, HVAC, electrical panel, plumbing, and water heater last replaced?
- Is there a deadline driving the sale (1031 exchange, divorce, estate, relocation)? That informs how much negotiation room exists.
- Schools are A-rated — typically a magnet for longer-tenancy family renters. What's the average tenant stay here, and is there a school-zone premium baked into asking?
- What's the average days-on-market for RENTAL listings here right now (not sales)? A rising rental-DOM trend means longer vacancies and softer asking-rent achievability than the comps imply.
- What's the recent tenant-quality profile in this submarket — average credit score on applications, eviction rate, late-payment / NSF rate, and stable-employment percentage? A property-management company in the area should have these aggregated.
- How much new for-sale + rental construction is in the pipeline within 1–3 miles? Heavy new supply typically softens prices + rents 12–24 months out; constrained supply supports both.
Investment metrics
- 1% rule
- 0.86% ✗
- Cap rate
- 6.65%
- Cash-on-cash
- 1.27%
- DSCR
- 1.06
- GRM
- 9.7
CMA / ARV
- ARV (on-the-fly)
- $265,320
- Comps found
- 12
Show comp detail 12 sales within ~0.75 mi
| Address | Dist | Beds/Ba | Sqft | Sold | Price | $/sf | Match |
|---|---|---|---|---|---|---|---|
| 409 N Jefferson Ave | 0.29mi | 3/2.5 | 1,600 (-0%) | 2mo | $225,000 | $141 | 78 |
| 256 Smithfield St | 0.50mi | 3/1.0 | 1,624 (+1%) | 2mo | $229,900 | $142 | 73 |
| 227 Thornwood Dr | 0.24mi | 4/3.0 (+1) | 1,550 (-4%) | 2mo | $170,000 | $110 | 68 |
| 439 Woodland Rd | 0.30mi | 3/2.5 | 1,707 (+6%) | 4mo | $310,000 | $182 | 67 |
| 503 Bluff St | 0.42mi | 4/2.5 (+1) | 1,602 (-0%) | 5mo | $265,000 | $165 | 64 |
| 511 Highfield Ave | 0.44mi | 4/2.5 (+1) | 1,647 (+2%) | 0mo | $275,000 | $167 | 64 |
| 148 Oak Spring Rd | 0.59mi | 3/2.0 | 1,499 (-7%) | 1mo | $225,000 | $150 | 56 |
| 523 Park Ave | 0.74mi | 3/2.0 | 1,584 (-2%) | 6mo | $182,550 | $115 | 54 |
| 707 Alpine Dr | 0.75mi | 3/2.0 | 1,584 (-2%) | 6mo | $332,000 | $210 | 53 |
| 212 Glenn Ave | 0.49mi | 3/1.5 | 1,378 (-14%) | 1mo | $258,000 | $187 | 50 |
| 229 E College St | 0.51mi | 4/2.0 (+1) | 1,796 (+12%) | 3mo | $205,000 | $114 | 45 |
| 651 Alpine Dr | 0.67mi | 3/3.0 | 1,800 (+12%) | 3mo | $375,000 | $208 | 38 |
Match score weights: distance 35% · size 25% · config 20% · recency 20%. Top-matched comps best support the ARV.
Projected returns pro-forma
-3.0% appreciation · 0.0% rent growth · sell at horizon
- IRR
- -17.5%
- Equity multiple
- 0.40×
- Total profit
- $-38,747
- Equity at exit
- $34,294
- IRR
- -16.1%
- Equity multiple
- 0.21×
- Total profit
- $-50,666
- Equity at exit
- $19,886
Cash invested: $64,400 (down + closing). Projections, not guarantees.
Landlord ↔ Tenant lean methodology
- Overall (STATE)
- 62 Landlord-Friendly
- State Pennsylvania
- 62 Landlord-Friendly · EVEN
- County
- — inherits STATE
- City
- — inherits STATE
ZIP-level market 15317
- Home prices YoY
- -30.2%
- Rents YoY
- -2.3%
- Active inventory
- 196
- Price-to-rent
- 9.7×
Monthly cashflow live
- Estimated rent
- $1,979 medium interval (Pro) →
- Mortgage (P&I)
- −$1,206
- Tax from tax record
- −$193 /mo · $2,318/yr
- Insurance
- −$96
- HOA
- −$0
- Vacancy / Maint / Mgmt
- −$416
- Net cashflow
- $68
Break-even live
Sensitivity live
| Price | -10% $199 | -5% $133 | +0% $68 | +5% $3 | +10% $-62 |
|---|---|---|---|---|---|
| Rent | -10% $-88 | -5% $-10 | +0% $68 | +5% $146 | +10% $225 |
| Rate | -1.0pp $184 | -0.5pp $127 | base $68 | +0.5pp $9 | +1.0pp $-52 |
UW: 25.0% down · 7.5% · 30yr · 1.5% tax · 5.0% vac · 8.0% maint · 8.0% mgmt
Financing live
Cash to close
- Down payment
- $57,500
- Closing costs
- $6,900
- Reserves months
- —
- Total cash needed
- —
Loan-product check · same deal, 3 products live
Conventional
25% down · 7.5% · 30yr
- Down + closing
- —
- Monthly P&I
- —
- Monthly cashflow
- —
- DSCR
- —
- Eligible?
- —
Personal DTI + credit; lowest rate.
DSCR
20% down · 8.5% · 30yr
- Down + closing
- —
- Monthly P&I
- —
- Monthly cashflow
- —
- DSCR
- —
- Eligible?
- —
No personal income docs; deal must DSCR.
Hard money
10% down · 12.0% · 12mo
- Down + closing
- —
- Monthly P&I
- —
- Monthly cashflow
- —
- DSCR
- —
- Eligible?
- —
Short-term bridge; refi at stabilization.
Rent comps 4 comps
| Address | Beds | Baths | Sqft | Rent | $/sqft | DOM | Units | Dist |
|---|---|---|---|---|---|---|---|---|
| 108 Loubell Dr Unit 108 Canonsburg, PA | 3.0 | 2.5 | 1760 | $2,295 | $1.30 | 18d | 1 | 0.23mi |
| 126 Smith St Canonsburg, PA | 3.0 | 1.5 | 1134 | $1,350 | $1.19 | 0d | 1 | 0.31mi |
| 236 Grace Ave Canonsburg, PA | 3.0 | 2.0 | 1656 | $1,800 | $1.09 | 0d | 1 | 0.54mi |
| 412 Olive Ln Canonsburg, PA | 3.0 | 2.5 | 1424 | $2,450 | $1.72 | 45d | 1 | 0.91mi |
Listing history 10 events
-
2026-06-21days on market $230,000 Active 17 DOM
-
2026-06-18days on market $230,000 Active 14 DOM
-
2026-06-17days on market $230,000 Active 13 DOM
-
2026-06-16days on market $230,000 Active 12 DOM
-
2026-06-15days on market $230,000 Active 11 DOM
-
2026-06-13days on market $230,000 Active 9 DOM
-
2026-06-09days on market $230,000 Active 5 DOM
-
2026-06-08days on market $230,000 Active 4 DOM
-
2026-06-07remarks 566-char remark
-
2026-06-07$230,000 Active 3 DOM
ⓘ Source: listings_history table (triggers on properties + properties_extension) + one-shot
backfill from property_details.listing_events for pre-trigger history.
Tax reassessment forecast PA · Partial reset (capped growth)
- Current annual tax
- $2,318 · $193/mo
- Projected year-2 tax
- $2,976 · $248/mo
- Expected delta
- +$658/yr (+$55/mo · 28.4%)
ⓘ Screening estimate from a state-policy table — verify with the county assessor before closing.
Climate risk First Street
- Flood 1/10 Low FEMA zone X (unshaded) · 0% chance over 30 yrs
- Wildfire 1/10 Low
- Heat 3/10 Moderate 7 d/yr ≥95°F today · 19 d/yr by 30 yrs out
- Wind 2/10 Low
- Air quality 2/10 Low 1 unhealthy d/yr today · 2 by 30 yrs out
Nearby sold comps map
Loading sold comps map…
Walkable amenities ~0.75 mi
Loading nearby amenities…
Taxation est. · year 1
- Rental income
- $23,748
- − Mortgage interest
- −$12,884
- − Property taxes
- −$2,318
- − Insurance
- −$1,150
- − Repairs & maintenance
- −$1,900
- − Management
- −$1,900
- − Depreciation
- −$6,691
- Taxable loss
- −$3,094
- Est. tax savings @ 24.0%
- +$742
- After-tax cash flow
- $1,562/yr
For passive investors: Depreciation is non-cash, so a rental often shows a tax loss while cash-flowing — sheltering income. Rental losses are passive: they offset passive income freely, and up to $25,000/yr can offset ordinary (W-2) income if you actively participate and your MAGI is under $100k (phasing out to $0 by $150k); unused losses carry forward. On sale, claimed depreciation is recaptured at up to 25%, and gains may owe capital-gains tax (a 1031 exchange can defer both). Figures are a year-1 estimate at your 24.0% rate — not tax advice; consult a CPA.
Schools (NCES district)
- District
- Canon-Mcmillan SD
- NCES district ID
- 4204890
- Math proficiency
- 49% ▼ -14.00%
- Reading proficiency
- 72% ▼ -8.00%
- Median HH income
- $62,946
- Composite
- 52.63/100
- National rank
- #1557
- State rank
- #66 of 539 in PA
Livability — Canonsburg
- Score
- 83/100
- State rank
- #127
- US rank
- #997
Category grades
Schools grade is shown separately in the Schools card above.
Census & demographics
- Census place
- Canonsburg, PA
- County
- Washington County · 106,469 people
- City population
- 43,871
- Metro
- Pittsburgh, PA
- Population (ZIP)
- 43,871
- Household income
- $108,044
- Rent vs Own
- Severe rent burden
- 478.0
Population outlook (Washington County) Hauer SSP2
- Today (2025)
- 208,060 people
- By 2030
- 207,168 · -0.4%
- By 2040
- 202,738 · -2.6%
- By 2050
- 195,269 · -6.1%
- By 2075
- 175,588 · -15.6%
- By 2100
- 145,827 · -29.9%
Race, ethnicity, and origin ACS 2023
- Neighborhood character
- Predominantly White (90%)
- Race & ethnicity
- White 90% Asian 3% Two or more races 3% Black 3% Hispanic / Latino 2%
- Common ancestry
- Romanian 9% Slovak 3% Serbian 2%
- Foreign-born
- 4% · Canada, India
- Languages at home
- 95% English-only · Other Indo-European 2% Spanish 1% German/W. Germanic 1%
Political lean MEDSL · Washington
- 2024 margin
- Strong R (+25.5) · D 36.9% · R 62.4%
- 2008→2024 swing
- -20.8pp toward R · 2008: -4.7pp · 2024: -25.5pp
- All cycles
- 2024: R+25.5 2020: R+22.8 2016: R+25.3 2012: R+13.3 2008: R+4.7
Not yet ingested
- Civics
- —
Market trends
- HPI YoY
- ▼ -110.61%
- Current HPI
- 256.016
- Rent YoY
- ▼ -2.29%
- Metro
- Pittsburgh, PA
- State GDP YoY
- ▲ 1.68%
- F500 in state
- 34
Industry mix (Fortune 500 HQ in PA)
| Industry | F500 HQs | Revenue |
|---|---|---|
| Healthcare | 2 | $309B |
|
||
| Insurance | 2 | $27B |
|
||
| Telecommunications / Media | 1 | $124B |
|
||
| Industrial Distribution | 1 | $22B |
|
||
| Financial Services | 1 | $20B |
|
||
| Chemicals / Materials | 1 | $18B |
|
||
Price history
+109.1% since first listed10 events — show timeline
- 2026-06-04 Listed $230,000 West Penn MLS
- 2021-09-21 Sold (Public Records) $175,000 Public Records
- 2021-09-17 Sold (MLS) $175,000 West Penn MLS
- 2021-08-04 Contingent — West Penn MLS
- 2021-07-14 Listed $180,000 West Penn MLS
- 2009-11-25 Sold (Public Records) $67,000 Public Records
- 2009-05-21 Sold (MLS) $52,000 West Penn MLS
- 2009-05-21 Price Changed $68,590 West Penn MLS
- 2008-10-27 Listed $52,000 West Penn MLS
- 2002-02-21 Sold (Public Records) $110,000 Public Records
Property tax history
+3.6%/yrLatest (2026): $2,318 · +4.5% YoY. Source: county tax records.
Cash-flow waterfall
monthlySold comps — $/sqft
last 12 mo · ≤1 miLoading sold comps…