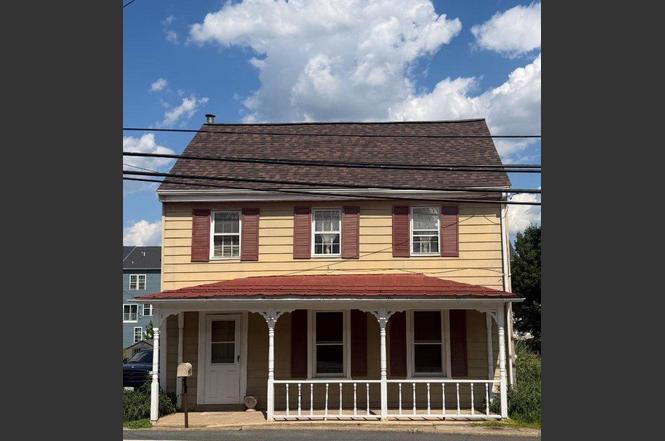
106 N Main St · Woodsboro, MD
Flood risk No data
- FEMA flood zone
- —
- Chance of flooding over 30 yrs
- —
- Est. flood insurance / yr
- —
Fire risk No data
- Est. fire insurance / yr
- —
Heat risk No data
- Hot days now (above threshold)
- —
- Hot days in 30 yrs
- —
Wind risk No data
- Chance of severe wind over 30 yrs
- —
Air-quality risk No data
- Unhealthy air days now
- —
- Unhealthy air days in 30 yrs
- —
Risk factors via First Street. Map © Google.
Why this score? — see what drove the B- grade
The composite is a weighted blend of 9 inputs, each scored 0–100. Each bar is that input's sub-score; the figure is the points it added to the 100-point composite (weight × sub-score).
- Cash flow +26.6/30.0
- ARV discount +15.0/15.0
- DSCR +9.1/10.0
- 1% rule +6.5/10.0
- Schools +3.4/10.0
- Livability +3.2/5.0
- Rent growth +2.5/5.0
- Condition / age +2.5/5.0
- Appreciation +0.0/10.0
$265,000
🖨 Deal sheet 📄 Offer letter ✓ Due diligence
Listing remarks
Welcome to historic Woodsboro! This charming 3-bedroom, 2-bath home offers a unique blend of small-town character, practical living space, and flexible CBD zoning opportunities. Rich in history and character, the home provides comfortable living while offering versatility rarely found in today’s market. The main level features hardwood flooring, spacious living and dining areas, a full bath, main-level laundry, and a functional layout designed for everyday living. Upstairs, you’ll find three bedrooms and an additional full bath, providing ample space while preserving the home’s historic appeal. Outside, enjoy a fully fenced backyard, a spacious deck, and off-street parking
Key facts
- Hardwood flooring
- Spacious deck
- Off-street parking
Tags
Property features AI
Finance
- Other: Fee simple ownership; Property in good condition; Pets allowed with no pet restrictions; Ground rent paid annually
Exterior
- Parking: Driveway parking for 4 vehicles; Total of 4 garage/parking spaces
- Utilities: Public water; Public sewer; 200+ amp electric service; Cable TV available
- Home design: Detached property; Estimated year built; Building not winterized
- Construction: Stone foundation; Architectural shingle and metal roof
- Exterior features: Deck(s) and porch(es); Outbuilding(s); Chain link and privacy fencing; Not in a federal flood zone; Located in downtown Woodsboro / in city limits
Interior
- Kitchen: Electric oven/range; Refrigerator
- Bedrooms: Three bedrooms on the upper level
- Flooring: Hardwood floors
- Bathrooms: Two full bathrooms (one on the main level and one on the upper level)
- Heating & cooling: Baseboard electric heating; Heat pump with oil backup; Central air conditioning; Electric hot water
- Interior features: Attic; Ceiling fans; Formal dining room; Kitchen with table space; Plaster walls; Wood floors
- Laundry & utility: Washer; Electric dryer; Electric water heater
Neighborhood map
What this means for you Summary
Snapshot
- This is a 3-bed/2.0-bath single-family listed at $265k.
Deal economics
- At list price, monthly cash flow is $706 ($8k/yr) — positive.
- The deal already cash-flows at list — no discount required.
- Meets the 1% rule at list price ($3k rent vs $265k).
Location & tenants
- Location reads 64/100 on livability (#274 in MD) — a middle-class / working-renter tenant base. Strengths: crime A+, employment A+, housing A+; Watch: cost of living D+, amenities F, commute F.
- Frederick County Public Schools (other): math 27% / reading 43% proficiency, ranked #4 of 24 in MD (top 17%) — families likely to look elsewhere, expect single-tenant / working-renter base with shorter leases.
- Zoned schools: New Midway/Woodsboro Elementary (math 17% / reading 12%, grade F, #477 of 860 statewide, top 59%, 276 students, 42% FRL); Walkersville Middle (math 12% / reading 39%, grade F, #97 of 225 statewide, top 46%, 841 students, 36% FRL); Walkersville High (math 62% / reading 72%, grade B, #50 of 222 statewide, top 23%, 1,213 students, 33% FRL) — zoned schools average 37% FRL vs 20% district-wide (17 pts higher); higher-poverty schools than district average — tighter screening recommended.
- Market conditions: 11 active listings in the ZIP; 1,562 units permitted in Frederick County in 2024 (374 in 5+ unit buildings).
Forward outlook
- Local home prices are declining (-3.0%/yr); year-one equity from $2k of loan paydown is wiped out by about $8k of value loss. Plan a longer hold.
- Frederick County population projected at +15% by 2050 — long-run rental-demand tailwind backs the buy-and-hold thesis.
- At projected returns (-3.0% appreciation + 3.0% rent growth), your $74k cash investment doubles in ~10 years — after that, you're playing with house money.
Negotiation context
- Only 4 days on market — expect competitive offers; lowballing is unlikely to land.
- 16 sale attempts since 28y ago with the ask held roughly flat each time — persistent listings suggest the price (not the market) is what's stuck; bring a comps-based counter.
- Current owner paid $145k; list at $265k implies a 83% gain — meaningful room to come down on a strong offer.
Risks & watch-outs
- Watch-outs: built in 1800 — expect roof / HVAC / electrical / plumbing capex.
Questions for the listing agent
- Built in 1800 — when were the roof, HVAC, electrical panel, plumbing, and water heater last replaced?
- Is there a deadline driving the sale (1031 exchange, divorce, estate, relocation)? That informs how much negotiation room exists.
- Schools are F-rated, which usually means shorter tenancies and higher turnover. Who's the typical renter profile here, and what's been the actual vacancy rate?
- What's the average days-on-market for RENTAL listings here right now (not sales)? A rising rental-DOM trend means longer vacancies and softer asking-rent achievability than the comps imply.
- What's the recent tenant-quality profile in this submarket — average credit score on applications, eviction rate, late-payment / NSF rate, and stable-employment percentage? A property-management company in the area should have these aggregated.
- How much new for-sale + rental construction is in the pipeline within 1–3 miles? Heavy new supply typically softens prices + rents 12–24 months out; constrained supply supports both.
Investment metrics
- 1% rule
- 1.15% ✓
- Cap rate
- 9.49%
- Cash-on-cash
- 11.41%
- DSCR
- 1.51
- GRM
- 7.2
CMA / ARV
- ARV (on-the-fly)
- $348,920
- Comps found
- 4
Show comp detail 4 sales within ~0.75 mi
| Address | Dist | Beds/Ba | Sqft | Sold | Price | $/sf | Match |
|---|---|---|---|---|---|---|---|
| 201 S 2nd St | 0.25mi | 3/1.5 | 1,146 (+0%) | 6mo | $350,000 | $305 | 81 |
| 101 E Elizabeth St | 0.12mi | 2/2.0 (-1) | 1,200 (+5%) | 1mo | $434,000 | $362 | 80 |
| 206 S 2nd St | 0.33mi | 3/1.0 | 1,190 (+4%) | 7mo | $300,000 | $252 | 68 |
| 104 S 2nd St | 0.21mi | 2/1.0 (-1) | 1,016 (-11%) | 12mo | $270,000 | $266 | 53 |
Match score weights: distance 35% · size 25% · config 20% · recency 20%. Top-matched comps best support the ARV.
Projected returns pro-forma
-3.0% appreciation · 3.0% rent growth · sell at horizon
- IRR
- 0.7%
- Equity multiple
- 1.03×
- Total profit
- $1,965
- Equity at exit
- $39,512
- IRR
- 10.3%
- Equity multiple
- 1.80×
- Total profit
- $59,455
- Equity at exit
- $22,912
Cash invested: $74,200 (down + closing). Projections, not guarantees.
Landlord ↔ Tenant lean methodology
- Overall (STATE)
- 27 Tenant-Leaning
- State Maryland
- 27 Tenant-Leaning · D+14
- County
- — inherits STATE
- City
- — inherits STATE
ZIP-level market 21798
- Home prices YoY
- -3.4%
- Active inventory
- 11
- Price-to-rent
- 7.2×
Monthly cashflow live
- Estimated rent
- $3,056 medium interval (Pro) →
- Mortgage (P&I)
- −$1,390
- Tax from tax record
- −$209 /mo · $2,503/yr
- Insurance
- −$110
- HOA
- −$0
- Vacancy / Maint / Mgmt
- −$642
- Net cashflow
- $706
Break-even live
UW: 25.0% down · 7.5% · 30yr · 1.5% tax · 5.0% vac · 8.0% maint · 8.0% mgmt
Financing live
Cash to close
- Down payment
- $66,250
- Closing costs
- $7,950
- Reserves months
- —
- Total cash needed
- —
Loan-product check · same deal, 3 products live
Conventional
25% down · 7.5% · 30yr
- Down + closing
- —
- Monthly P&I
- —
- Monthly cashflow
- —
- DSCR
- —
- Eligible?
- —
Personal DTI + credit; lowest rate.
DSCR
20% down · 8.5% · 30yr
- Down + closing
- —
- Monthly P&I
- —
- Monthly cashflow
- —
- DSCR
- —
- Eligible?
- —
No personal income docs; deal must DSCR.
Hard money
10% down · 12.0% · 12mo
- Down + closing
- —
- Monthly P&I
- —
- Monthly cashflow
- —
- DSCR
- —
- Eligible?
- —
Short-term bridge; refi at stabilization.
Listing history 4 events
-
2026-06-15statusdays on market $265,000 Pending 4 DOM
-
2026-06-13days on market $265,000 Active 3 DOM
-
2026-06-13remarks 681-char remark
-
2026-06-13$265,000 Active 2 DOM
ⓘ Source: listings_history table (triggers on properties + properties_extension) + one-shot
backfill from property_details.listing_events for pre-trigger history.
Tax reassessment forecast MD · Partial reset (capped growth)
- Current annual tax
- $2,503 · $209/mo
- Projected year-2 tax
- $2,696 · $225/mo
- Expected delta
- +$193/yr (+$16/mo · 7.7%)
ⓘ Screening estimate from a state-policy table — verify with the county assessor before closing.
Nearby sold comps map
Loading sold comps map…
Walkable amenities ~0.75 mi
Loading nearby amenities…
Taxation est. · year 1
- Rental income
- $36,672
- − Mortgage interest
- −$14,844
- − Property taxes
- −$2,503
- − Insurance
- −$1,325
- − Repairs & maintenance
- −$2,934
- − Management
- −$2,934
- − Depreciation
- −$7,709
- Taxable income
- $4,423
- Est. tax owed @ 24.0%
- −$1,062
- After-tax cash flow
- $7,405/yr
For passive investors: Depreciation is non-cash, so a rental often shows a tax loss while cash-flowing — sheltering income. Rental losses are passive: they offset passive income freely, and up to $25,000/yr can offset ordinary (W-2) income if you actively participate and your MAGI is under $100k (phasing out to $0 by $150k); unused losses carry forward. On sale, claimed depreciation is recaptured at up to 25%, and gains may owe capital-gains tax (a 1031 exchange can defer both). Figures are a year-1 estimate at your 24.0% rate — not tax advice; consult a CPA.
Schools (NCES district)
- District
- Frederick County Public Schools
- NCES district ID
- 2400330
- Math proficiency
- 27% ▼ -23.00%
- Reading proficiency
- 43% ▼ -15.00%
- Median HH income
- $84,020
- Composite
- 33.54/100
- National rank
- #5429
- State rank
- #4 of 24 in MD
Livability — Woodsboro
- Score
- 64/100
- State rank
- #274
- US rank
- #13900
Category grades
Schools grade is shown separately in the Schools card above.
Census & demographics
- Census place
- Woodsboro, MD
- Population (ZIP)
- 2,765
Population outlook (Frederick County) Hauer SSP2
- Today (2025)
- 269,438 people
- By 2030
- 280,160 · +4.0%
- By 2040
- 298,408 · +10.8%
- By 2050
- 311,062 · +15.4%
- By 2075
- 342,819 · +27.2%
- By 2100
- 351,361 · +30.4%
Race, ethnicity, and origin ACS 2023
- Neighborhood character
- Predominantly White (80%)
- Race & ethnicity
- White 80% Black 13% Two or more races 4% Hispanic / Latino 2%
- Common ancestry
- Italian 9% Lithuanian 3% Slovak 3%
- Foreign-born
- 9% · Canada, Jamaica, China
- Languages at home
- 95% English-only · Spanish 2% French/Haitian/Cajun 2%
Political lean MEDSL · Frederick
- 2024 margin
- Lean D (+8.8) · D 53.2% · R 44.4% · Other 2.5%
- 2008→2024 swing
- +9.9pp toward D · 2008: -1.0pp · 2024: 8.8pp
- All cycles
- 2024: D+8.8 2020: D+9.6 2016: R+4.0 2012: R+3.9 2008: R+1.0
Not yet ingested
- Civics
- —
Market trends
- HPI YoY
- ▼ -10.40%
- Current HPI
- 296.9794
- Rent YoY
- —
- Metro
- —
- State GDP YoY
- ▲ 2.97%
- F500 in state
- 12
Industry mix (Fortune 500 HQ in MD)
| Industry | F500 HQs | Revenue |
|---|---|---|
| Aerospace / Defense | 1 | $71B |
|
||
| Utilities | 1 | $25B |
|
||
| Hotels | 1 | $24B |
|
||
| Consumer Goods | 1 | $7B |
|
||
| Real Estate | 1 | $6B |
|
||
| Chemicals | 1 | $2B |
|
||
Price history
+430.0% since first listed42 events — show timeline
- 2026-06-10 Listed $265,000 BRIGHT MLS
- 2026-03-09 Listing Removed — BRIGHT MLS
- 2026-03-08 Relisted — BRIGHT MLS
- 2026-02-28 Listing Removed — BRIGHT MLS
- 2026-02-25 Relisted — BRIGHT MLS
- 2026-02-20 Contingent — BRIGHT MLS
- 2026-01-26 Listed $265,000 BRIGHT MLS
- 2026-01-26 Listing Removed — BRIGHT MLS
- 2026-01-25 Relisted — BRIGHT MLS
- 2026-01-21 Contingent — BRIGHT MLS
- 2025-12-04 Listed $272,000 BRIGHT MLS
- 2025-11-20 Coming Soon — BRIGHT MLS
- 2020-12-26 Listing Removed — BRIGHT MLS
- 2020-12-08 Relisted — BRIGHT MLS
- 2020-11-29 Contingent — BRIGHT MLS
- 2020-11-01 Listed $200,000 BRIGHT MLS
- 2014-12-04 Sold (Public Records) $145,000 Public Records
- 2014-12-04 Sold (Public Records) $145,000 Public Records
- 2012-12-15 Sold (MLS) $30,000 BRIGHT MLS
- 2012-12-15 Sold (MLS) $30,000 MRIS
- 2012-12-05 Listed $53,950 BRIGHT MLS
- 2012-12-05 Listing Removed — BRIGHT MLS
- 2012-12-05 Delisted — MRIS
- 2012-12-05 Listed $53,950 MRIS
- 2012-09-08 Delisted — MRIS
- 2012-09-08 Listing Removed — BRIGHT MLS
- 2012-08-15 Price Changed — MRIS
- 2012-08-07 Relisted — MRIS
- 2012-08-02 Delisted — MRIS
- 2012-06-24 Price Changed — MRIS
- 2012-05-10 Price Changed — MRIS
- 2012-03-13 Listed — MRIS
- 2012-03-13 Listed $53,950 BRIGHT MLS
- 1999-01-14 Sold (Public Records) $75,000 Public Records
- 1998-12-29 Sold (MLS) $75,000 MRIS
- 1998-10-30 Delisted — MRIS
- 1998-09-30 Listed $125,000 MRIS
- 1998-09-01 Delisted — MRIS
- 1998-09-01 Delisted — MRIS
- 1998-04-08 Listed — MRIS
- 1998-04-08 Listed — MRIS
- 1984-09-04 Sold (Public Records) $50,000 Public Records
Property tax history
+3.3%/yrLatest (2025): $2,503 · +5.2% YoY. Source: county tax records.
Cash-flow waterfall
monthlySold comps — $/sqft
last 12 mo · ≤1 miLoading sold comps…