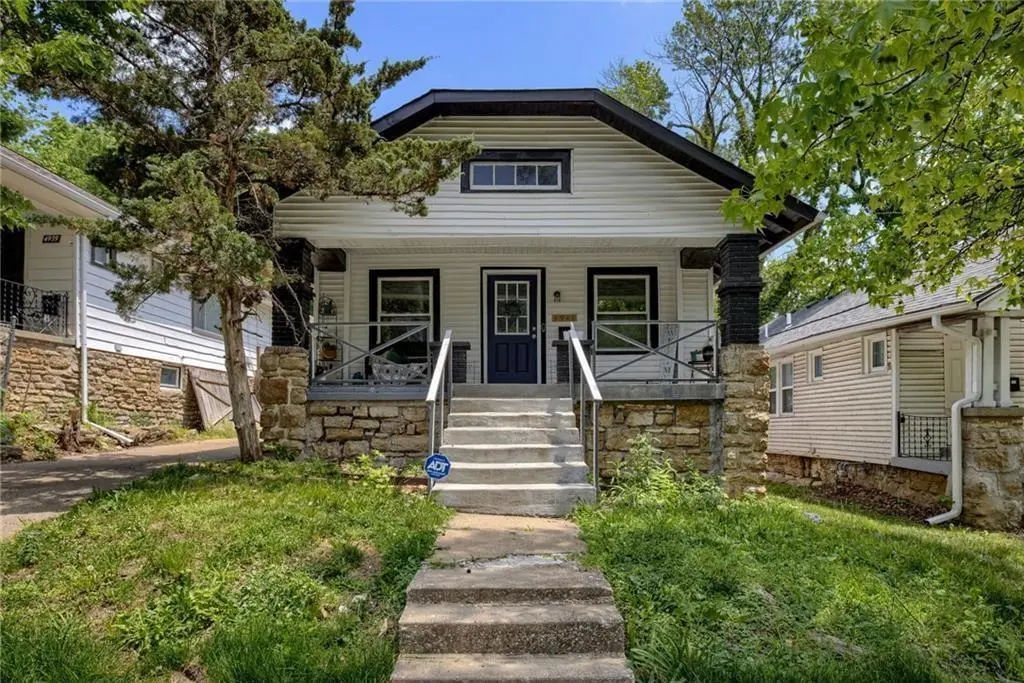
4941 Michigan Ave · Kansas City, MO
Flood risk 1/10 · Minimal
- FEMA flood zone
- X (unshaded)
- Chance of flooding over 30 yrs
- 0.0%
- Est. flood insurance / yr
- $473 – $860
Fire risk 1/10 · Minimal
- Est. fire insurance / yr
- $1,054 – $1,958
Heat risk 4/10 · Minor
- Hot days now (above 106°F)
- 7 days/yr
- Hot days in 30 yrs
- 17 days/yr
Wind risk 2/10 · Minimal
- Chance of severe wind over 30 yrs
- —
Air-quality risk 3/10 · Minor
- Unhealthy air days now
- 2 days/yr
- Unhealthy air days in 30 yrs
- 4 days/yr
Risk factors via First Street. Map © Google.
Why this score? — see what drove the D grade
The composite is a weighted blend of 9 inputs, each scored 0–100. Each bar is that input's sub-score; the figure is the points it added to the 100-point composite (weight × sub-score).
- Cash flow +16.4/30.0
- DSCR +5.1/10.0
- ARV discount +4.9/15.0
- Livability +3.9/5.0
- Rent growth +3.6/5.0
- 1% rule +3.3/10.0
- Condition / age +2.5/5.0
- Schools +1.5/10.0
- Appreciation +0.0/10.0
$145,000
🖨 Deal sheet 📄 Offer letter ✓ Due diligence
Listing remarks MLS
Welcome to this beautifully refreshed 2-bedroom, 2-bathroom Craftsman bungalow in the heart of Kansas City! Spanning 960 sq. ft. , this 1926 home blends classic charm with modern convenience. Enjoy high-end updates including luxury vinyl flooring throughout and a cozy fireplace in the living room. The bright, functional layout includes a main-level laundry closet and an unfinished basement for extra storage. Relax on your covered front porch or enjoy the easy-care yard. With a newer roof and fresh paint, this home is truly move-in ready for its next owner. It is Renter occupied and monthly rent is $1400, 12 month lease. Seller will consider a package deal if the buyer will purchase both 4941 and 4943 Michigan at the same time. buyer agent is responsible for verifying the square footage of the home,
Key facts
- 4,687 sq ft lot
- Built 1926
- Listed 49 days
Neighborhood map
What this means for you Summary
Snapshot
- This is a 2-bed/1.0-bath single-family listed at $145k.
Deal economics
- At list price, monthly cash flow is $82 ($990/yr) — positive.
- The deal already cash-flows at list — no discount required.
- To meet the 1% rule (rent ≥ 1% of price), the offer needs to be $120k (17.2% below list).
- Recommended offer: $120k (17.2% below list) — sets the bar for 1% rule.
- Cap rate 7.0% vs local median 3.9% in Kansas City — top-decile yield for the area; either an underpriced asset or a hidden risk that comps aren't pricing in. Stress-test before assuming the spread holds.
Location & tenants
- Location reads 78/100 on livability (#28 in MO, #2,671 nationally) — a middle-class / working-renter tenant base. Strengths: amenities A+, commute A+, cost of living A+; Watch: schools C-, crime F.
- Kansas City 33 (urban): math 12% / reading 24% proficiency, ranked #308 of 324 in MO (top 95%) — low school quality limits family demand, transient renter base, plan for 1-2y turnover; 75% free/reduced lunch — lower-income household profile, screen leases tightly.
- Market conditions: Rents rising fast (+4.4%/yr); 187 active listings in the ZIP; 40 comparable units currently listed for rent nearby; rentals at typical pace (median 20d on market — plan ~3-4 weeks tenant-placement turnaround); lower-income renter base — watch delinquency; 4,002 units permitted in Jackson County in 2024 (2,271 in 5+ unit buildings).
- This rent runs 34% of the median local income ($42k/yr) — at the standard rent-burdened threshold; future hikes will face affordability resistance.
Forward outlook
- Local home prices are declining (-3.0%/yr); year-one equity from $1k of loan paydown is wiped out by about $4k of value loss. Plan a longer hold.
- Jackson County population projected at +4% by 2050 — modest demand growth; plan on rents tracking national, not racing it.
Negotiation context
- It's been on market 50 days — a 3% lower offer ($141k) is reasonable based on typical stale-listing flexibility.
- 10 sale attempts since 24y ago; this cycle's ask has dropped $10k (6%) from the opening price — seller is motivated, your offer sets the floor, not the list.
Risks & watch-outs
- Watch-outs: built in 1926 — expect roof / HVAC / electrical / plumbing capex.
Questions for the listing agent
- It's been on market 50 days. Have you received any prior offers? Is the seller open to a 17% concession, seller financing, or rate buy-down credit?
- Built in 1926 — when were the roof, HVAC, electrical panel, plumbing, and water heater last replaced?
- Is there a deadline driving the sale (1031 exchange, divorce, estate, relocation)? That informs how much negotiation room exists.
- Crime grade is F in this area — have there been break-ins, vandalism, or insurance claims at this property in the last 3 years? What carrier currently insures it and at what premium?
- The area grade is low — what's the realistic commute time and amenity access for the typical tenant pool here? Any planned neighborhood developments (good or bad) we should know about?
- What's the average days-on-market for RENTAL listings here right now (not sales)? A rising rental-DOM trend means longer vacancies and softer asking-rent achievability than the comps imply.
- What's the recent tenant-quality profile in this submarket — average credit score on applications, eviction rate, late-payment / NSF rate, and stable-employment percentage? A property-management company in the area should have these aggregated.
- How much new for-sale + rental construction is in the pipeline within 1–3 miles? Heavy new supply typically softens prices + rents 12–24 months out; constrained supply supports both.
Investment metrics
- 1% rule
- 0.83% ✗
- Cap rate
- 6.98%
- Cash-on-cash
- 2.44%
- DSCR
- 1.11
- GRM
- 10.1
CMA / ARV
- ARV (median comp)
- $137,008
- List price
- $145,000
- Delta
- 5.83%
- Verdict
- FAIR
- Comps
- 20 within 1.0 mi
Show comp detail 12 sales within ~0.75 mi
| Address | Dist | Beds/Ba | Sqft | Sold | Price | $/sf | Match |
|---|---|---|---|---|---|---|---|
| 5114 Michigan Ave | 0.19mi | 3/1.0 (+1) | 965 (+0%) | 2mo | $94,900 | $98 | 84 |
| 1508 E 49th Ter | 0.22mi | 2/1.0 | 916 (-5%) | 4mo | $90,000 | $98 | 79 |
| 1537 E 50th St | 0.15mi | 2/1.0 | 910 (-5%) | 7mo | $110,000 | $121 | 78 |
| 5306 Olive St | 0.51mi | 2/1.0 | 946 (-2%) | 0mo | $154,900 | $164 | 74 |
| 5001 Troostwood Rd | 0.43mi | 2/1.0 | 901 (-6%) | 3mo | $253,000 | $281 | 68 |
| 5415 Highland Ave | 0.58mi | 2/1.0 | 928 (-3%) | 1mo | $129,900 | $140 | 66 |
| 1406 E 45th St | 0.68mi | 3/1.0 (+1) | 928 (-3%) | 0mo | $129,000 | $139 | 58 |
| 5507 Park Ave | 0.72mi | 2/1.0 | 874 (-9%) | 5mo | $94,900 | $109 | 47 |
| 5341 Brooklyn Ave | 0.53mi | 3/2.0 (+1) | 1,048 (+9%) | 8mo | $100,000 | $95 | 44 |
| 5400 Paseo Blvd | 0.60mi | 3/2.0 (+1) | 864 (-10%) | 4mo | $159,000 | $184 | 43 |
| 4909 S Benton Ave | 0.63mi | 2/1.0 | 821 (-14%) | 5mo | $75,000 | $91 | 42 |
| 5406 Paseo Blvd | 0.62mi | 3/1.0 (+1) | 1,104 (+15%) | 7mo | $139,000 | $126 | 35 |
Match score weights: distance 35% · size 25% · config 20% · recency 20%. Top-matched comps best support the ARV.
Projected returns pro-forma
-3.0% appreciation · 4.42% rent growth · sell at horizon
- IRR
- -11.1%
- Equity multiple
- 0.59×
- Total profit
- $-16,567
- Equity at exit
- $21,620
- IRR
- -0.2%
- Equity multiple
- 0.99×
- Total profit
- $-574
- Equity at exit
- $12,537
Cash invested: $40,600 (down + closing). Projections, not guarantees.
Landlord ↔ Tenant lean methodology
- Overall (STATE)
- 81 Strongly Landlord-Friendly
- State Missouri
- 81 Strongly Landlord-Friendly · R+10
- County
- — inherits STATE
- City
- — inherits STATE
ZIP-level market 64130
- Home prices YoY
- -21.5%
- Rents YoY
- 4.4%
- Active inventory
- 187
- Price-to-rent
- 10.1×
Monthly cashflow live
- Estimated rent
- $1,201 high interval (Pro) →
- Mortgage (P&I)
- −$760
- Tax from tax record
- −$46 /mo · $548/yr
- Insurance
- −$60
- HOA
- −$0
- Vacancy / Maint / Mgmt
- −$252
- Net cashflow
- $82
Break-even live
UW: 25.0% down · 7.5% · 30yr · 1.5% tax · 5.0% vac · 8.0% maint · 8.0% mgmt
Financing live
Cash to close
- Down payment
- $36,250
- Closing costs
- $4,350
- Reserves months
- —
- Total cash needed
- —
Loan-product check · same deal, 3 products live
Conventional
25% down · 7.5% · 30yr
- Down + closing
- —
- Monthly P&I
- —
- Monthly cashflow
- —
- DSCR
- —
- Eligible?
- —
Personal DTI + credit; lowest rate.
DSCR
20% down · 8.5% · 30yr
- Down + closing
- —
- Monthly P&I
- —
- Monthly cashflow
- —
- DSCR
- —
- Eligible?
- —
No personal income docs; deal must DSCR.
Hard money
10% down · 12.0% · 12mo
- Down + closing
- —
- Monthly P&I
- —
- Monthly cashflow
- —
- DSCR
- —
- Eligible?
- —
Short-term bridge; refi at stabilization.
Rent comps 40 comps
| Address | Beds | Baths | Sqft | Rent | $/sqft | DOM | Units | Dist |
|---|---|---|---|---|---|---|---|---|
| 4930 Park Ave Kansas City, MO | 3.0 | 1.0 | 900 | $1,300 | $1.44 | 16d | 1 | 0.25mi |
| 5114 Brooklyn Ave Kansas City, MO | 3.0 | 1.5 | 1116 | $1,300 | $1.16 | 7d | 1 | 0.25mi |
| 4818 Paseo Blvd Unit 1W Kansas City, MO | 1.0 | 1.0 | 526 | $945 | $1.80 | 23d | 1 | 0.36mi |
| 4818 Paseo Blvd Kansas City, MO | 1.0 | 1.0 | 526 | $945 | $1.80 | 11d | 10 | 0.36mi |
| 4818 Paseo Blvd Kansas City, MO | 1.0 | 1.0 | 526 | $945 | $1.80 | 3d | 8 | 0.36mi |
| 4818 The Paseo Unit 2N Kansas City, MO | 1.0 | 1.0 | 526 | $995 | $1.89 | 23d | 1 | 0.36mi |
| 4818 The Paseo Unit 3S Kansas City, MO | 1.0 | 1.0 | 526 | $895 | $1.70 | 23d | 1 | 0.36mi |
| 4818 The Paseo Unit 2N Kansas City, MO | 1.0 | 1.0 | 526 | $945 | $1.80 | 16d | 1 | 0.36mi |
| 1320 E 49th St Kansas City, MO | 1.0 | 1.0 | 550 | $1,000 | $1.82 | 2d | 2 | 0.39mi |
| 4925 Tracy Ave Unit 1 Kansas City, MO | 2.0 | 1.0 | 1000 | $1,400 | $1.40 | 43d | 1 | 0.42mi |
| 5332 Highland Ave Kansas City, MO | 3.0 | 1.0 | 1022 | $1,350 | $1.32 | 7d | 1 | 0.48mi |
| 5410 Euclid Ave Kansas City, MO | 3.0 | 2.0 | 1119 | $1,395 | $1.25 | 43d | 1 | 0.54mi |
| 1500 E 46th St Kansas City, MO | 1.0–3.0 | 1.0 | 803 | $1,050 | $1.31 | 43d | 1 | 0.54mi |
| 4917 S Benton Ave Kansas City, MO | 2.0 | 1.0 | 1000 | $1,100 | $1.10 | 23d | 1 | 0.65mi |
| 5013 S Benton Ave Kansas City, MO | 3.0 | 1.0 | 978 | $1,225 | $1.25 | 23d | 1 | 0.65mi |
| 4911 S Benton Ave Kansas City, MO | 2.0 | 1.0 | 1000 | $1,100 | $1.10 | 16d | 1 | 0.65mi |
| 1214 Brush Creek Blvd Unit 03 Kansas City, MO | 2.0 | 1.0 | 950 | $1,050 | $1.11 | 16d | 1 | 0.68mi |
| 5529 Michigan Ave Kansas City, MO | 2.0 | 1.0 | 847 | $995 | $1.17 | 43d | 1 | 0.71mi |
| 4401 Wayne Ave Kansas City, MO | 2.0 | 1.5 | 955 | $1,300 | $1.36 | 23d | 1 | 0.75mi |
| 3017 E 51st St Kansas City, MO | 2.0 | 1.0 | 621 | $1,303 | $2.10 | 7d | 1 | 0.76mi |
| 5405 Harrison St Unit 2F Kansas City, MO | 2.0 | 1.0 | 1025 | $1,295 | $1.26 | 19d | 1 | 0.80mi |
| 5405 Harrison St Unit 2F Kansas City, MO | 2.0 | 1.0 | 1025 | $1,295 | $1.26 | 16d | 1 | 0.80mi |
| 5405 Harrison St Kansas City, MO | 2.0 | 1.0 | 1025 | $1,295 | $1.26 | 16d | 1 | 0.80mi |
| 5407 Harrison St Unit 1F Kansas City, MO | 2.0 | 1.0 | 1025 | $1,195 | $1.17 | 43d | 1 | 0.80mi |
| 5409 Harrison St Unit 5411 Kansas City, MO | 2.0 | 1.0 | 900 | $1,199 | $1.33 | 23d | 1 | 0.80mi |
| 5411 Harrison St Unit 1F Kansas City, MO | 2.0 | 1.0 | 900 | $1,199 | $1.33 | 23d | 1 | 0.81mi |
| 4534 S Benton Ave Kansas City, MO | 2.0 | 1.0 | 912 | $1,045 | $1.15 | 16d | 1 | 0.81mi |
| 5436 Harrison St Unit 1F Kansas City, MO | 2.0 | 1.0 | 1050 | $1,195 | $1.14 | 43d | 1 | 0.87mi |
| 5446 Harrison St Unit 2F Kansas City, MO | 2.0 | 1.0 | 960 | $1,099 | $1.14 | 14d | 1 | 0.89mi |
| 5702 Euclid Ave Kansas City, MO | 2.0 | 1.0 | 683 | $1,000 | $1.46 | 43d | 1 | 0.90mi |
| 5335 Holmes St Unit 2F Kansas City, MO | 2.0 | 1.0 | 960 | $1,295 | $1.35 | 16d | 1 | 0.92mi |
| 5335 Holmes St Unit 2F Kansas City, MO | 2.0 | 1.0 | 960 | $1,295 | $1.35 | 23d | 1 | 0.92mi |
| 5424 Charlotte St Kansas City, MO | 2.0 | 1.0 | 958 | $1,395 | $1.46 | 19d | 1 | 0.94mi |
| 5424 Charlotte St Kansas City, MO | 2.0 | 1.0 | 958 | $1,395 | $1.46 | 16d | 1 | 0.94mi |
| 5713 Brooklyn Ave Kansas City, MO | 2.0 | 1.0 | 600 | $1,200 | $2.00 | 7d | 1 | 0.96mi |
| 4427 Agnes Ave Kansas City, MO | 3.0 | 1.0 | 1100 | $1,350 | $1.23 | 16d | 1 | 0.97mi |
| 5730 Garfield Ave Kansas City, MO | 3.0 | 1.0 | 866 | $1,195 | $1.38 | 16d | 1 | 0.97mi |
| 3315 E 52nd St Kansas City, MO | 2.0 | 1.0 | 662 | $1,125 | $1.70 | 23d | 1 | 0.98mi |
| 4232 Virginia Ave Unit 1 Kansas City, MO | 1.0 | 1.0 | 592 | $750 | $1.27 | 19d | 1 | 0.99mi |
| 4209 Flora Ave Kansas City, MO | 2.0 | 1.0 | 778 | $1,200 | $1.54 | 16d | 1 | 0.99mi |
Listing history 43 events
-
2026-06-18days on market $145,000 Active 50 DOM
-
2026-06-17days on market $145,000 Active 49 DOM
-
2026-06-16days on market $145,000 Active 48 DOM
-
2026-06-15days on market $145,000 Active 47 DOM
-
2026-06-13days on market $145,000 Active 45 DOM
-
2026-06-09days on market $145,000 Active 41 DOM
-
2026-06-08days on market $145,000 Active 40 DOM
-
2026-06-07days on market $145,000 Active 39 DOM
-
2026-06-05pricedays on market $145,000 Active 36 DOM
-
2026-06-03days on market $150,000 Active 35 DOM
-
2026-06-02days on market $150,000 Active 34 DOM
-
2026-06-01days on market $150,000 Active 33 DOM
-
2026-05-31days on market $150,000 Active 32 DOM
-
2026-05-19price $150,000 809-char remark
Show marketing remark (809 chars)
Welcome to this beautifully refreshed 2-bedroom, 2-bathroom Craftsman bungalow in the heart of Kansas City! Spanning 960 sq. ft. , this 1926 home blends classic charm with modern convenience. Enjoy high-end updates including luxury vinyl flooring throughout and a cozy fireplace in the living room. The bright, functional layout includes a main-level laundry closet and an unfinished basement for extra storage. Relax on your covered front porch or enjoy the easy-care yard. With a newer roof and fresh paint, this home is truly move-in ready for its next owner. It is Renter occupied and monthly rent is $1400, 12 month lease. Seller will consider a package deal if the buyer will purchase both 4941 and 4943 Michigan at the same time. buyer agent is responsible for verifying the square footage of the home,
-
2026-05-15price $140,000 809-char remark
Show marketing remark (809 chars)
Welcome to this beautifully refreshed 2-bedroom, 2-bathroom Craftsman bungalow in the heart of Kansas City! Spanning 960 sq. ft. , this 1926 home blends classic charm with modern convenience. Enjoy high-end updates including luxury vinyl flooring throughout and a cozy fireplace in the living room. The bright, functional layout includes a main-level laundry closet and an unfinished basement for extra storage. Relax on your covered front porch or enjoy the easy-care yard. With a newer roof and fresh paint, this home is truly move-in ready for its next owner. It is Renter occupied and monthly rent is $1400, 12 month lease. Seller will consider a package deal if the buyer will purchase both 4941 and 4943 Michigan at the same time. buyer agent is responsible for verifying the square footage of the home,
-
2026-04-30$155,000 Active 809-char remark
Show marketing remark (809 chars)
Welcome to this beautifully refreshed 2-bedroom, 2-bathroom Craftsman bungalow in the heart of Kansas City! Spanning 960 sq. ft. , this 1926 home blends classic charm with modern convenience. Enjoy high-end updates including luxury vinyl flooring throughout and a cozy fireplace in the living room. The bright, functional layout includes a main-level laundry closet and an unfinished basement for extra storage. Relax on your covered front porch or enjoy the easy-care yard. With a newer roof and fresh paint, this home is truly move-in ready for its next owner. It is Renter occupied and monthly rent is $1400, 12 month lease. Seller will consider a package deal if the buyer will purchase both 4941 and 4943 Michigan at the same time. buyer agent is responsible for verifying the square footage of the home,
-
2026-03-18historical $155,000 809-char remark
Show marketing remark (809 chars)
Welcome to this beautifully refreshed 2-bedroom, 2-bathroom Craftsman bungalow in the heart of Kansas City! Spanning 960 sq. ft. , this 1926 home blends classic charm with modern convenience. Enjoy high-end updates including luxury vinyl flooring throughout and a cozy fireplace in the living room. The bright, functional layout includes a main-level laundry closet and an unfinished basement for extra storage. Relax on your covered front porch or enjoy the easy-care yard. With a newer roof and fresh paint, this home is truly move-in ready for its next owner. It is Renter occupied and monthly rent is $1400, 12 month lease. Seller will consider a package deal if the buyer will purchase both 4941 and 4943 Michigan at the same time. buyer agent is responsible for verifying the square footage of the home,
-
2025-09-02historical
-
2025-08-25historical $1,400
-
2025-08-06$1,400
-
2025-06-13$160,000 Active
-
2025-06-10historical
-
2025-05-17status Active
-
2025-05-16$175,000 Active
-
2025-05-14historical
-
2023-03-23soldstatus Closed
-
2023-03-22soldstatus
-
2023-02-13status Pending
-
2023-02-12price $143,000
-
2022-12-08price $145,000
-
2022-11-05$150,000 Active
-
2022-11-05historical
-
2022-10-10$150,000 Active
-
2021-10-26soldstatus
-
2010-04-30soldstatus
-
2009-12-28$6,000
-
2009-12-12historical
-
2009-08-13$8,900
-
2002-10-22soldstatus
-
2002-10-18soldstatus
-
2002-07-25$22,900
-
2000-12-01soldstatus
-
1991-02-22soldstatus
ⓘ Source: listings_history table (triggers on properties + properties_extension) + one-shot
backfill from property_details.listing_events for pre-trigger history.
Tax reassessment forecast MO · Resets to sale price
- Current annual tax
- $548 · $46/mo
- Projected year-2 tax
- $1,406 · $117/mo
- Expected delta
- +$858/yr (+$72/mo · 156.7%)
ⓘ Screening estimate from a state-policy table — verify with the county assessor before closing.
Climate risk First Street
- Flood 1/10 Low FEMA zone X (unshaded) · 0% chance over 30 yrs
- Wildfire 1/10 Low
- Heat 4/10 Moderate 7 d/yr ≥106°F today · 17 d/yr by 30 yrs out
- Wind 2/10 Low
- Air quality 3/10 Moderate 2 unhealthy d/yr today · 4 by 30 yrs out
Nearby sold comps map
Loading sold comps map…
Walkable amenities ~0.75 mi
Loading nearby amenities…
Taxation est. · year 1
- Rental income
- $14,415
- − Mortgage interest
- −$8,122
- − Property taxes
- −$548
- − Insurance
- −$725
- − Repairs & maintenance
- −$1,153
- − Management
- −$1,153
- − Depreciation
- −$4,218
- Taxable loss
- −$1,505
- Est. tax savings @ 24.0%
- +$361
- After-tax cash flow
- $1,351/yr
For passive investors: Depreciation is non-cash, so a rental often shows a tax loss while cash-flowing — sheltering income. Rental losses are passive: they offset passive income freely, and up to $25,000/yr can offset ordinary (W-2) income if you actively participate and your MAGI is under $100k (phasing out to $0 by $150k); unused losses carry forward. On sale, claimed depreciation is recaptured at up to 25%, and gains may owe capital-gains tax (a 1031 exchange can defer both). Figures are a year-1 estimate at your 24.0% rate — not tax advice; consult a CPA.
Schools (NCES district)
- District
- Kansas City 33
- NCES district ID
- 2916400
- Math proficiency
- 12% ▼ -8.00%
- Reading proficiency
- 24% ▬ 0.00%
- Median HH income
- $35,227
- Composite
- 14.8/100
- National rank
- #9387
- State rank
- #308 of 324 in MO
Livability — Kansas City
- Score
- 78/100
- State rank
- #28
- US rank
- #2671
Category grades
Schools grade is shown separately in the Schools card above.
Census & demographics
- Census place
- Kansas City, MO
- County
- Jackson County · 687,798 people
- City population
- 439,467
- Metro
- Kansas City, MO-KS
- Population (ZIP)
- 19,644
- Household income
- $42,221
- Rent vs Own
- Severe rent burden
- 1132.0
Population outlook (Jackson County) Hauer SSP2
- Today (2025)
- 719,589 people
- By 2030
- 731,456 · +1.6%
- By 2040
- 746,689 · +3.8%
- By 2050
- 749,289 · +4.1%
- By 2075
- 736,227 · +2.3%
- By 2100
- 668,210 · -7.1%
Race, ethnicity, and origin ACS 2023
- Neighborhood character
- Predominantly Black (80%)
- Race & ethnicity
- Black 80% White 9% Hispanic / Latino 8% Two or more races 6%
- Hispanic origin (detail)
- Mexican 5%
- Common ancestry
- Lithuanian 1% Swedish 0%
- Foreign-born
- 6% · Canada
- Languages at home
- 92% English-only · Spanish 7%
Political lean MEDSL · Jackson
- 2024 margin
- D (+19.3) · D 58.9% · R 39.5% · Other 1.6%
- 2008→2024 swing
- -6.1pp toward R · 2008: 25.4pp · 2024: 19.3pp
- All cycles
- 2024: D+19.3 2020: D+22.0 2016: D+16.6 2012: D+19.0 2008: D+25.4
Not yet ingested
- Civics
- —
Market trends
- HPI YoY
- ▼ -73.32%
- Current HPI
- 267.491
- Rent YoY
- ▲ 4.42%
- Metro
- Kansas City, MO-KS
- State GDP YoY
- ▲ 1.84%
- F500 in state
- 20
Industry mix (Fortune 500 HQ in MO)
| Industry | F500 HQs | Revenue |
|---|---|---|
| Healthcare | 1 | $163B |
|
||
| Insurance | 1 | $21B |
|
||
| Industrial Technology | 1 | $17B |
|
||
| Retail | 1 | $16B |
|
||
| Industrial Distribution | 1 | $10B |
|
||
| Utilities | 1 | $9B |
|
||
Price history
+555.0% since first listed30 events — show timeline
- 2026-05-19 Price Changed $150,000 Heartland MLS as Distributed by MLS Grid
- 2026-05-15 Price Changed $140,000 Heartland MLS as Distributed by MLS Grid
- 2026-04-30 Listed $155,000 Heartland MLS as Distributed by MLS Grid
- 2026-03-18 Coming Soon $155,000 Heartland MLS as Distributed by MLS Grid
- 2025-09-02 Listing Removed — Heartland MLS as Distributed by MLS Grid
- 2025-08-25 Rental Removed $1,400 APPFOLIO
- 2025-08-06 Listed for Rent $1,400 APPFOLIO
- 2025-06-13 Listed $160,000 Heartland MLS as Distributed by MLS Grid
- 2025-06-10 Listing Removed — Heartland MLS as Distributed by MLS Grid
- 2025-05-17 Relisted — Heartland MLS as Distributed by MLS Grid
- 2025-05-16 Listed $175,000 Heartland MLS as Distributed by MLS Grid
- 2025-05-14 Listing Removed — Heartland MLS as Distributed by MLS Grid
- 2023-03-23 Sold (MLS) — Heartland MLS as Distributed by MLS Grid
- 2023-03-22 Sold (Public Records) — Public Records
- 2023-02-13 Pending — Heartland MLS as Distributed by MLS Grid
- 2023-02-12 Price Changed $143,000 Heartland MLS as Distributed by MLS Grid
- 2022-12-08 Price Changed $145,000 Heartland MLS as Distributed by MLS Grid
- 2022-11-05 Listing Removed — Heartland MLS as Distributed by MLS Grid
- 2022-11-05 Listed $150,000 Heartland MLS as Distributed by MLS Grid
- 2022-10-10 Listed $150,000 Heartland MLS as Distributed by MLS Grid
- 2021-10-26 Sold (Public Records) — Public Records
- 2010-04-30 Sold (MLS) — Heartland MLS as Distributed by MLS Grid
- 2009-12-28 Listed $6,000 Heartland MLS as Distributed by MLS Grid
- 2009-12-12 Listing Removed — Heartland MLS as Distributed by MLS Grid
- 2009-08-13 Listed $8,900 Heartland MLS as Distributed by MLS Grid
- 2002-10-22 Sold (Public Records) — Public Records
- 2002-10-18 Sold (MLS) — Heartland MLS as Distributed by MLS Grid
- 2002-07-25 Listed $22,900 Heartland MLS as Distributed by MLS Grid
- 2000-12-01 Sold (Public Records) — Public Records
- 1991-02-22 Sold (Public Records) — Public Records
Property tax history
+5.6%/yrLatest (2025): $548 · -70.8% YoY. Source: county tax records.
Cash-flow waterfall
monthlySold comps — $/sqft
last 12 mo · ≤1 miLoading sold comps…