7060 Crestwood Dr · Delphi, IN
Flood risk 1/10 · Minimal
- FEMA flood zone
- X (unshaded)
- Chance of flooding over 30 yrs
- 0.0%
- Est. flood insurance / yr
- $473 – $860
Fire risk 1/10 · Minimal
- Est. fire insurance / yr
- $717 – $1,331
Heat risk 3/10 · Minor
- Hot days now (above 102°F)
- 7 days/yr
- Hot days in 30 yrs
- 17 days/yr
Wind risk 2/10 · Minimal
- Chance of severe wind over 30 yrs
- —
Air-quality risk 2/10 · Minimal
- Unhealthy air days now
- 1 days/yr
- Unhealthy air days in 30 yrs
- 2 days/yr
Risk factors via First Street. Map © Google.
Why this score? — see what drove the B+ grade
The composite is a weighted blend of 9 inputs, each scored 0–100. Each bar is that input's sub-score; the figure is the points it added to the 100-point composite (weight × sub-score).
- Cash flow +30.0/30.0
- ARV discount +15.0/15.0
- DSCR +10.0/10.0
- 1% rule +8.9/10.0
- Livability +3.6/5.0
- Schools +3.3/10.0
- Rent growth +2.5/5.0
- Condition / age +2.5/5.0
- Appreciation +0.0/10.0
$139,900
🖨 Deal sheet 📄 Offer letter ✓ Due diligence
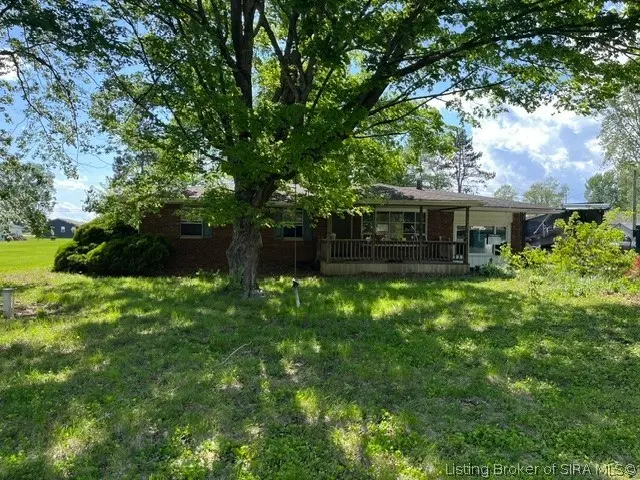
Listing remarks
Huge Ranch Home in Quiet Neighborhood. Real Hardwood Flooring, Large Family Room, Side Entry Garage, Needs ReHab. Well Water. Here is your chance to make it your own. Partial Basement under Family Room. Lot is landscaped and shaded with huge mature trees.
Key facts
- Side entry garage
- Ranch home
- Large family room
Tags
Property features AI
Exterior
- Parking: Attached side-facing garage; Two garage spaces
- Utilities: Well water
- Home design: Single-story home; Frame construction; Shingle roof; Entry/facing information not provided
- Construction: Frame construction; Shingle roof; Partial unfinished below-grade area
- Exterior features: Deck; Paved road frontage; Residential zoning
Interior
- Kitchen: Kitchen on the first level
- Bedrooms: Two bedrooms on the first level
- Bathrooms: One full bathroom; One half bathroom
- Heating & cooling: Forced air heating
- Interior features: Main-level primary suite; Utility room; Unfinished partial basement
- Laundry & utility: Main-level laundry room
Neighborhood map
What this means for you Summary
Snapshot
- This is a 3-bed/1.5-bath single-family listed at $140k.
Deal economics
- At list price, monthly cash flow is $557 ($7k/yr) — positive.
- The deal already cash-flows at list — no discount required.
- Meets the 1% rule at list price ($2k rent vs $140k).
- Recommended offer: $138k (1.5% below list) — sets the bar for market timing.
- Cap rate 11.1% vs local median 5.2% in Delphi — top-decile yield for the area; either an underpriced asset or a hidden risk that comps aren't pricing in. Stress-test before assuming the spread holds.
Location & tenants
- Location reads 72/100 on livability (#112 in IN) — a middle-class / working-renter tenant base. Strengths: crime A+, cost of living A+, housing A+; Watch: schools D+, employment D+, amenities F.
- Delphi Community School Corporation (town): math 36% / reading 41% proficiency, ranked #160 of 301 in IN (top 53%) — families likely to look elsewhere, expect single-tenant / working-renter base with shorter leases.
- Market conditions: 45 active listings in the ZIP; 3 comparable units currently listed for rent nearby; rentals leasing fast (median 14d on market — plan ~1-2 weeks tenant-placement turnaround); 32 units permitted in Carroll County in 2024 (0 in 5+ unit buildings).
Forward outlook
- Local home prices are declining (-3.0%/yr); year-one equity from $967 of loan paydown is wiped out by about $4k of value loss. Plan a longer hold.
- Carroll County population projected at -14% by 2050 — secular population decline; favor cash flow + early exit over multi-decade hold.
- At projected returns (-3.0% appreciation + 3.0% rent growth), your $39k cash investment doubles in ~8 years — after that, you're playing with house money.
Negotiation context
- It's been on market 16 days — a 2% lower offer ($138k) is reasonable based on typical stale-listing flexibility.
- Current owner paid $121k; 16% above their basis — modest negotiation headroom, anchor on the comps not their cost.
Questions for the listing agent
- Built in 1971 — when were the roof, HVAC, electrical panel, plumbing, and water heater last replaced?
- Is there a deadline driving the sale (1031 exchange, divorce, estate, relocation)? That informs how much negotiation room exists.
- Schools are D-rated, which usually means shorter tenancies and higher turnover. Who's the typical renter profile here, and what's been the actual vacancy rate?
- What's the average days-on-market for RENTAL listings here right now (not sales)? A rising rental-DOM trend means longer vacancies and softer asking-rent achievability than the comps imply.
- What's the recent tenant-quality profile in this submarket — average credit score on applications, eviction rate, late-payment / NSF rate, and stable-employment percentage? A property-management company in the area should have these aggregated.
- How much new for-sale + rental construction is in the pipeline within 1–3 miles? Heavy new supply typically softens prices + rents 12–24 months out; constrained supply supports both.
Investment metrics
- 1% rule
- 1.39% ✓
- Cap rate
- 11.07%
- Cash-on-cash
- 17.06%
- DSCR
- 1.76
- GRM
- 6.0
CMA / ARV
- ARV (median comp)
- $279,119
- List price
- $139,900
- Delta
- -49.88%
- Verdict
- UNDERPRICED
- Comps
- 20 within 1.0 mi
Show comp detail 11 sales within ~0.75 mi
| Address | Dist | Beds/Ba | Sqft | Sold | Price | $/sf | Match |
|---|---|---|---|---|---|---|---|
| 7060 Crestwood Dr | 0.00mi | 3/1.5 | 1,748 (0%) | 0mo | $121,000 | $69 | 100 |
| 200 Heritage Dr | 0.32mi | 3/2.0 | 1,803 (+3%) | 2mo | $310,000 | $172 | 77 |
| 3 Cobblestone Ct | 0.37mi | 3/2.5 | 1,771 (+1%) | 11mo | $380,000 | $215 | 68 |
| 424 W Summit St | 0.74mi | 4/2.0 (+1) | 1,741 (-0%) | 3mo | $140,000 | $80 | 56 |
| 411 Heritage Dr | 0.48mi | 3/2.5 | 1,918 (+10%) | 3mo | $285,000 | $149 | 55 |
| 127 E Vine St | 0.64mi | 3/2.0 | 1,634 (-6%) | 9mo | $320,000 | $196 | 50 |
| 409 W Heritage Dr | 0.47mi | 4/2.5 (+1) | 1,992 (+14%) | 1mo | $285,000 | $143 | 45 |
| 114 Williston Ct | 0.62mi | 3/2.0 | 1,953 (+12%) | 9mo | $405,000 | $207 | 42 |
| 128 W Summit St | 0.67mi | 2/1.0 (-1) | 1,554 (-11%) | 4mo | $120,000 | $77 | 40 |
| 208 W Vine St | 0.60mi | 3/1.5 | 1,593 (-9%) | 23mo | $135,000 | $85 | 38 |
| 413 W Summit St | 0.74mi | 3/2.0 | 1,508 (-14%) | 7mo | $257,000 | $170 | 34 |
Match score weights: distance 35% · size 25% · config 20% · recency 20%. Top-matched comps best support the ARV.
Projected returns pro-forma
-3.0% appreciation · 3.0% rent growth · sell at horizon
- IRR
- 8.3%
- Equity multiple
- 1.33×
- Total profit
- $12,829
- Equity at exit
- $20,860
- IRR
- 17.6%
- Equity multiple
- 2.45×
- Total profit
- $56,993
- Equity at exit
- $12,096
Cash invested: $39,172 (down + closing). Projections, not guarantees.
Landlord ↔ Tenant lean methodology
- Overall (STATE)
- 90 Strongly Landlord-Friendly
- State Indiana
- 90 Strongly Landlord-Friendly · R+11
- County
- — inherits STATE
- City
- — inherits STATE
ZIP-level market 46923
- Home prices YoY
- -10.5%
- Active inventory
- 45
- Price-to-rent
- 6.0×
Monthly cashflow live
- Estimated rent
- $1,950 medium interval (Pro) →
- Mortgage (P&I)
- −$734
- Tax from tax record
- −$192 /mo · $2,302/yr
- Insurance
- −$58
- HOA
- −$0
- Vacancy / Maint / Mgmt
- −$410
- Net cashflow
- $557
Break-even live
UW: 25.0% down · 7.5% · 30yr · 1.5% tax · 5.0% vac · 8.0% maint · 8.0% mgmt
Financing live
Cash to close
- Down payment
- $34,975
- Closing costs
- $4,197
- Reserves months
- —
- Total cash needed
- —
Loan-product check · same deal, 3 products live
Conventional
25% down · 7.5% · 30yr
- Down + closing
- —
- Monthly P&I
- —
- Monthly cashflow
- —
- DSCR
- —
- Eligible?
- —
Personal DTI + credit; lowest rate.
DSCR
20% down · 8.5% · 30yr
- Down + closing
- —
- Monthly P&I
- —
- Monthly cashflow
- —
- DSCR
- —
- Eligible?
- —
No personal income docs; deal must DSCR.
Hard money
10% down · 12.0% · 12mo
- Down + closing
- —
- Monthly P&I
- —
- Monthly cashflow
- —
- DSCR
- —
- Eligible?
- —
Short-term bridge; refi at stabilization.
Rent comps 3 comps
| Address | Beds | Baths | Sqft | Rent | $/sqft | DOM | Units | Dist |
|---|---|---|---|---|---|---|---|---|
| 115 E Vine St Delphi, IN | 3.0 | 2.5 | 1590 | $1,975 | $1.24 | 13d | 1 | 0.59mi |
| 921 S Washington St Delphi, IN | 4.0 | 1.0 | 2244 | $1,650 | $0.74 | 43d | 1 | 0.62mi |
| 126 E North St Delphi, IN | 4.0 | 3.0 | 2100 | $2,250 | $1.07 | 13d | 1 | 0.74mi |
Listing history 1 events
-
2026-05-11$139,900 Active 125-char remark
ⓘ Source: listings_history table (triggers on properties + properties_extension) + one-shot
backfill from property_details.listing_events for pre-trigger history.
Tax reassessment forecast IN · Partial reset (capped growth)
- Current annual tax
- $2,302 · $192/mo
- Projected year-2 tax
- $2,302 · $192/mo
- Expected delta
- $0/yr ($0/mo · 0.0%)
ⓘ Screening estimate from a state-policy table — verify with the county assessor before closing.
Climate risk First Street
- Flood 1/10 Low FEMA zone X (unshaded) · 0% chance over 30 yrs
- Wildfire 1/10 Low
- Heat 3/10 Moderate 7 d/yr ≥102°F today · 17 d/yr by 30 yrs out
- Wind 2/10 Low
- Air quality 2/10 Low 1 unhealthy d/yr today · 2 by 30 yrs out
Nearby sold comps map
Loading sold comps map…
Walkable amenities ~0.75 mi
Loading nearby amenities…
Taxation est. · year 1
- Rental income
- $23,401
- − Mortgage interest
- −$7,837
- − Property taxes
- −$2,302
- − Insurance
- −$700
- − Repairs & maintenance
- −$1,872
- − Management
- −$1,872
- − Depreciation
- −$4,070
- Taxable income
- $4,748
- Est. tax owed @ 24.0%
- −$1,140
- After-tax cash flow
- $5,541/yr
For passive investors: Depreciation is non-cash, so a rental often shows a tax loss while cash-flowing — sheltering income. Rental losses are passive: they offset passive income freely, and up to $25,000/yr can offset ordinary (W-2) income if you actively participate and your MAGI is under $100k (phasing out to $0 by $150k); unused losses carry forward. On sale, claimed depreciation is recaptured at up to 25%, and gains may owe capital-gains tax (a 1031 exchange can defer both). Figures are a year-1 estimate at your 24.0% rate — not tax advice; consult a CPA.
Schools (NCES district)
- District
- Delphi Community School Corporation
- NCES district ID
- 1802700
- Math proficiency
- 36% ▼ -11.00%
- Reading proficiency
- 41% ▼ -8.00%
- Median HH income
- $47,044
- Composite
- 32.95/100
- National rank
- #5589
- State rank
- #160 of 301 in IN
Livability — Delphi
- Score
- 72/100
- State rank
- #112
- US rank
- #5934
Category grades
Schools grade is shown separately in the Schools card above.
Census & demographics
- Population (ZIP)
- 8,036
Population outlook (Carroll County) Hauer SSP2
- Today (2025)
- 19,409 people
- By 2030
- 18,970 · -2.3%
- By 2040
- 17,934 · -7.6%
- By 2050
- 16,753 · -13.7%
- By 2075
- 14,084 · -27.4%
- By 2100
- 11,350 · -41.5%
Race, ethnicity, and origin ACS 2023
- Neighborhood character
- Predominantly White (90%)
- Race & ethnicity
- White 90% Hispanic / Latino 7% Two or more races 4%
- Hispanic origin (detail)
- Mexican 6%
- Common ancestry
- Lithuanian 2% Slovak 2% Italian 2%
- Foreign-born
- 3% · Canada, Jamaica
- Languages at home
- 95% English-only · Spanish 5%
Political lean MEDSL · Carroll
- 2024 margin
- Solid R (+52.1) · D 23.1% · R 75.2% · Other 1.7%
- 2008→2024 swing
- -39.3pp toward R · 2008: -12.8pp · 2024: -52.1pp
- All cycles
- 2024: R+52.1 2020: R+51.2 2016: R+50.9 2012: R+30.3 2008: R+12.8
Not yet ingested
- Civics
- —
Market trends
- HPI YoY
- ▼ -30.54%
- Current HPI
- 261.2451
- Rent YoY
- —
- Metro
- —
- State GDP YoY
- ▲ 2.90%
- F500 in state
- 18
Industry mix (Fortune 500 HQ in IN)
| Industry | F500 HQs | Revenue |
|---|---|---|
| Industrial Machinery | 2 | $37B |
|
||
| Healthcare | 1 | $177B |
|
||
| Pharmaceuticals | 1 | $45B |
|
||
| Metals / Steel | 1 | $18B |
|
||
| Agriculture | 1 | $17B |
|
||
| Packaging | 1 | $12B |
|
||
Price history
-13.5% since first listed3 events — show timeline
- 2026-06-10 Sold (MLS) $121,000 SIRA
- 2026-05-28 Delisted — SIRA
- 2026-05-11 Listed $139,900 SIRA
Property tax history
+11.2%/yrLatest (2025): $2,302 · +3.0% YoY. Source: county tax records.
Cash-flow waterfall
monthlySold comps — $/sqft
last 12 mo · ≤1 miLoading sold comps…