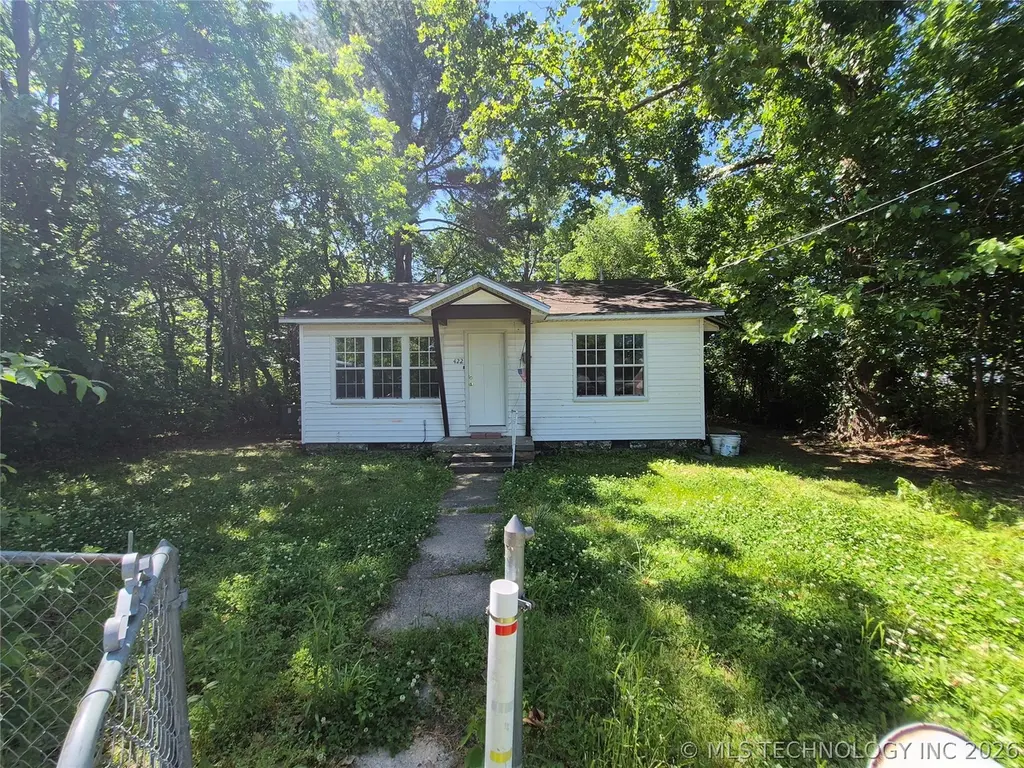
422 S Locke St · Pryor Creek, OK
Flood risk 1/10 · Minimal
- FEMA flood zone
- X (unshaded)
- Chance of flooding over 30 yrs
- 0.0%
- Est. flood insurance / yr
- $507 – $1,088
Fire risk 5/10 · Moderate
- Est. fire insurance / yr
- $2,463 – $4,575
Heat risk 7/10 · Major
- Hot days now (above 112°F)
- 7 days/yr
- Hot days in 30 yrs
- 20 days/yr
Wind risk 2/10 · Minimal
- Chance of severe wind over 30 yrs
- 3.0%
Air-quality risk 2/10 · Minimal
- Unhealthy air days now
- 1 days/yr
- Unhealthy air days in 30 yrs
- 1 days/yr
Risk factors via First Street. Map © Google.
Why this score? — see what drove the C- grade
The composite is a weighted blend of 9 inputs, each scored 0–100. Each bar is that input's sub-score; the figure is the points it added to the 100-point composite (weight × sub-score).
- Cash flow +21.3/30.0
- ARV discount +8.4/15.0
- DSCR +6.8/10.0
- 1% rule +5.6/10.0
- Condition / age +3.8/5.0
- Livability +3.5/5.0
- Rent growth +2.5/5.0
- Schools +1.9/10.0
- Appreciation +0.0/10.0
$99,900
🖨 Deal sheet 📄 Offer letter ✓ Due diligence
Listing remarks
Quaint 2 Bed Home on a dead end street. This neat little home has newly installed wall and ceiling coverings, New flooring throughout, Fresh Paint some new lighting and plumbing fixtures. New cabinets in the kitchen and is situated on a large treed lot new the park, school, shopping and restaurants. This neat little home wont last long.
Key facts
- Large treed lot
- Fresh paint
- 1 acre lot
Tags
Property features AI
Exterior
- Parking: Dirt driveway
- Security: No safety shelter
- Utilities: Electricity available; Public water; Public sewer
- Home design: Single-story; Faces north; Crawlspace foundation
- Construction: Built with vinyl siding and wood frame; Asphalt/fiberglass roof
- Exterior features: Enclosed porch; Porch; Dirt driveway; Mature trees
Interior
- Kitchen: Eat-in kitchen; Oven; Range; Stove
- Bedrooms: Master bedroom (first floor); Additional bedroom (first floor)
- Flooring: Vinyl flooring
- Bathrooms: One full bathroom (hall/full) (first floor)
- Heating & cooling: Central heating (electric); Central air conditioning
- Interior features: Butcher block counters; Gas range connection; Vinyl windows
- Laundry & utility: Electric water heater
Neighborhood map
What this means for you Summary
Snapshot
- This is a 2-bed/1.0-bath single-family listed at $100k. Condition is rated good.
Deal economics
- At list price, monthly cash flow is $146 ($2k/yr) — positive.
- The deal already cash-flows at list — no discount required.
- Meets the 1% rule at list price ($1k rent vs $100k).
- Cap rate 8.0% vs local median 3.9% in Pryor Creek — top-decile yield for the area; either an underpriced asset or a hidden risk that comps aren't pricing in. Stress-test before assuming the spread holds.
Location & tenants
- Location reads 69/100 on livability (#51 in OK) — a middle-class / working-renter tenant base. Strengths: cost of living A+, housing A+, health & safety A+; Watch: schools D, crime D-, amenities F.
- Pryor (town): math 24% / reading 21% proficiency, ranked #143 of 270 in OK (top 53%) — low school quality limits family demand, transient renter base, plan for 1-2y turnover.
- Market conditions: 159 active listings in the ZIP; 1 comparable units currently listed for rent nearby; 23 units permitted in Mayes County in 2024 (0 in 5+ unit buildings).
Forward outlook
- Local home prices are declining (-3.0%/yr); year-one equity from $691 of loan paydown is wiped out by about $3k of value loss. Plan a longer hold.
- Mayes County population projected at -10% by 2050 — secular population decline; favor cash flow + early exit over multi-decade hold.
Negotiation context
- Only 7 days on market — expect competitive offers; lowballing is unlikely to land.
Risks & watch-outs
- Watch-outs: built in 1950 — expect roof / HVAC / electrical / plumbing capex.
- Climate carrying-cost: moderate wildfire risk; extreme-heat days projected 7→20/yr by 2055 (HVAC capex compounding) — expect insurance premiums to compound above CPI over the hold.
Questions for the listing agent
- Built in 1950 — when were the roof, HVAC, electrical panel, plumbing, and water heater last replaced?
- Is there a deadline driving the sale (1031 exchange, divorce, estate, relocation)? That informs how much negotiation room exists.
- Schools are D-rated, which usually means shorter tenancies and higher turnover. Who's the typical renter profile here, and what's been the actual vacancy rate?
- Crime grade is D in this area — have there been break-ins, vandalism, or insurance claims at this property in the last 3 years? What carrier currently insures it and at what premium?
- What's the average days-on-market for RENTAL listings here right now (not sales)? A rising rental-DOM trend means longer vacancies and softer asking-rent achievability than the comps imply.
- What's the recent tenant-quality profile in this submarket — average credit score on applications, eviction rate, late-payment / NSF rate, and stable-employment percentage? A property-management company in the area should have these aggregated.
- How much new for-sale + rental construction is in the pipeline within 1–3 miles? Heavy new supply typically softens prices + rents 12–24 months out; constrained supply supports both.
Investment metrics
- 1% rule
- 1.06% ✓
- Cap rate
- 8.05%
- Cash-on-cash
- 6.27%
- DSCR
- 1.28
- GRM
- 7.9
CMA / ARV
- ARV (on-the-fly)
- $101,920
- Comps found
- 9
Show comp detail 9 sales within ~0.75 mi
| Address | Dist | Beds/Ba | Sqft | Sold | Price | $/sf | Match |
|---|---|---|---|---|---|---|---|
| 902 SE 1st St | 0.37mi | 2/1.0 | 770 (+6%) | 5mo | $120,000 | $156 | 69 |
| 1110 SE 2nd Ct | 0.43mi | 2/1.0 | 768 (+6%) | 12mo | $72,000 | $94 | 61 |
| 125 N Elliott St | 0.67mi | 2/1.0 | 760 (+4%) | 3mo | $80,000 | $105 | 59 |
| 316 SE 4th St | 0.23mi | 2/1.0 | 806 (+11%) | 17mo | $125,000 | $155 | 57 |
| 411 S Adair St | 0.37mi | 2/1.0 | 815 (+12%) | 12mo | $145,000 | $178 | 52 |
| 201 N Indianola St | 0.71mi | 2/1.0 | 784 (+8%) | 6mo | $75,200 | $96 | 49 |
| 108 N Ora | 0.68mi | 2/1.0 | 752 (+3%) | 18mo | $105,000 | $140 | 48 |
| 607 S Wood St | 0.50mi | 3/1.0 (+1) | 816 (+12%) | 22mo | $125,000 | $153 | 33 |
| 220 S Taylor St | 0.58mi | 2/1.0 | 832 (+14%) | 22mo | $100,000 | $120 | 31 |
Match score weights: distance 35% · size 25% · config 20% · recency 20%. Top-matched comps best support the ARV.
Projected returns pro-forma
-3.0% appreciation · 3.0% rent growth · sell at horizon
- IRR
- -6.6%
- Equity multiple
- 0.75×
- Total profit
- $-6,858
- Equity at exit
- $14,895
- IRR
- 3.0%
- Equity multiple
- 1.22×
- Total profit
- $6,087
- Equity at exit
- $8,638
Cash invested: $27,972 (down + closing). Projections, not guarantees.
Landlord ↔ Tenant lean methodology
- Overall (STATE)
- 83 Strongly Landlord-Friendly
- State Oklahoma
- 83 Strongly Landlord-Friendly · R+20
- County
- — inherits STATE
- City
- — inherits STATE
ZIP-level market 74361
- Active inventory
- 159
- Price-to-rent
- 7.9×
Monthly cashflow live
- Estimated rent
- $1,059 medium interval (Pro) →
- Mortgage (P&I)
- −$524
- Tax est. 1.5%
- −$125 /mo · $1,498/yr
- Insurance
- −$42
- HOA
- −$0
- Vacancy / Maint / Mgmt
- −$222
- Net cashflow
- $146
Break-even live
UW: 25.0% down · 7.5% · 30yr · 1.5% tax · 5.0% vac · 8.0% maint · 8.0% mgmt
Financing live
Cash to close
- Down payment
- $24,975
- Closing costs
- $2,997
- Reserves months
- —
- Total cash needed
- —
Loan-product check · same deal, 3 products live
Conventional
25% down · 7.5% · 30yr
- Down + closing
- —
- Monthly P&I
- —
- Monthly cashflow
- —
- DSCR
- —
- Eligible?
- —
Personal DTI + credit; lowest rate.
DSCR
20% down · 8.5% · 30yr
- Down + closing
- —
- Monthly P&I
- —
- Monthly cashflow
- —
- DSCR
- —
- Eligible?
- —
No personal income docs; deal must DSCR.
Hard money
10% down · 12.0% · 12mo
- Down + closing
- —
- Monthly P&I
- —
- Monthly cashflow
- —
- DSCR
- —
- Eligible?
- —
Short-term bridge; refi at stabilization.
Rent comps 1 comps
| Address | Beds | Baths | Sqft | Rent | $/sqft | DOM | Units | Dist |
|---|---|---|---|---|---|---|---|---|
| 1707 S Elliott St Pryor, OK | 1.0–2.0 | 1.0–2.0 | 870 | $1,275 | $1.47 | 1d | 1 | 1.08mi |
Listing history 2 events
-
2026-05-18status Pending
-
2026-05-11$99,900 Active
ⓘ Source: listings_history table (triggers on properties + properties_extension) + one-shot
backfill from property_details.listing_events for pre-trigger history.
Climate risk First Street
- Flood 1/10 Low FEMA zone X (unshaded) · 0% chance over 30 yrs
- Wildfire 5/10 Major
- Heat 7/10 Severe 7 d/yr ≥112°F today · 20 d/yr by 30 yrs out
- Wind 2/10 Low 3% chance of damaging wind over 30 yrs
- Air quality 2/10 Low 1 unhealthy d/yr today · 1 by 30 yrs out
Nearby sold comps map
Loading sold comps map…
Walkable amenities ~0.75 mi
Loading nearby amenities…
Taxation est. · year 1
- Rental income
- $12,708
- − Mortgage interest
- −$5,596
- − Property taxes
- −$1,498
- − Insurance
- −$500
- − Repairs & maintenance
- −$1,017
- − Management
- −$1,017
- − Depreciation
- −$2,906
- Taxable income
- $175
- Est. tax owed @ 24.0%
- −$42
- After-tax cash flow
- $1,713/yr
For passive investors: Depreciation is non-cash, so a rental often shows a tax loss while cash-flowing — sheltering income. Rental losses are passive: they offset passive income freely, and up to $25,000/yr can offset ordinary (W-2) income if you actively participate and your MAGI is under $100k (phasing out to $0 by $150k); unused losses carry forward. On sale, claimed depreciation is recaptured at up to 25%, and gains may owe capital-gains tax (a 1031 exchange can defer both). Figures are a year-1 estimate at your 24.0% rate — not tax advice; consult a CPA.
Condition & rehab AI · 5 photos
This quaint 2-bedroom home on a dead-end street has been recently renovated with new flooring, cabinets, and lighting. The exterior has been refreshed with new siding and paint, making it move-in ready.
Value-add opportunities
- Both Painting exterior and interior walls — Enhances curb appeal and interior aesthetics
- Both Upgrading lighting fixtures — Improves ambiance and energy efficiency
- Both Adding smart home features — Enhances convenience and marketability
Renovation cost estimate screening
Value-add ROI direction
- Both Painting exterior and interior walls — Enhances curb appeal and interior aesthetics ↑
- Both Upgrading lighting fixtures — Improves ambiance and energy efficiency ↑
- Both Adding smart home features — Enhances convenience and marketability ↑
ⓘ Cost ranges are severity-bucket heuristics (US national rule-of-thumb). Get contractor quotes + a written scope before underwriting a rehab budget.
Schools (NCES district)
- District
- Pryor
- NCES district ID
- 4025200
- Math proficiency
- 24% ▼ -13.00%
- Reading proficiency
- 21% ▼ -13.00%
- Median HH income
- $44,306
- Composite
- 19.46/100
- National rank
- #8774
- State rank
- #143 of 270 in OK
Livability — Pryor Creek
- Score
- 69/100
- State rank
- #51
- US rank
- #8653
Category grades
Schools grade is shown separately in the Schools card above.
Census & demographics
- Census place
- Pryor Creek, OK
- County
- Mayes County · 17,612 people
- City population
- 17,582
- Metro
- nan
- Population (ZIP)
- 17,612
- Household income
- $58,681
- Rent vs Own
- Severe rent burden
- 326.0
Population outlook (Mayes County) Hauer SSP2
- Today (2025)
- 39,941 people
- By 2030
- 39,172 · -1.9%
- By 2040
- 37,540 · -6.0%
- By 2050
- 35,854 · -10.2%
- By 2075
- 32,361 · -19.0%
- By 2100
- 28,054 · -29.8%
Race, ethnicity, and origin ACS 2023
- Neighborhood character
- Diverse neighborhood (Simpson 0.58)
- Race & ethnicity
- White 65% Native American 18% Two or more races 13% Hispanic / Latino 5%
- Common ancestry
- Slovak 3% Romanian 1% Serbian 1%
- Foreign-born
- 2% · Canada
- Languages at home
- 96% English-only · Spanish 2%
Political lean MEDSL · Mayes
- 2024 margin
- Solid R (+57.5) · D 20.3% · R 77.8% · Other 1.9%
- 2008→2024 swing
- -29.4pp toward R · 2008: -28.1pp · 2024: -57.5pp
- All cycles
- 2024: R+57.5 2020: R+55.1 2016: R+51.7 2012: R+33.3 2008: R+28.1
Not yet ingested
- Civics
- —
Market trends
- HPI YoY
- ▼ -145.81%
- Current HPI
- 247.7737
- Rent YoY
- —
- Metro
- nan
- State GDP YoY
- ▲ 1.55%
- F500 in state
- 6
Industry mix (Fortune 500 HQ in OK)
| Industry | F500 HQs | Revenue |
|---|---|---|
| Energy | 3 | $48B |
|
||
Price history
2 events — show timeline
- 2026-05-18 Pending — MLS Technology, Inc.
- 2026-05-11 Listed $99,900 MLS Technology, Inc.
Cash-flow waterfall
monthlySold comps — $/sqft
last 12 mo · ≤1 miLoading sold comps…