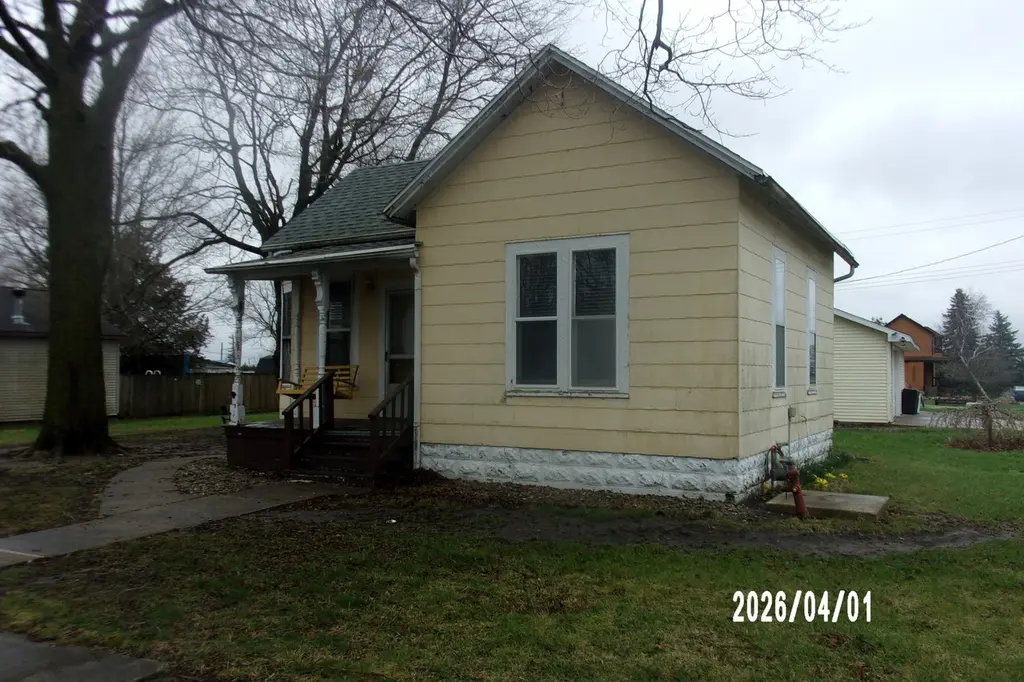
309 N Colfax St · Crescent City, IL
Flood risk 1/10 · Minimal
- FEMA flood zone
- X (unshaded)
- Chance of flooding over 30 yrs
- 0.0%
- Est. flood insurance / yr
- $473 – $860
Fire risk 1/10 · Minimal
- Est. fire insurance / yr
- $804 – $1,492
Heat risk 3/10 · Minor
- Hot days now (above 104°F)
- 7 days/yr
- Hot days in 30 yrs
- 17 days/yr
Wind risk 2/10 · Minimal
- Chance of severe wind over 30 yrs
- 1.0%
Air-quality risk 2/10 · Minimal
- Unhealthy air days now
- 1 days/yr
- Unhealthy air days in 30 yrs
- 1 days/yr
Risk factors via First Street. Map © Google.
Why this score? — see what drove the C+ grade
The composite is a weighted blend of 9 inputs, each scored 0–100. Each bar is that input's sub-score; the figure is the points it added to the 100-point composite (weight × sub-score).
- Cash flow +17.7/30.0
- ARV discount +15.0/15.0
- Appreciation +5.9/10.0
- DSCR +5.5/10.0
- 1% rule +4.3/10.0
- Schools +3.7/10.0
- Livability +3.1/5.0
- Rent growth +2.5/5.0
- Condition / age +2.5/5.0
$94,500
🖨 Deal sheet 📄 Offer letter ✓ Due diligence
Listing remarks MLS
Very nice two bedroom home with some updates the home has hardwood floors, original woodwork thru out, there is a two car plus garage with heat and added shop on the side also there is a new 12x20 Yoder shed beside the garage, all appliances are 2024 plus new water heater and has large double lot on the corner. The property is set up with invisible pet fence and it will stay.
Key facts
- Heated shop
- New water heater
- Double lot
Tags
Neighborhood map
What this means for you Summary
Snapshot
- This is a 2-bed/1.0-bath single-family listed at $94k.
Deal economics
- At list price, monthly cash flow is $76 ($908/yr) — positive.
- The deal already cash-flows at list — no discount required.
- To meet the 1% rule (rent ≥ 1% of price), the offer needs to be $88k (6.8% below list).
- Recommended offer: $88k (6.8% below list) — sets the bar for 1% rule.
Location & tenants
- Location reads 62/100 on livability (#822 in IL) — a middle-class / working-renter tenant base. Strengths: cost of living A+, housing A+; Watch: crime D+, employment D+, amenities F.
- Crescent Iroquois CUSD 249 (rural): math 30% / reading 50% proficiency, ranked #305 of 919 in IL (top 33%) — families likely to look elsewhere, expect single-tenant / working-renter base with shorter leases.
- Market conditions: 6 active listings in the ZIP; 14 units permitted in Iroquois County in 2024 (0 in 5+ unit buildings).
Forward outlook
- In year one you build about $2k of equity ($653 loan paydown + $2k appreciation (1.9% local appreciation)).
- Iroquois County population projected at -20% by 2050 — secular population decline; favor cash flow + early exit over multi-decade hold.
- At projected returns (1.9% appreciation + 3.0% rent growth), your $26k cash investment doubles in ~7 years — after that, you're playing with house money.
Negotiation context
- It's been on market 78 days — a 6% lower offer ($89k) is reasonable based on typical stale-listing flexibility.
- 3 sale attempts since 19y ago; this cycle's ask has dropped $10k (10%) from the opening price — seller is motivated, your offer sets the floor, not the list.
- Current owner paid $48k; list at $94k implies a 97% gain — meaningful room to come down on a strong offer.
Risks & watch-outs
- Watch-outs: built in 1890 — expect roof / HVAC / electrical / plumbing capex.
Questions for the listing agent
- It's been on market 78 days. Have you received any prior offers? Is the seller open to a 7% concession, seller financing, or rate buy-down credit?
- Built in 1890 — when were the roof, HVAC, electrical panel, plumbing, and water heater last replaced?
- Why hasn't it sold? Are there any deal-killer items the seller is aware of (foundation, flood, title, zoning, code violations)?
- Is there a deadline driving the sale (1031 exchange, divorce, estate, relocation)? That informs how much negotiation room exists.
- Crime grade is D in this area — have there been break-ins, vandalism, or insurance claims at this property in the last 3 years? What carrier currently insures it and at what premium?
- What's the average days-on-market for RENTAL listings here right now (not sales)? A rising rental-DOM trend means longer vacancies and softer asking-rent achievability than the comps imply.
- What's the recent tenant-quality profile in this submarket — average credit score on applications, eviction rate, late-payment / NSF rate, and stable-employment percentage? A property-management company in the area should have these aggregated.
- How much new for-sale + rental construction is in the pipeline within 1–3 miles? Heavy new supply typically softens prices + rents 12–24 months out; constrained supply supports both.
Investment metrics
- 1% rule
- 0.93% ✗
- Cap rate
- 7.25%
- Cash-on-cash
- 3.43%
- DSCR
- 1.15
- GRM
- 8.9
CMA / ARV
- ARV (median comp)
- $121,770
- List price
- $94,500
- Delta
- -22.39%
- Verdict
- UNDERPRICED
- Comps
- 10 within 1.0 mi
Show comp detail 1 sale within ~0.75 mi
| Address | Dist | Beds/Ba | Sqft | Sold | Price | $/sf | Match |
|---|---|---|---|---|---|---|---|
| 408 South St | 0.35mi | 3/1.0 (+1) | 1,047 (+13%) | 20mo | $35,000 | $33 | 40 |
Match score weights: distance 35% · size 25% · config 20% · recency 20%. Top-matched comps best support the ARV.
Projected returns pro-forma
1.89% appreciation · 3.0% rent growth · sell at horizon
- IRR
- 7.6%
- Equity multiple
- 1.41×
- Total profit
- $10,773
- Equity at exit
- $36,723
- IRR
- 10.9%
- Equity multiple
- 2.46×
- Total profit
- $38,665
- Equity at exit
- $52,462
Cash invested: $26,460 (down + closing). Projections, not guarantees.
Landlord ↔ Tenant lean methodology
- Overall (STATE)
- 43 Moderately Tenant-Leaning
- State Illinois
- 43 Moderately Tenant-Leaning · D+7
- County
- — inherits STATE
- City
- — inherits STATE
ZIP-level market 60928
- Home prices YoY
- 1.5%
- Active inventory
- 6
- Price-to-rent
- 8.9×
Monthly cashflow live
- Estimated rent
- $880 medium interval (Pro) →
- Mortgage (P&I)
- −$496
- Tax from tax record
- −$85 /mo · $1,019/yr
- Insurance
- −$39
- HOA
- −$0
- Vacancy / Maint / Mgmt
- −$185
- Net cashflow
- $76
Break-even live
UW: 25.0% down · 7.5% · 30yr · 1.5% tax · 5.0% vac · 8.0% maint · 8.0% mgmt
Financing live
Cash to close
- Down payment
- $23,625
- Closing costs
- $2,835
- Reserves months
- —
- Total cash needed
- —
Loan-product check · same deal, 3 products live
Conventional
25% down · 7.5% · 30yr
- Down + closing
- —
- Monthly P&I
- —
- Monthly cashflow
- —
- DSCR
- —
- Eligible?
- —
Personal DTI + credit; lowest rate.
DSCR
20% down · 8.5% · 30yr
- Down + closing
- —
- Monthly P&I
- —
- Monthly cashflow
- —
- DSCR
- —
- Eligible?
- —
No personal income docs; deal must DSCR.
Hard money
10% down · 12.0% · 12mo
- Down + closing
- —
- Monthly P&I
- —
- Monthly cashflow
- —
- DSCR
- —
- Eligible?
- —
Short-term bridge; refi at stabilization.
Listing history 28 events
-
2026-06-18days on market $94,500 Active 78 DOM
-
2026-06-17days on market $94,500 Active 77 DOM
-
2026-06-16days on market $94,500 Active 76 DOM
-
2026-06-15days on market $94,500 Active 75 DOM
-
2026-06-13days on market $94,500 Active 73 DOM
-
2026-06-12days on market $94,500 Active 72 DOM
-
2026-06-09days on market $94,500 Active 69 DOM
-
2026-06-08days on market $94,500 Active 68 DOM
-
2026-06-07days on market $94,500 Active 67 DOM
-
2026-06-05days on market $94,500 Active 65 DOM
-
2026-06-04days on market $94,500 Active 63 DOM
-
2026-06-02days on market $94,500 Active 62 DOM
-
2026-06-01days on market $94,500 Active 61 DOM
-
2026-05-31days on market $94,500 Active 60 DOM
-
2026-05-31days on market $94,500 Active 59 DOM
-
2026-05-19price $94,500 378-char remark
Show marketing remark (378 chars)
Very nice two bedroom home with some updates the home has hardwood floors, original woodwork thru out, there is a two car plus garage with heat and added shop on the side also there is a new 12x20 Yoder shed beside the garage, all appliances are 2024 plus new water heater and has large double lot on the corner. The property is set up with invisible pet fence and it will stay.
-
2026-04-01$104,500 Active 378-char remark
Show marketing remark (378 chars)
Very nice two bedroom home with some updates the home has hardwood floors, original woodwork thru out, there is a two car plus garage with heat and added shop on the side also there is a new 12x20 Yoder shed beside the garage, all appliances are 2024 plus new water heater and has large double lot on the corner. The property is set up with invisible pet fence and it will stay.
-
2023-12-11soldstatus $48,000
-
2012-01-17soldstatus $22,500 276-char remark
Show marketing remark (276 chars)
Sold As Is condition. First look for home owners through 09/03/2011. Investors welcome after. Sellers addendum, proof of Funds, and $1000 EM minimum for all offers. No closets in both bedrooms. Extra Large Insulated garage with attached bonus room/ workshop. L-shaped kitchen.
-
2011-12-23soldstatus $22,500
-
2011-12-14historical 276-char remark
Show marketing remark (276 chars)
Sold As Is condition. First look for home owners through 09/03/2011. Investors welcome after. Sellers addendum, proof of Funds, and $1000 EM minimum for all offers. No closets in both bedrooms. Extra Large Insulated garage with attached bonus room/ workshop. L-shaped kitchen.
-
2011-08-16$29,900 276-char remark
Show marketing remark (276 chars)
Sold As Is condition. First look for home owners through 09/03/2011. Investors welcome after. Sellers addendum, proof of Funds, and $1000 EM minimum for all offers. No closets in both bedrooms. Extra Large Insulated garage with attached bonus room/ workshop. L-shaped kitchen.
-
2011-03-02soldstatus $24,472
-
2007-11-07soldstatus $73,000
-
2007-11-01soldstatus $73,000
-
2007-09-21historical
-
2007-09-17$79,900
-
2002-06-01soldstatus $35,000
ⓘ Source: listings_history table (triggers on properties + properties_extension) + one-shot
backfill from property_details.listing_events for pre-trigger history.
Tax reassessment forecast IL · Partial reset (capped growth)
- Current annual tax
- $1,019 · $85/mo
- Projected year-2 tax
- $1,582 · $132/mo
- Expected delta
- +$563/yr (+$47/mo · 55.2%)
ⓘ Screening estimate from a state-policy table — verify with the county assessor before closing.
Climate risk First Street
- Flood 1/10 Low FEMA zone X (unshaded) · 0% chance over 30 yrs
- Wildfire 1/10 Low
- Heat 3/10 Moderate 7 d/yr ≥104°F today · 17 d/yr by 30 yrs out
- Wind 2/10 Low 100% chance of damaging wind over 30 yrs
- Air quality 2/10 Low 1 unhealthy d/yr today · 1 by 30 yrs out
Nearby sold comps map
Loading sold comps map…
Walkable amenities ~0.75 mi
Loading nearby amenities…
Taxation est. · year 1
- Rental income
- $10,565
- − Mortgage interest
- −$5,293
- − Property taxes
- −$1,019
- − Insurance
- −$472
- − Repairs & maintenance
- −$845
- − Management
- −$845
- − Depreciation
- −$2,749
- Taxable loss
- −$660
- Est. tax savings @ 24.0%
- +$158
- After-tax cash flow
- $1,066/yr
For passive investors: Depreciation is non-cash, so a rental often shows a tax loss while cash-flowing — sheltering income. Rental losses are passive: they offset passive income freely, and up to $25,000/yr can offset ordinary (W-2) income if you actively participate and your MAGI is under $100k (phasing out to $0 by $150k); unused losses carry forward. On sale, claimed depreciation is recaptured at up to 25%, and gains may owe capital-gains tax (a 1031 exchange can defer both). Figures are a year-1 estimate at your 24.0% rate — not tax advice; consult a CPA.
Schools (NCES district)
- District
- Crescent Iroquois CUSD 249
- NCES district ID
- 1700323
- Math proficiency
- 30% ▲ 10.00%
- Reading proficiency
- 50% ▲ 10.00%
- Median HH income
- $54,136
- Composite
- 37.28/100
- National rank
- #8963
- State rank
- #305 of 919 in IL
Livability — Crescent City
- Score
- 62/100
- State rank
- #822
- US rank
- #16204
Category grades
Schools grade is shown separately in the Schools card above.
Census & demographics
- Census place
- Crescent City, IL
- Population (ZIP)
- 509
Population outlook (Iroquois County) Hauer SSP2
- Today (2025)
- 26,826 people
- By 2030
- 25,771 · -3.9%
- By 2040
- 23,589 · -12.1%
- By 2050
- 21,523 · -19.8%
- By 2075
- 17,998 · -32.9%
- By 2100
- 14,979 · -44.2%
Race, ethnicity, and origin ACS 2023
- Neighborhood character
- Predominantly White (91%)
- Race & ethnicity
- White 91% Hispanic / Latino 8% Two or more races 2%
- Hispanic origin (detail)
- Mexican 8%
- Common ancestry
- Lithuanian 6% Romanian 3% Iranian 2%
- Foreign-born
- 0%
Political lean MEDSL · Iroquois
- 2024 margin
- Solid R (+57.3) · D 20.6% · R 78.0% · Other 1.4%
- 2008→2024 swing
- -27.5pp toward R · 2008: -29.8pp · 2024: -57.3pp
- All cycles
- 2024: R+57.3 2020: R+56.7 2016: R+56.0 2012: R+44.7 2008: R+29.8
Not yet ingested
- Civics
- —
Market trends
- HPI YoY
- ▲ 1.89%
- Current HPI
- 128.1668
- Rent YoY
- —
- Metro
- —
- State GDP YoY
- ▲ 1.59%
- F500 in state
- 60
Industry mix (Fortune 500 HQ in IL)
| Industry | F500 HQs | Revenue |
|---|---|---|
| Insurance | 4 | $201B |
|
||
| Consumer Goods | 4 | $87B |
|
||
| Industrial Machinery | 3 | $64B |
|
||
| Healthcare | 2 | $55B |
|
||
| Retail / Pharmacy | 1 | $148B |
|
||
| Agriculture / Food | 1 | $86B |
|
||
Price history
+170.0% since first listed13 events — show timeline
- 2026-05-19 Price Changed $94,500 MRED as Distributed by MLS Grid
- 2026-04-01 Listed $104,500 MRED as Distributed by MLS Grid
- 2023-12-11 Sold (Public Records) $48,000 Public Records
- 2012-01-17 Sold (MLS) $22,500 MRED as Distributed by MLS Grid
- 2011-12-23 Sold (Public Records) $22,500 Public Records
- 2011-12-14 Listing Removed — MRED as Distributed by MLS Grid
- 2011-08-16 Listed $29,900 MRED as Distributed by MLS Grid
- 2011-03-02 Sold (Public Records) $24,472 Public Records
- 2007-11-07 Sold (MLS) $73,000 MRED as Distributed by MLS Grid
- 2007-11-01 Sold (Public Records) $73,000 Public Records
- 2007-09-21 Listing Removed — MRED as Distributed by MLS Grid
- 2007-09-17 Listed $79,900 MRED as Distributed by MLS Grid
- 2002-06-01 Sold (Public Records) $35,000 Public Records
Property tax history
-3.8%/yrLatest (2024): $1,019 · -27.4% YoY. Source: county tax records.
Cash-flow waterfall
monthlySold comps — $/sqft
last 12 mo · ≤1 miLoading sold comps…