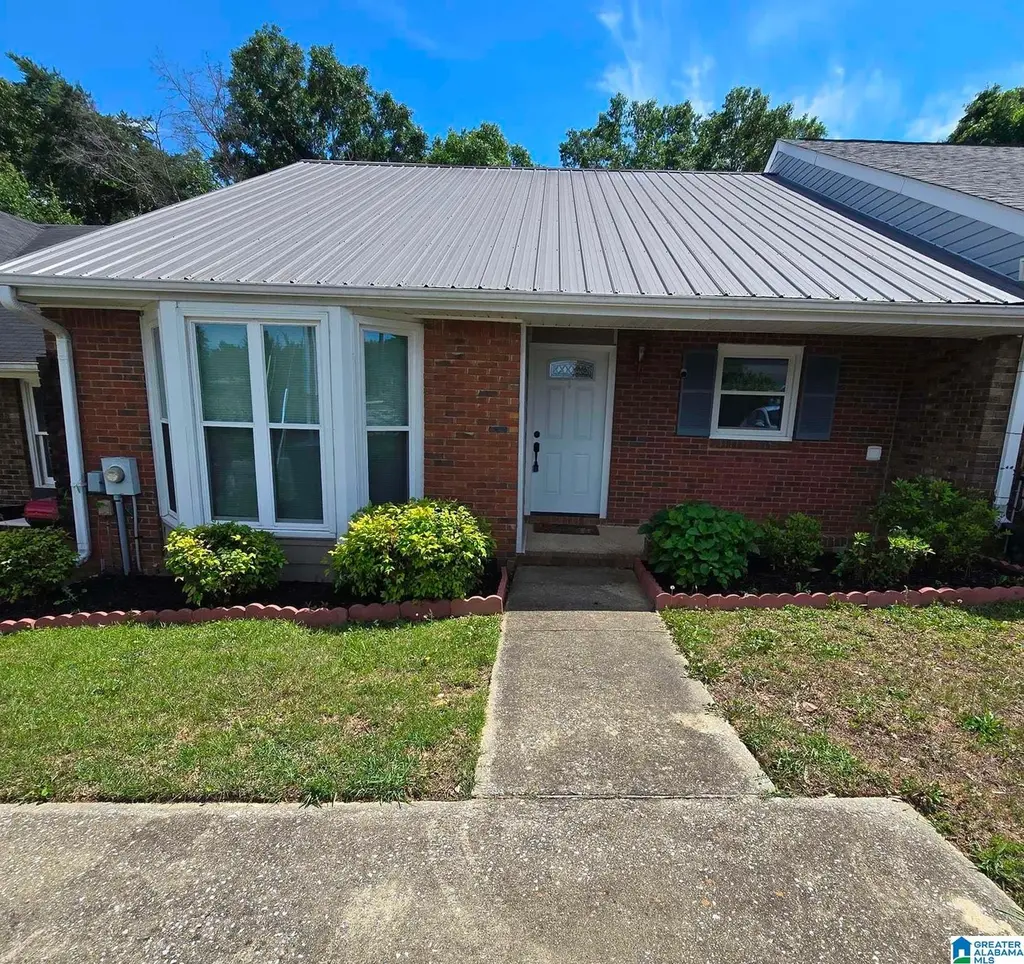
1121 King Arthur Ct · Alabaster, AL
Flood risk 1/10 · Minimal
- FEMA flood zone
- X (unshaded)
- Chance of flooding over 30 yrs
- 0.0%
- Est. flood insurance / yr
- $507 – $1,088
Fire risk 1/10 · Minimal
- Est. fire insurance / yr
- $916 – $1,700
Heat risk 7/10 · Major
- Hot days now (above 106°F)
- 7 days/yr
- Hot days in 30 yrs
- 20 days/yr
Wind risk 6/10 · Moderate
- Chance of severe wind over 30 yrs
- 46.0%
Air-quality risk 3/10 · Minor
- Unhealthy air days now
- 4 days/yr
- Unhealthy air days in 30 yrs
- 4 days/yr
Risk factors via First Street. Map © Google.
Why this score? — see what drove the D+ grade
The composite is a weighted blend of 9 inputs, each scored 0–100. Each bar is that input's sub-score; the figure is the points it added to the 100-point composite (weight × sub-score).
- Cash flow +17.4/30.0
- ARV discount +10.3/15.0
- DSCR +5.4/10.0
- Schools +3.9/10.0
- Livability +3.8/5.0
- 1% rule +3.5/10.0
- Rent growth +3.0/5.0
- Condition / age +2.5/5.0
- Appreciation +0.0/10.0
$189,900
🖨 Deal sheet 📄 Offer letter ✓ Due diligence
Listing remarks
Welcome home to this beautifully maintained 2 bedroom, 2 bath townhome offering comfort, space, and cozy charm in all the right places. The open layout flows into a functional kitchen complete with a convenient breakfast bar, ideal for casual dining, entertaining, or morning coffee. The spacious master suite is designed for comfort with a large walk in closet, a private bath with double sinks and plenty of room to unwind. Enjoy the outdoors from the peaceful screened in deck overlooking a fully fenced backyard perfect for pets, kids, gardening, or simply enjoying extra privacy. Need additional storage? This home includes a storage shed for all your tools and extras.
Key facts
- Storage shed
- Screened in deck
- Breakfast bar
Tags
Property features AI
Finance
- HOA & community: No association fee
Exterior
- Parking: Driveway parking
- Utilities: Public water; Connected sewer; Gas water heater; Underground utilities; Internet service available
- Home design: Existing home; Crawl space foundation; Brick over foundation with vinyl siding
- Construction: Brick over foundation; Vinyl siding; Crawl space foundation
- Exterior features: Fenced yard; Storage building; Garden/yard; Screened deck
Interior
- Kitchen: Laminate countertops; Electric cooktop; Built-in dishwasher; Built-in microwave; Refrigerator
- Bedrooms: Master bedroom on main level; Additional bedroom on main level; Walk-in closets
- Flooring: Hardwood laminate floors
- Bathrooms: Two full bathrooms; Master bath on main level; Tub/shower combo
- Heating & cooling: Central heating; Central cooling
- Interior features: Smooth ceilings; Bay window; Brick fireplace in living room (gas)
- Laundry & utility: Washer hookup; Electric dryer hookup; Laundry closet on main level; Attic with pull-down access
Neighborhood map
What this means for you Summary
Snapshot
- This is a 2-bed/2.0-bath townhouse listed at $190k.
Deal economics
- At list price, monthly cash flow is $141 ($2k/yr) — positive.
- The deal already cash-flows at list — no discount required.
- To meet the 1% rule (rent ≥ 1% of price), the offer needs to be $161k (15.1% below list).
- Recommended offer: $161k (15.1% below list) — sets the bar for 1% rule.
- Cap rate 7.2% vs local median 4.1% in Alabaster — top-decile yield for the area; either an underpriced asset or a hidden risk that comps aren't pricing in. Stress-test before assuming the spread holds.
Location & tenants
- Location reads 76/100 on livability (#14 in AL, #3,512 nationally) — a middle-class / working-renter tenant base. Strengths: employment A+, cost of living A+, housing A+; Watch: amenities D-, commute F, health & safety F.
- Alabaster City (suburban): math 30% / reading 57% proficiency, ranked #17 of 129 in AL (top 13%) — families likely to look elsewhere, expect single-tenant / working-renter base with shorter leases.
- Zoned schools: Creek View Elementary School (math 56% / reading 71%, grade B, #46 of 627 statewide, top 8%, 946 students, 48% FRL); Thompson High School (math 34% / reading 38%, grade F, #43 of 305 statewide, top 14%, 2,203 students, 48% FRL) — zoned schools average 48% FRL vs 31% district-wide (17 pts higher); higher-poverty schools than district average — tighter screening recommended.
- Market conditions: Rents rising (+2.2%/yr); 226 active listings in the ZIP; 16 comparable units currently listed for rent nearby; rentals leasing fast (median 10d on market — plan ~1-2 weeks tenant-placement turnaround); solid renter incomes; 987 units permitted in Shelby County in 2024 (0 in 5+ unit buildings).
Forward outlook
- Local home prices are declining (-3.0%/yr); year-one equity from $1k of loan paydown is wiped out by about $6k of value loss. Plan a longer hold.
- Shelby County population projected at +23% by 2050 — long-run rental-demand tailwind backs the buy-and-hold thesis.
Negotiation context
- It's been on market 45 days — a 3% lower offer ($184k) is reasonable based on typical stale-listing flexibility.
Risks & watch-outs
- Climate carrying-cost: major wind risk, 46% chance of damaging wind over 30y; extreme-heat days projected 7→20/yr by 2055 (HVAC capex compounding) — expect insurance premiums to compound above CPI over the hold.
Questions for the listing agent
- It's been on market 45 days. Have you received any prior offers? Is the seller open to a 15% concession, seller financing, or rate buy-down credit?
- Is there a deadline driving the sale (1031 exchange, divorce, estate, relocation)? That informs how much negotiation room exists.
- Schools are B-rated — typically a magnet for longer-tenancy family renters. What's the average tenant stay here, and is there a school-zone premium baked into asking?
- The area grade is low — what's the realistic commute time and amenity access for the typical tenant pool here? Any planned neighborhood developments (good or bad) we should know about?
- What's the average days-on-market for RENTAL listings here right now (not sales)? A rising rental-DOM trend means longer vacancies and softer asking-rent achievability than the comps imply.
- What's the recent tenant-quality profile in this submarket — average credit score on applications, eviction rate, late-payment / NSF rate, and stable-employment percentage? A property-management company in the area should have these aggregated.
- How much new for-sale + rental construction is in the pipeline within 1–3 miles? Heavy new supply typically softens prices + rents 12–24 months out; constrained supply supports both.
Investment metrics
- 1% rule
- 0.85% ✗
- Cap rate
- 7.18%
- Cash-on-cash
- 3.18%
- DSCR
- 1.14
- GRM
- 9.8
CMA / ARV
- ARV (median comp)
- $202,379
- List price
- $189,900
- Delta
- -6.17%
- Verdict
- FAIR
- Comps
- 20 within 1.0 mi
Show comp detail 10 sales within ~0.75 mi
| Address | Dist | Beds/Ba | Sqft | Sold | Price | $/sf | Match |
|---|---|---|---|---|---|---|---|
| 1131 King Arthur Ct | 0.03mi | 2/3.0 | 1,234 (-1%) | 13mo | $169,900 | $138 | 83 |
| 117 Sugar Hill Ln | 0.14mi | 2/2.0 | 1,284 (+4%) | 13mo | $200,000 | $156 | 77 |
| 171 Sugar Hill Ln | 0.19mi | 2/2.0 | 1,222 (-2%) | 15mo | $200,000 | $164 | 76 |
| 136 Sugar Hill Ln | 0.18mi | 2/2.0 | 1,284 (+4%) | 16mo | $199,900 | $156 | 73 |
| 140 Sugar Hill Ln | 0.18mi | 2/2.0 | 1,147 (-8%) | 8mo | $180,000 | $157 | 72 |
| 1632 King James Dr | 0.21mi | 3/2.0 (+1) | 1,330 (+7%) | 2mo | $215,000 | $162 | 72 |
| 205 Willow Point Cir | 0.29mi | 2/2.5 | 1,344 (+8%) | 4mo | $160,000 | $119 | 68 |
| 133 Sugar Hill Ln | 0.15mi | 2/2.0 | 1,147 (-8%) | 21mo | $192,500 | $168 | 63 |
| 1605 King James Dr | 0.17mi | 2/1.5 | 1,390 (+12%) | 10mo | $190,000 | $137 | 62 |
| 116 Sugar Hill Ln | 0.16mi | 2/2.0 | 1,147 (-8%) | 21mo | $185,000 | $161 | 62 |
Match score weights: distance 35% · size 25% · config 20% · recency 20%. Top-matched comps best support the ARV.
Projected returns pro-forma
-3.0% appreciation · 2.16% rent growth · sell at horizon
- IRR
- -12.2%
- Equity multiple
- 0.56×
- Total profit
- $-23,230
- Equity at exit
- $28,315
- IRR
- -4.3%
- Equity multiple
- 0.73×
- Total profit
- $-14,467
- Equity at exit
- $16,419
Cash invested: $53,172 (down + closing). Projections, not guarantees.
Landlord ↔ Tenant lean methodology
- Overall (STATE)
- 90 Strongly Landlord-Friendly
- State Alabama
- 90 Strongly Landlord-Friendly · R+15
- County
- — inherits STATE
- City
- — inherits STATE
ZIP-level market 35007
- Home prices YoY
- -35.0%
- Rents YoY
- 2.2%
- Active inventory
- 226
- Price-to-rent
- 9.8×
Monthly cashflow live
- Estimated rent
- $1,612 high interval (Pro) →
- Mortgage (P&I)
- −$996
- Tax from tax record
- −$57 /mo · $689/yr
- Insurance
- −$79
- HOA
- −$0
- Vacancy / Maint / Mgmt
- −$338
- Net cashflow
- $141
Break-even live
UW: 25.0% down · 7.5% · 30yr · 1.5% tax · 5.0% vac · 8.0% maint · 8.0% mgmt
Financing live
Cash to close
- Down payment
- $47,475
- Closing costs
- $5,697
- Reserves months
- —
- Total cash needed
- —
Loan-product check · same deal, 3 products live
Conventional
25% down · 7.5% · 30yr
- Down + closing
- —
- Monthly P&I
- —
- Monthly cashflow
- —
- DSCR
- —
- Eligible?
- —
Personal DTI + credit; lowest rate.
DSCR
20% down · 8.5% · 30yr
- Down + closing
- —
- Monthly P&I
- —
- Monthly cashflow
- —
- DSCR
- —
- Eligible?
- —
No personal income docs; deal must DSCR.
Hard money
10% down · 12.0% · 12mo
- Down + closing
- —
- Monthly P&I
- —
- Monthly cashflow
- —
- DSCR
- —
- Eligible?
- —
Short-term bridge; refi at stabilization.
Rent comps 16 comps
| Address | Beds | Baths | Sqft | Rent | $/sqft | DOM | Units | Dist |
|---|---|---|---|---|---|---|---|---|
| 108 Sugar Hill Ln Alabaster, AL | 2.0 | 2.0 | 1147 | $1,588 | $1.38 | 14d | 1 | 0.14mi |
| 1588 King James Dr Alabaster, AL | 2.0 | 1.5 | 1261 | $1,573 | $1.25 | 10d | 1 | 0.18mi |
| 1592 King James Dr Alabaster, AL | 2.0 | 1.5 | 1232 | $1,573 | $1.28 | 1d | 1 | 0.18mi |
| 2005 King Arthur Cir Alabaster, AL | 3.0 | 2.0 | 1308 | $1,600 | $1.22 | 10d | 1 | 0.28mi |
| 200 Willow Point Cir Alabaster, AL | 2.0 | 2.0 | 1147 | $1,450 | $1.26 | 10d | 1 | 0.30mi |
| 108 Willow Point Ln Alabaster, AL | 3.0 | 2.0 | 1420 | $1,575 | $1.11 | 43d | 1 | 0.31mi |
| 513 Walker Rd Pelham, AL | 3.0 | 2.0 | 1278 | $1,790 | $1.40 | 10d | 1 | 0.81mi |
| 102 Frances Ln Helena, AL | 2.0 | 2.0 | 1400 | $1,600 | $1.14 | 1d | 1 | 0.82mi |
| 1500 Windsor Ct Alabaster, AL | 1.0–2.0 | 1.0–2.0 | 1058 | $1,351 | $1.28 | 1d | 10 | 1.28mi |
| 403 3rd St NE Unit 508 Alabaster, AL | 3.0 | 2.0 | 900 | $1,350 | $1.50 | 43d | 1 | 1.29mi |
| 403 3rd St NE Unit 422 Alabaster, AL | 2.0 | 1.0 | 845 | $1,250 | $1.48 | 43d | 1 | 1.29mi |
| 955 3rd Ave NW Alabaster, AL | 3.0 | 2.0 | 1363 | $1,875 | $1.38 | 3d | 1 | 1.30mi |
| 177 Cedar Bend Dr Helena, AL | 3.0 | 2.5 | 1500 | $1,750 | $1.17 | 1d | 1 | 1.31mi |
| 2812 Saint Patrick Pl N Helena, AL | 3.0 | 2.0 | 1326 | $1,790 | $1.35 | 14d | 1 | 1.37mi |
| 3511 Highway 52 W Unit A Pelham, AL | 2.0 | 1.0 | 1000 | $825 | $0.82 | 2d | 1 | 1.45mi |
| 102 Rockbrook Ln Pelham, AL | 3.0 | 2.0 | 1277 | $1,751 | $1.37 | 15d | 1 | 1.45mi |
Listing history 14 events
-
2026-06-18days on market $189,900 Active 45 DOM
-
2026-06-17days on market $189,900 Active 44 DOM
-
2026-06-16days on market $189,900 Active 43 DOM
-
2026-06-15days on market $189,900 Active 42 DOM
-
2026-06-13pricedays on market $189,900 Active 40 DOM
-
2026-06-10days on market $199,900 Active 37 DOM
-
2026-06-09days on market $199,900 Active 36 DOM
-
2026-06-08days on market $199,900 Active 35 DOM
-
2026-06-07days on market $199,900 Active 34 DOM
-
2026-06-03days on market $199,900 Active 30 DOM
-
2026-06-02days on market $199,900 Active 29 DOM
-
2026-06-01days on market $199,900 Active 28 DOM
-
2026-05-31days on market $199,900 Active 27 DOM
-
2026-05-05$199,900 Active 674-char remark
ⓘ Source: listings_history table (triggers on properties + properties_extension) + one-shot
backfill from property_details.listing_events for pre-trigger history.
Tax reassessment forecast AL · Resets to sale price
- Current annual tax
- $689 · $57/mo
- Projected year-2 tax
- $779 · $65/mo
- Expected delta
- +$90/yr (+$7/mo · 13.0%)
ⓘ Screening estimate from a state-policy table — verify with the county assessor before closing.
Climate risk First Street
- Flood 1/10 Low FEMA zone X (unshaded) · 0% chance over 30 yrs
- Wildfire 1/10 Low
- Heat 7/10 Severe 7 d/yr ≥106°F today · 20 d/yr by 30 yrs out
- Wind 6/10 Major 46% chance of damaging wind over 30 yrs
- Air quality 3/10 Moderate 4 unhealthy d/yr today · 4 by 30 yrs out
Nearby sold comps map
Loading sold comps map…
Walkable amenities ~0.75 mi
Loading nearby amenities…
Taxation est. · year 1
- Rental income
- $19,343
- − Mortgage interest
- −$10,637
- − Property taxes
- −$689
- − Insurance
- −$950
- − Repairs & maintenance
- −$1,547
- − Management
- −$1,547
- − Depreciation
- −$5,524
- Taxable loss
- −$1,552
- Est. tax savings @ 24.0%
- +$373
- After-tax cash flow
- $2,064/yr
For passive investors: Depreciation is non-cash, so a rental often shows a tax loss while cash-flowing — sheltering income. Rental losses are passive: they offset passive income freely, and up to $25,000/yr can offset ordinary (W-2) income if you actively participate and your MAGI is under $100k (phasing out to $0 by $150k); unused losses carry forward. On sale, claimed depreciation is recaptured at up to 25%, and gains may owe capital-gains tax (a 1031 exchange can defer both). Figures are a year-1 estimate at your 24.0% rate — not tax advice; consult a CPA.
Schools (NCES district)
- District
- Alabaster City
- NCES district ID
- 0100190
- Math proficiency
- 30% ▼ -27.00%
- Reading proficiency
- 57% ▲ 5.00%
- Median HH income
- $68,690
- Composite
- 39.07/100
- National rank
- #4052
- State rank
- #17 of 129 in AL
Livability — Alabaster
- Score
- 76/100
- State rank
- #14
- US rank
- #3512
Category grades
Schools grade is shown separately in the Schools card above.
Census & demographics
- Census place
- Alabaster, AL
- County
- Shelby County · 188,970 people
- City population
- 28,586
- Metro
- Birmingham-Hoover, AL
- Population (ZIP)
- 28,586
- Household income
- $88,505
- Rent vs Own
- Severe rent burden
- 325.0
Population outlook (Shelby County) Hauer SSP2
- Today (2025)
- 237,024 people
- By 2030
- 249,868 · +5.4%
- By 2040
- 272,778 · +15.1%
- By 2050
- 291,062 · +22.8%
- By 2075
- 326,049 · +37.6%
- By 2100
- 335,870 · +41.7%
Race, ethnicity, and origin ACS 2023
- Neighborhood character
- Predominantly White (69%)
- Race & ethnicity
- White 69% Black 14% Hispanic / Latino 13% Two or more races 6% Asian 2%
- Hispanic origin (detail)
- Mexican 6% Cuban 1%
- Common ancestry
- Italian 3% Serbian 2% Lithuanian 1%
- Foreign-born
- 6% · Canada, China
- Languages at home
- 90% English-only · Spanish 8% Chinese 1%
Political lean MEDSL · Shelby
- 2024 margin
- Solid R (+40.9) · D 29.0% · R 69.9% · Other 1.1%
- 2008→2024 swing
- +12.6pp toward D · 2008: -53.4pp · 2024: -40.9pp
- All cycles
- 2024: R+40.9 2020: R+40.4 2016: R+50.3 2012: R+55.6 2008: R+53.4
Not yet ingested
- Civics
- —
Market trends
- HPI YoY
- ▼ -113.63%
- Current HPI
- 211.0691
- Rent YoY
- ▲ 2.16%
- Metro
- Birmingham-Hoover, AL
- State GDP YoY
- ▲ 2.94%
- F500 in state
- 4
Industry mix (Fortune 500 HQ in AL)
| Industry | F500 HQs | Revenue |
|---|---|---|
| Financial Services | 1 | $8B |
|
||
| Healthcare | 1 | $5B |
|
||
Price history
-5.0% since first listed2 events — show timeline
- 2026-06-13 Price Changed $189,900 Greater Alabama MLS
- 2026-05-05 Listed $199,900 Greater Alabama MLS
Property tax history
+5.9%/yrLatest (2025): $689 · +2.1% YoY. Source: county tax records.
Cash-flow waterfall
monthlySold comps — $/sqft
last 12 mo · ≤1 miLoading sold comps…