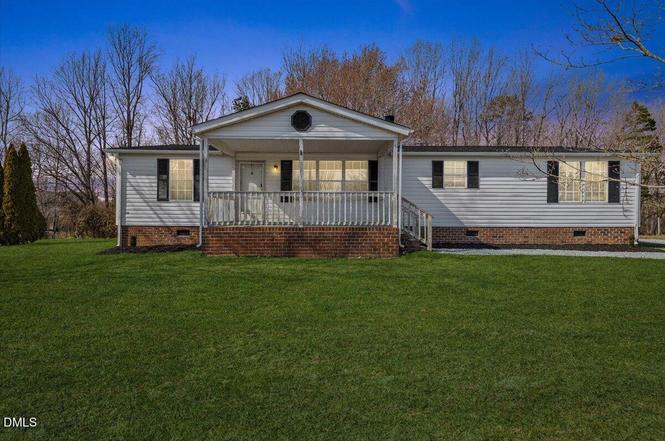
333 Hunters Edge Dr · Roxboro, NC
Flood risk 1/10 · Minimal
- FEMA flood zone
- X (unshaded)
- Chance of flooding over 30 yrs
- 0.0%
- Est. flood insurance / yr
- $473 – $860
Fire risk 4/10 · Minor
- Est. fire insurance / yr
- $906 – $1,684
Heat risk 6/10 · Moderate
- Hot days now (above 103°F)
- 7 days/yr
- Hot days in 30 yrs
- 17 days/yr
Wind risk 6/10 · Moderate
- Chance of severe wind over 30 yrs
- 27.0%
Air-quality risk 2/10 · Minimal
- Unhealthy air days now
- 1 days/yr
- Unhealthy air days in 30 yrs
- 1 days/yr
Risk factors via First Street. Map © Google.
Why this score? — see what drove the D- grade
The composite is a weighted blend of 9 inputs, each scored 0–100. Each bar is that input's sub-score; the figure is the points it added to the 100-point composite (weight × sub-score).
- Appreciation +9.3/10.0
- Cash flow +8.0/30.0
- ARV discount +7.5/15.0
- Schools +3.4/10.0
- Livability +2.8/5.0
- Rent growth +2.5/5.0
- Condition / age +2.5/5.0
- DSCR +2.1/10.0
- 1% rule +1.3/10.0
$240,000
🖨 Deal sheet 📄 Offer letter ✓ Due diligence
Listing remarks
Feeling a bit cramped in the city? Longing for some space to spread out a bit? No sense in feeling surly in the city when 333 Hunters Edge Dr offer lots of space outside the city. 1.44 Acres of land, 16 minutes from downtown Roxboro! This home is move in ready! Offer with confidence! Price to sell it won't last LONG!!
Key facts
- 1.44 acres of land
- 1.44 acre lot
- Built 1999
Tags
Property features AI
Finance
- Other: Lot size approximately 1.44 acres
- HOA & community: No homeowners association
Exterior
- Utilities: Well water; Septic tank
- Home design: Manufactured double-wide home; One story
- Construction: Vinyl siding; Brick/mortar foundation; Shingle roof; Built as a manufactured house (double wide)
- Exterior features: Private maintained road
Interior
- Bedrooms: 3 bedrooms total; 1 bedroom on the main level
- Flooring: Luxury vinyl
- Bathrooms: 2 full bathrooms
- Heating & cooling: Central heating; Central air conditioning
- Interior features: Luxury vinyl flooring; Crawl space basement
Neighborhood map
What this means for you Summary
Snapshot
- This is a 3-bed/2.0-bath manufactured listed at $240k.
Deal economics
- At list price, monthly cash flow is $-245 ($-3k/yr) — negative.
- To cash-flow at today's rent, offer at most $197k (18.0% below list).
- To meet the 1% rule (rent ≥ 1% of price), the offer needs to be $151k (36.9% below list).
- Recommended offer: $151k (36.9% below list) — sets the bar for 1% rule.
Location & tenants
- Location reads 55/100 on livability (#649 in NC) — a working-class tenant base; expect higher turnover. Strengths: cost of living A+; Watch: crime F, amenities F, commute F.
- Person County Schools (rural): math 39% / reading 42% proficiency, ranked #110 of 178 in NC (top 62%) — families likely to look elsewhere, expect single-tenant / working-renter base with shorter leases.
- Zoned schools: Person High (math 45% / reading 44%, grade F, #352 of 535 statewide, top 68%, 1,079 students, 60% FRL).
- Market conditions: 38 active listings in the ZIP; 113 units permitted in Person County in 2024 (0 in 5+ unit buildings).
Forward outlook
- In year one you build about $22k of equity ($2k loan paydown + $21k appreciation (8.7% local appreciation)).
- Person County population projected at -15% by 2050 — secular population decline; favor cash flow + early exit over multi-decade hold.
- By year 2, paydown + projected appreciation supports a ~$36k cash-out refi (75% LTV) — recoverable capital for the next deal without selling this one.
Negotiation context
- It's been on market 56 days — a 3% lower offer ($233k) is reasonable based on typical stale-listing flexibility.
Risks & watch-outs
- Climate carrying-cost: major wind risk, 27% chance of damaging wind over 30y; extreme-heat days projected 7→17/yr by 2055 (HVAC capex compounding) — expect insurance premiums to compound above CPI over the hold.
Questions for the listing agent
- What do current leases actually rent for vs. the listed asking? Can we see a recent rent roll and the last 12 months of T-12 income?
- It's been on market 56 days. Have you received any prior offers? Is the seller open to a 37% concession, seller financing, or rate buy-down credit?
- Is there a deadline driving the sale (1031 exchange, divorce, estate, relocation)? That informs how much negotiation room exists.
- Schools are D-rated, which usually means shorter tenancies and higher turnover. Who's the typical renter profile here, and what's been the actual vacancy rate?
- Crime grade is F in this area — have there been break-ins, vandalism, or insurance claims at this property in the last 3 years? What carrier currently insures it and at what premium?
- The area grade is low — what's the realistic commute time and amenity access for the typical tenant pool here? Any planned neighborhood developments (good or bad) we should know about?
- What's the average days-on-market for RENTAL listings here right now (not sales)? A rising rental-DOM trend means longer vacancies and softer asking-rent achievability than the comps imply.
- What's the recent tenant-quality profile in this submarket — average credit score on applications, eviction rate, late-payment / NSF rate, and stable-employment percentage? A property-management company in the area should have these aggregated.
- How much new for-sale + rental construction is in the pipeline within 1–3 miles? Heavy new supply typically softens prices + rents 12–24 months out; constrained supply supports both.
Investment metrics
- 1% rule
- 0.63% ✗
- Cap rate
- 5.07%
- Cash-on-cash
- -4.37%
- DSCR
- 0.81
- GRM
- 13.2
CMA / ARV
No comps found within radius.
Projected returns pro-forma
8.65% appreciation · 3.0% rent growth · sell at horizon
- IRR
- 18.2%
- Equity multiple
- 2.39×
- Total profit
- $93,188
- Equity at exit
- $192,997
- IRR
- 17.0%
- Equity multiple
- 5.20×
- Total profit
- $282,547
- Equity at exit
- $393,741
Cash invested: $67,200 (down + closing). Projections, not guarantees.
Landlord ↔ Tenant lean methodology
- Overall (STATE)
- 85 Strongly Landlord-Friendly
- State North Carolina
- 85 Strongly Landlord-Friendly · R+3
- County
- — inherits STATE
- City
- — inherits STATE
ZIP-level market 27583
- Home prices YoY
- 3.0%
- Active inventory
- 38
- Price-to-rent
- 13.2×
Monthly cashflow live
- Estimated rent
- $1,514 medium interval (Pro) →
- Mortgage (P&I)
- −$1,259
- Tax from tax record
- −$82 /mo · $988/yr
- Insurance
- −$100
- HOA
- −$0
- Vacancy / Maint / Mgmt
- −$318
- Net cashflow
- $-245
Break-even live
UW: 25.0% down · 7.5% · 30yr · 1.5% tax · 5.0% vac · 8.0% maint · 8.0% mgmt
Financing live
Cash to close
- Down payment
- $60,000
- Closing costs
- $7,200
- Reserves months
- —
- Total cash needed
- —
Loan-product check · same deal, 3 products live
Conventional
25% down · 7.5% · 30yr
- Down + closing
- —
- Monthly P&I
- —
- Monthly cashflow
- —
- DSCR
- —
- Eligible?
- —
Personal DTI + credit; lowest rate.
DSCR
20% down · 8.5% · 30yr
- Down + closing
- —
- Monthly P&I
- —
- Monthly cashflow
- —
- DSCR
- —
- Eligible?
- —
No personal income docs; deal must DSCR.
Hard money
10% down · 12.0% · 12mo
- Down + closing
- —
- Monthly P&I
- —
- Monthly cashflow
- —
- DSCR
- —
- Eligible?
- —
Short-term bridge; refi at stabilization.
Listing history 2 events
-
2026-04-30status Pending
-
2026-03-03$240,000 Active
ⓘ Source: listings_history table (triggers on properties + properties_extension) + one-shot
backfill from property_details.listing_events for pre-trigger history.
Tax reassessment forecast NC · Resets to sale price
- Current annual tax
- $988 · $82/mo
- Projected year-2 tax
- $1,968 · $164/mo
- Expected delta
- +$980/yr (+$82/mo · 99.2%)
ⓘ Screening estimate from a state-policy table — verify with the county assessor before closing.
Climate risk First Street
- Flood 1/10 Low FEMA zone X (unshaded) · 0% chance over 30 yrs
- Wildfire 4/10 Moderate
- Heat 6/10 Major 7 d/yr ≥103°F today · 17 d/yr by 30 yrs out
- Wind 6/10 Major 27% chance of damaging wind over 30 yrs
- Air quality 2/10 Low 1 unhealthy d/yr today · 1 by 30 yrs out
Nearby sold comps map
Loading sold comps map…
Walkable amenities ~0.75 mi
Loading nearby amenities…
Taxation est. · year 1
- Rental income
- $18,169
- − Mortgage interest
- −$13,444
- − Property taxes
- −$988
- − Insurance
- −$1,200
- − Repairs & maintenance
- −$1,454
- − Management
- −$1,454
- − Depreciation
- −$6,982
- Taxable loss
- −$7,352
- Est. tax savings @ 24.0%
- +$1,764
- After-tax cash flow
- $-1,173/yr
For passive investors: Depreciation is non-cash, so a rental often shows a tax loss while cash-flowing — sheltering income. Rental losses are passive: they offset passive income freely, and up to $25,000/yr can offset ordinary (W-2) income if you actively participate and your MAGI is under $100k (phasing out to $0 by $150k); unused losses carry forward. On sale, claimed depreciation is recaptured at up to 25%, and gains may owe capital-gains tax (a 1031 exchange can defer both). Figures are a year-1 estimate at your 24.0% rate — not tax advice; consult a CPA.
Schools (NCES district)
- District
- Person County Schools
- NCES district ID
- 3703630
- Math proficiency
- 39% ▬ 0.00%
- Reading proficiency
- 42% ▲ 2.00%
- Median HH income
- $43,729
- Composite
- 34.3/100
- National rank
- #5242
- State rank
- #110 of 178 in NC
Livability — Roxboro
- Score
- 55/100
- State rank
- #649
- US rank
- #23536
Category grades
Schools grade is shown separately in the Schools card above.
Census & demographics
- City population
- 11,954
- Population (ZIP)
- 6,633
Population outlook (Person County) Hauer SSP2
- Today (2025)
- 38,577 people
- By 2030
- 37,847 · -1.9%
- By 2040
- 35,740 · -7.4%
- By 2050
- 32,683 · -15.3%
- By 2075
- 24,979 · -35.2%
- By 2100
- 15,779 · -59.1%
Race, ethnicity, and origin ACS 2023
- Neighborhood character
- Predominantly White (86%)
- Race & ethnicity
- White 86% Black 9% Two or more races 3% Hispanic / Latino 2%
- Common ancestry
- Lithuanian 4% Serbian 3% Iranian 2%
- Foreign-born
- 2% · Canada
- Languages at home
- 96% English-only · Spanish 2% Other Indo-European 1% French/Haitian/Cajun 1%
Political lean MEDSL · Person
- 2024 margin
- Strong R (+23.7) · D 37.7% · R 61.4%
- 2008→2024 swing
- -15.2pp toward R · 2008: -8.5pp · 2024: -23.7pp
- All cycles
- 2024: R+23.7 2020: R+21.6 2016: R+17.3 2012: R+11.0 2008: R+8.5
Not yet ingested
- Civics
- —
Market trends
- HPI YoY
- ▲ 8.65%
- Current HPI
- 301.7122
- Rent YoY
- —
- Metro
- —
- State GDP YoY
- ▲ 3.28%
- F500 in state
- 26
Industry mix (Fortune 500 HQ in NC)
| Industry | F500 HQs | Revenue |
|---|---|---|
| Financial Services | 2 | $213B |
|
||
| Retail | 2 | $95B |
|
||
| Industrial Conglomerate | 1 | $38B |
|
||
| Metals / Steel | 1 | $35B |
|
||
| Utilities | 1 | $30B |
|
||
| Industrial Machinery | 1 | $19B |
|
||
Price history
2 events — show timeline
- 2026-04-30 Pending — TMLS
- 2026-03-03 Listed $240,000 TMLS
Property tax history
+3.0%/yrLatest (2025): $988 · +33.8% YoY. Source: county tax records.
Cash-flow waterfall
monthlySold comps — $/sqft
last 12 mo · ≤1 miLoading sold comps…