 Duplex
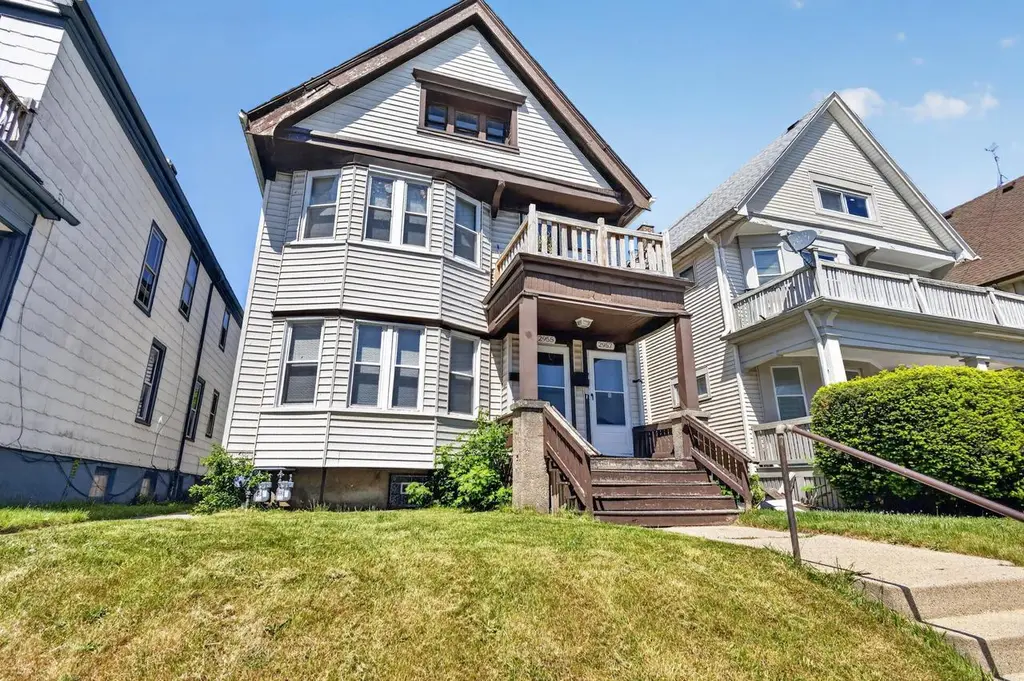
2955 N Holton St #2957 · Milwaukee, WI
Flood risk 1/10 · Minimal
- FEMA flood zone
- X (unshaded)
- Chance of flooding over 30 yrs
- 0.0%
- Est. flood insurance / yr
- $473 – $860
Fire risk 1/10 · Minimal
- Est. fire insurance / yr
- $636 – $1,182
Heat risk 2/10 · Minimal
- Hot days now (above 98°F)
- 7 days/yr
- Hot days in 30 yrs
- 13 days/yr
Wind risk 2/10 · Minimal
- Chance of severe wind over 30 yrs
- —
Air-quality risk 3/10 · Minor
- Unhealthy air days now
- 3 days/yr
- Unhealthy air days in 30 yrs
- 4 days/yr
Risk factors via First Street. Map © Google.
Why this score? — see what drove the B- grade
The composite is a weighted blend of 9 inputs, each scored 0–100. Each bar is that input's sub-score; the figure is the points it added to the 100-point composite (weight × sub-score).
- Cash flow +29.8/30.0
- DSCR +10.0/10.0
- 1% rule +8.4/10.0
- ARV discount +7.5/15.0
- Livability +4.0/5.0
- Rent growth +3.8/5.0
- Condition / age +2.5/5.0
- Schools +1.2/10.0
- Appreciation +0.0/10.0
$174,900
🖨 Deal sheet 📄 Offer letter ✓ Due diligence
Multi-family units
County records classify this as Multi-Family (2-4 Unit). Listing-text estimate: 2 units. confirmed
Listing remarks MLS
GREAT RIVER WEST INVESTMENT PROPERTY. Hard wood floors. Natural wood work. Tiled updated bath. Updated Kitchen with Pantry. Separate laundry areas and extra storage in basement Easy to generate positive cash flow. Fully occupied. $1290.00 per month. Mother and Daughter tenants. Lower 7th year Upper new. Present leases MTM with 60 days notice and upper till 12-1-2017. Tenants pay utilities. Updated electrical services. Vinyl siding. Two plus concrete parking spaces in back of property. Good location near public transportation, shopping, churches, schools and parks.
Key facts
- Accessible location
- Multi-family duplex
- Full block basement
Tags
Property features AI
Exterior
- Parking: Outdoor parking and other outside parking spaces; Some inside parking available
- Utilities: Municipal water; Municipal sewer
- Home design: Multi-family duplex; 1–2 stories
- Construction: Assessor/public record used for year built
- Exterior features: Vinyl exterior; Lot under 1/2 acre (approximately 0.12 acre); Zoned RT4 Residential
Interior
- Bedrooms: Duplex property with 2 units
- Heating & cooling: Forced air heating; Natural gas heat
- Interior features: Full block basement
Neighborhood map
What this means for you Summary
Snapshot
- This is a 2 × 2-bed/1.0-bath units multifamily listed at $175k.
Deal economics
- At list price, monthly cash flow is $641 ($8k/yr) — positive. Per door: $320/mo.
- The deal already cash-flows at list — no discount required.
- Meets the 1% rule at list price ($2k rent vs $175k).
- Cap rate 10.7% vs local median 5.1% in Milwaukee — top-decile yield for the area; either an underpriced asset or a hidden risk that comps aren't pricing in. Stress-test before assuming the spread holds.
Location & tenants
- Location reads 81/100 on livability (#55 in WI, #1,534 nationally) — a professional / high-income tenant draw. Strengths: amenities A+, commute A+, cost of living A+; Watch: employment D+, crime F.
- Milwaukee School District (urban): math 10% / reading 18% proficiency, ranked #337 of 342 in WI (top 98%) — low school quality limits family demand, transient renter base, plan for 1-2y turnover; 77% free/reduced lunch — lower-income household profile, screen leases tightly.
- Zoned schools: Riverside High (math 8% / reading 22%, grade F, #423 of 483 statewide, top 88%, 1,229 students, 78% FRL) — zoned schools at 78% FRL track the district average.
- Market conditions: Rents rising fast (+5.0%/yr); 129 active listings in the ZIP; 40 comparable units currently listed for rent nearby; rentals lingering (median 44d on market — plan ~5-8 weeks vacancy on turnover, expect pricing pressure); 50% of comp listings sitting > 30 days — soft ceiling on asking rent; 1,017 units permitted in Milwaukee County in 2024 (803 in 5+ unit buildings).
- At $2,341/mo this rent would consume 59% of the median local household income ($47k/yr) (locally 2397% of renters already pay >50% of income on rent) — very limited rent-growth headroom before tenants either downsize or default.
Forward outlook
- Local home prices are declining (-3.0%/yr); year-one equity from $1k of loan paydown is wiped out by about $5k of value loss. Plan a longer hold.
- Milwaukee County population projected at +4% by 2050 — modest demand growth; plan on rents tracking national, not racing it.
- At projected returns (-3.0% appreciation + 5.0% rent growth), your $49k cash investment doubles in ~7 years — after that, you're playing with house money.
Negotiation context
- Only 10 days on market — expect competitive offers; lowballing is unlikely to land.
- 2 sale attempts since 10y ago with the ask held roughly flat each time — persistent listings suggest the price (not the market) is what's stuck; bring a comps-based counter.
Risks & watch-outs
- Watch-outs: built in 1915 — expect roof / HVAC / electrical / plumbing capex.
Questions for the listing agent
- Can we see the unit-by-unit rent roll, current vacancy, and any below-market leases? What's the average tenancy length?
- What capital expenditures (roof, boiler, parking lot, exteriors) have been made in the last 5 years, and what's planned in the next 2?
- Built in 1915 — when were the roof, HVAC, electrical panel, plumbing, and water heater last replaced?
- Is there a deadline driving the sale (1031 exchange, divorce, estate, relocation)? That informs how much negotiation room exists.
- Schools are F-rated, which usually means shorter tenancies and higher turnover. Who's the typical renter profile here, and what's been the actual vacancy rate?
- Crime grade is F in this area — have there been break-ins, vandalism, or insurance claims at this property in the last 3 years? What carrier currently insures it and at what premium?
- What's the average days-on-market for RENTAL listings here right now (not sales)? A rising rental-DOM trend means longer vacancies and softer asking-rent achievability than the comps imply.
- What's the recent tenant-quality profile in this submarket — average credit score on applications, eviction rate, late-payment / NSF rate, and stable-employment percentage? A property-management company in the area should have these aggregated.
- How much new apartment / multifamily construction is in the pipeline within 1–3 miles? Heavy new supply (>2% of stock underway) typically softens rents 12–24 months out; light construction supports rent growth.
Investment metrics
- 1% rule
- 1.34% ✓
- Cap rate
- 10.69%
- Cash-on-cash
- 15.70%
- DSCR
- 1.70
- GRM
- 6.2
CMA / ARV
No comps found within radius.
Show comp detail 12 sales within ~0.75 mi
| Address | Dist | Beds/Ba | Sqft | Sold | Price | $/sf | Match |
|---|---|---|---|---|---|---|---|
| 2940 N Holton St #2942 | 0.03mi | 4/2.0 | 2,032 | 0mo | $195,000 | $96 | 86 |
| 3026 N Pierce St | 0.18mi | 4/2.0 | 1,684 | 1mo | $77,000 | $46 | 79 |
| 522 E Burleigh St | 0.19mi | 4/2.0 | 1,635 | 1mo | $160,000 | $98 | 78 |
| 2816 N Pierce St #2818 | 0.24mi | 6/2.5 | 2,175 | 0mo | $315,000 | $145 | 76 |
| 3143 N Holton St #3145 | 0.23mi | 7/2.0 | 2,623 | 1mo | $286,000 | $109 | 76 |
| 3153 N Buffum St | 0.26mi | 5/2.0 | 2,598 | 1mo | $63,200 | $24 | 75 |
| 2762 N Fratney St | 0.33mi | 4/2.5 | 2,522 | 1mo | $375,000 | $149 | 72 |
| 3205 N 3rd St #3207 | 0.52mi | 6/2.0 | 2,466 | 0mo | $194,000 | $79 | 63 |
| 3037 N Dr William Finlayson St | 0.60mi | 6/2.0 | 1,922 | 0mo | $109,615 | $57 | 60 |
| 3468 N Richards St | 0.65mi | 5/2.0 | 1,640 | 1mo | $230,000 | $140 | 56 |
| 3015 N 6th St #3017 | 0.67mi | 6/2.0 | 2,285 | 0mo | $218,000 | $95 | 56 |
| 2438 N Pierce St | 0.67mi | 5/3.0 | 2,032 | 0mo | $265,000 | $130 | 56 |
Match score weights: distance 35% · size 25% · config 20% · recency 20%. Top-matched comps best support the ARV.
Projected returns pro-forma
-3.0% appreciation · 5.0% rent growth · sell at horizon
- IRR
- 8.8%
- Equity multiple
- 1.35×
- Total profit
- $17,305
- Equity at exit
- $26,078
- IRR
- 19.6%
- Equity multiple
- 2.80×
- Total profit
- $88,296
- Equity at exit
- $15,122
Cash invested: $48,972 (down + closing). Projections, not guarantees.
Landlord ↔ Tenant lean methodology
- Overall (STATE)
- 73 Landlord-Friendly
- State Wisconsin
- 73 Landlord-Friendly · R+2
- County
- — inherits STATE
- City
- — inherits STATE
ZIP-level market 53212
- Rents YoY
- 5.0%
- Active inventory
- 129
- Price-to-rent
- 12.5×
Monthly cashflow live
- Estimated rent
- $2,341 high interval (Pro) →
- Mortgage (P&I)
- −$917
- Tax est. 1.5%
- −$219 /mo · $2,624/yr
- Insurance
- −$73
- HOA
- −$0
- Vacancy / Maint / Mgmt
- −$492
- Net cashflow
- $641
Break-even live
2-unit breakdown (identical units grouped — click to expand)
| Units | Beds | Baths | Est. rent |
|---|---|---|---|
| 2× units | 2 | 1 | $2,340 |
| #1 | 2 | 1 | $1,170 |
| #2 | 2 | 1 | $1,170 |
| Total (2 units) | $2,341 | ||
UW: 25.0% down · 7.5% · 30yr · 1.5% tax · 5.0% vac · 8.0% maint · 8.0% mgmt
Financing live
Cash to close
- Down payment
- $43,725
- Closing costs
- $5,247
- Reserves months
- —
- Total cash needed
- —
Loan-product check · same deal, 3 products live
Conventional
25% down · 7.5% · 30yr
- Down + closing
- —
- Monthly P&I
- —
- Monthly cashflow
- —
- DSCR
- —
- Eligible?
- —
Personal DTI + credit; lowest rate.
DSCR
20% down · 8.5% · 30yr
- Down + closing
- —
- Monthly P&I
- —
- Monthly cashflow
- —
- DSCR
- —
- Eligible?
- —
No personal income docs; deal must DSCR.
Hard money
10% down · 12.0% · 12mo
- Down + closing
- —
- Monthly P&I
- —
- Monthly cashflow
- —
- DSCR
- —
- Eligible?
- —
Short-term bridge; refi at stabilization.
Rent comps 40 comps
| Address | Beds | Baths | Sqft | Rent | $/sqft | DOM | Units | Dist |
|---|---|---|---|---|---|---|---|---|
| 523 E Locust St Milwaukee, WI | 3.0 | 1.0 | 3 | $1,295 | $431.67 | 23d | 1 | 0.10mi |
| 3029 N Holton St Milwaukee, WI | 3.0 | 1.0 | 980 | $1,200 | $1.22 | 43d | 1 | 0.12mi |
| 3042 N Palmer St #2 Milwaukee, WI | 1.0 | 1.0 | 573 | $825 | $1.44 | 23d | 1 | 0.21mi |
| 3042 N Palmer St #5 Milwaukee, WI | 3.0 | 1.0 | 1718 | $1,050 | $0.61 | 23d | 1 | 0.21mi |
| 218 E Hadley St Milwaukee, WI | 2.0 | 1.0 | — | $995 | — | 14d | 1 | 0.23mi |
| 2808 N Palmer St Unit Lower Milwaukee, WI | 2.0 | 1.0 | 1200 | $875 | $0.73 | 43d | 1 | 0.23mi |
| 2863 N Fratney St Unit 2863 Milwaukee, WI | 3.0 | 1.0 | — | $1,425 | — | 43d | 1 | 0.23mi |
| 2930 N 1st St Milwaukee, WI | 2.0 | 1.0 | — | $1,100 | — | 43d | 1 | 0.24mi |
| 2716A N Buffum St Milwaukee, WI | 2.0 | 1.0 | 1100 | $1,200 | $1.09 | 21d | 1 | 0.28mi |
| 3037 N 1st St Milwaukee, WI | 2.0 | 1.0 | 763 | $990 | $1.30 | 43d | 1 | 0.30mi |
| 2934 N Bremen St Milwaukee, WI | 2.0 | 1.0 | 798 | $1,398 | $1.75 | 23d | 1 | 0.30mi |
| 2724 N Palmer St Milwaukee, WI | 3.0 | 1.0 | 900 | $1,300 | $1.44 | 43d | 1 | 0.31mi |
| 2724 N Palmer St Milwaukee, WI | 2.0 | 1.0 | — | $1,200 | — | 23d | 1 | 0.32mi |
| 812 E Burleigh St Unit 1 Milwaukee, WI | 2.0 | 1.0 | — | $1,150 | — | 43d | 1 | 0.32mi |
| 3176 N Booth St Milwaukee, WI | 2.0 | 1.0 | — | $1,100 | — | 43d | 1 | 0.33mi |
| 605 E Auer Ave Milwaukee, WI | 2.0 | 1.0 | 1200 | $1,200 | $1.00 | 10d | 1 | 0.33mi |
| 3211 N Buffum St Milwaukee, WI | 2.0 | 1.0 | 2 | $995 | $497.50 | 43d | 1 | 0.34mi |
| 2772 N Bremen St Milwaukee, WI | 2.0 | 1.0 | 900 | $1,295 | $1.44 | 43d | 1 | 0.36mi |
| 1000 E Locust St Apt 4 Milwaukee, WI | 2.0 | 1.0 | — | $995 | — | 4d | 1 | 0.36mi |
| 2772 N Bremen St #2774 Milwaukee, WI | 3.0 | 1.0 | 1500 | $1,795 | $1.20 | 43d | 1 | 0.36mi |
| 3156 N 1st St Milwaukee, WI | 2.0 | 1.0 | 900 | $895 | $0.99 | 43d | 1 | 0.37mi |
| 2719 N 1st St Milwaukee, WI | 2.0 | 1.0 | 1300 | $1,095 | $0.84 | 14d | 1 | 0.39mi |
| 3228 N Achilles St Unit 3228A Milwaukee, WI | 2.0 | 1.0 | 713 | $895 | $1.26 | 43d | 1 | 0.40mi |
| 3255 N Buffum St Unit 3255 Upper Milwaukee, WI | 2.0 | 1.0 | 1100 | $1,350 | $1.23 | 43d | 1 | 0.41mi |
| 3244 N 1st St Milwaukee, WI | 2.0 | 1.0 | — | $1,000 | — | 23d | 1 | 0.44mi |
| 2761 N Humboldt Blvd Unit First Floor Milwaukee, WI | 3.0 | 1.0 | 1236 | $1,600 | $1.29 | 16d | 1 | 0.45mi |
| 2626 N Fratney St Milwaukee, WI | 2.0 | 1.0 | — | $1,300 | — | 43d | 1 | 0.46mi |
| 2840 N Vel R Phillips Ave Milwaukee, WI | 2.0 | 1.0 | — | $1,100 | — | 16d | 1 | 0.48mi |
| 3248 N 2nd St Unit 2 Milwaukee, WI | 2.0 | 1.0 | — | $1,250 | — | 4d | 1 | 0.49mi |
| 2536 N Richards St Unit 1ST Milwaukee, WI | 2.0 | 1.0 | 1200 | $950 | $0.79 | 43d | 1 | 0.51mi |
| 3352 N Richards St Unit Second floor Milwaukee, WI | 2.0 | 1.0 | 1000 | $1,150 | $1.15 | 43d | 1 | 0.52mi |
| 2636 N Weil St Milwaukee, WI | 2.0 | 1.0 | 900 | $1,100 | $1.22 | 1d | 1 | 0.53mi |
| 2524 N Hubbard St Unit 2524A Upper Milwaukee, WI | 1.0 | 1.0 | 514 | $795 | $1.55 | 43d | 1 | 0.54mi |
| 2507 N Buffum St Milwaukee, WI | 3.0 | 1.0 | 1300 | $1,375 | $1.06 | 19d | 1 | 0.55mi |
| 919 E Clarke St Unit 4 Milwaukee, WI | 2.0 | 1.0 | 1000 | $1,295 | $1.29 | 43d | 1 | 0.55mi |
| 524 E Wright St Milwaukee, WI | 3.0 | 1.0 | 900 | $1,275 | $1.42 | 14d | 1 | 0.55mi |
| 3368 N Booth St #3374 Milwaukee, WI | 2.0 | 1.0 | 900 | $950 | $1.06 | 43d | 1 | 0.56mi |
| 3368 N Booth St #3374 Milwaukee, WI | 2.0 | 1.0 | 900 | $950 | $1.06 | 23d | 1 | 0.56mi |
| 3373 N Richards St Milwaukee, WI | 2.0 | 1.0 | 950 | $1,150 | $1.21 | 23d | 1 | 0.56mi |
| 436 W Burleigh St Unit A Milwaukee, WI | 2.0 | 1.0 | — | $1,300 | — | 12d | 1 | 0.57mi |
Listing history 6 events
-
2026-06-13statusdays on market $174,900 Pending 10 DOM
-
2026-06-09days on market $174,900 Active 7 DOM
-
2026-06-08days on market $174,900 Active 6 DOM
-
2026-06-07days on market $174,900 Active 5 DOM
-
2026-06-05remarks 635-char remark
-
2026-06-05$174,900 Active 2 DOM
ⓘ Source: listings_history table (triggers on properties + properties_extension) + one-shot
backfill from property_details.listing_events for pre-trigger history.
Climate risk First Street
- Flood 1/10 Low FEMA zone X (unshaded) · 0% chance over 30 yrs
- Wildfire 1/10 Low
- Heat 2/10 Low 7 d/yr ≥98°F today · 13 d/yr by 30 yrs out
- Wind 2/10 Low
- Air quality 3/10 Moderate 3 unhealthy d/yr today · 4 by 30 yrs out
Nearby sold comps map
Loading sold comps map…
Walkable amenities ~0.75 mi
Loading nearby amenities…
Taxation est. · year 1
- Rental income
- $28,092
- − Mortgage interest
- −$9,797
- − Property taxes
- −$2,624
- − Insurance
- −$874
- − Repairs & maintenance
- −$2,247
- − Management
- −$2,247
- − Depreciation
- −$5,088
- Taxable income
- $5,214
- Est. tax owed @ 24.0%
- −$1,251
- After-tax cash flow
- $6,437/yr
For passive investors: Depreciation is non-cash, so a rental often shows a tax loss while cash-flowing — sheltering income. Rental losses are passive: they offset passive income freely, and up to $25,000/yr can offset ordinary (W-2) income if you actively participate and your MAGI is under $100k (phasing out to $0 by $150k); unused losses carry forward. On sale, claimed depreciation is recaptured at up to 25%, and gains may owe capital-gains tax (a 1031 exchange can defer both). Figures are a year-1 estimate at your 24.0% rate — not tax advice; consult a CPA.
Schools (NCES district)
- District
- Milwaukee School District
- NCES district ID
- 5509600
- Math proficiency
- 10% ▼ -5.00%
- Reading proficiency
- 18% ▬ 0.00%
- Median HH income
- $36,339
- Composite
- 11.61/100
- National rank
- #9696
- State rank
- #337 of 342 in WI
Livability — Milwaukee
- Score
- 81/100
- State rank
- #55
- US rank
- #1534
Category grades
Schools grade is shown separately in the Schools card above.
Census & demographics
- Census place
- Milwaukee, WI
- County
- Milwaukee County · 926,379 people
- City population
- 573,768
- Metro
- Milwaukee-Waukesha, WI
- Population (ZIP)
- 28,938
- Household income
- $47,298
- Rent vs Own
- Severe rent burden
- 2397.0
Population outlook (Milwaukee County) Hauer SSP2
- Today (2025)
- 995,758 people
- By 2030
- 1,009,124 · +1.3%
- By 2040
- 1,028,128 · +3.3%
- By 2050
- 1,040,066 · +4.4%
- By 2075
- 1,057,849 · +6.2%
- By 2100
- 1,039,774 · +4.4%
Race, ethnicity, and origin ACS 2023
- Neighborhood character
- Diverse neighborhood (Simpson 0.64)
- Race & ethnicity
- Black 48% White 35% Hispanic / Latino 12% Two or more races 9%
- Hispanic origin (detail)
- Mexican 4% Puerto Rican 6%
- Common ancestry
- Romanian 4% Portuguese 2% Italian 2%
- Foreign-born
- 2% · Canada
- Languages at home
- 92% English-only · Spanish 6%
Political lean MEDSL · Milwaukee
- 2024 margin
- Solid D (+38.5) · D 68.3% · R 29.8% · Other 1.8%
- 2008→2024 swing
- +2.7pp toward D · 2008: 35.9pp · 2024: 38.5pp
- All cycles
- 2024: D+38.5 2020: D+39.9 2016: D+37.5 2012: D+34.6 2008: D+35.9
Not yet ingested
- Civics
- —
Market trends
- HPI YoY
- ▼ -216.73%
- Current HPI
- 385.8225
- Rent YoY
- ▲ 5.00%
- Metro
- Milwaukee-Waukesha, WI
- State GDP YoY
- ▲ 2.10%
- F500 in state
- 20
Industry mix (Fortune 500 HQ in WI)
| Industry | F500 HQs | Revenue |
|---|---|---|
| Industrial Machinery | 4 | $23B |
|
||
| Industrial Technology | 2 | $36B |
|
||
| Insurance | 1 | $36B |
|
||
| Professional Services | 1 | $19B |
|
||
| Utilities | 1 | $9B |
|
||
| Consumer Goods | 1 | $3B |
|
||
Price history
+84.3% since first listed3 events — show timeline
- 2026-06-02 Listed $174,900 METROMLS
- 2017-04-01 Listing Removed — METROMLS
- 2016-11-07 Listed $94,900 METROMLS
Cash-flow waterfall
monthlySold comps — $/sqft
last 12 mo · ≤1 miLoading sold comps…