289 Fourth St · York, SC
Flood risk No data
- FEMA flood zone
- —
- Chance of flooding over 30 yrs
- —
- Est. flood insurance / yr
- —
Fire risk No data
- Est. fire insurance / yr
- —
Heat risk No data
- Hot days now (above threshold)
- —
- Hot days in 30 yrs
- —
Wind risk No data
- Chance of severe wind over 30 yrs
- —
Air-quality risk No data
- Unhealthy air days now
- —
- Unhealthy air days in 30 yrs
- —
Risk factors via First Street. Map © Google.
Why this score? — see what drove the D- grade
The composite is a weighted blend of 9 inputs, each scored 0–100. Each bar is that input's sub-score; the figure is the points it added to the 100-point composite (weight × sub-score).
- Cash flow +11.8/30.0
- 1% rule +4.2/10.0
- Condition / age +4.0/5.0
- DSCR +3.5/10.0
- ARV discount +3.3/15.0
- Livability +3.2/5.0
- Schools +3.0/10.0
- Rent growth +2.5/5.0
- Appreciation +0.0/10.0
$270,179
🖨 Deal sheet 📄 Offer letter ✓ Due diligence
Listing remarks MLS
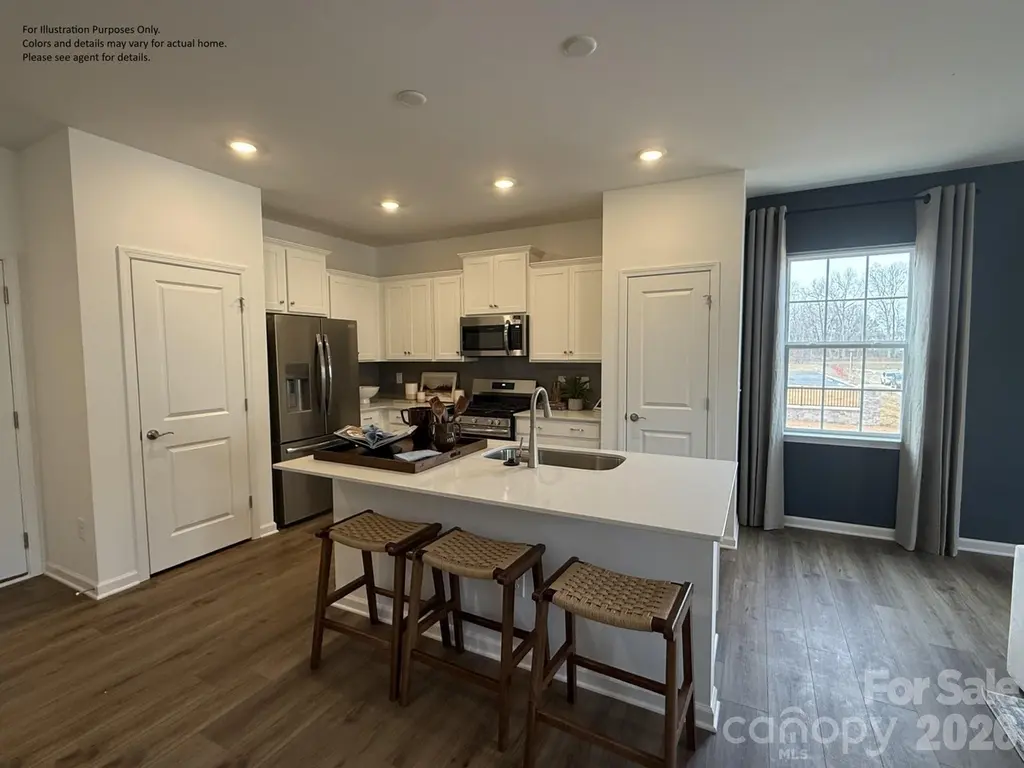
This new two-story townhome has a smart layout that maximizes space and convenience. The first floor is occupied by the living area, which includes an open family room, modern kitchen and an intimate breakfast area. Upstairs are all three bedrooms, including the large owner's suite which comes equipped with a private bathroom and an oversized walk-in closet. A convenient two-car garage completes the home.
Key facts
- Open floorplan
- Swimming pool
- Ceramic tile
Tags
Property features AI
Finance
- Other: Zoning: R-5
- HOA & community: Homeowners association (mandatory) — CAMS; HOA fee $172 monthly; Community features: outdoor pool, cabana, sidewalks; Association subject to required dues; Architectural review restriction
Exterior
- Parking: Attached garage; Driveway; Two garage spaces; Main-level garage
- Security: Carbon monoxide detector(s)
- Utilities: County water; County sewer
- Home design: Townhouse (residential); Two levels; Entry at level 1; Site-built construction; New construction (proposed completion April 2026)
- Construction: Fiber cement exterior; Slab foundation; Built by Lennar (Calisto GE1 model)
- Exterior features: Lawn maintenance provided; End unit
Interior
- Kitchen: Gas range; Microwave; Dishwasher; Garbage disposal; Exhaust fan; Plumbed for ice maker; Kitchen island; Pantry
- Bedrooms: Three bedrooms on the upper level
- Flooring: Carpet; Vinyl
- Bathrooms: Two full bathrooms; One half bathroom (main level)
- Heating & cooling: Forced-air heating (natural gas); Zoned heating and cooling; Electric cooling
- Interior features: Open floorplan; Kitchen island; Pantry; Split bedroom layout; Walk-in closets; Insulated doors
- Laundry & utility: Laundry closet on upper level; Tankless water heater
Neighborhood map
What this means for you Summary
Snapshot
- This is a 3-bed/2.5-bath townhouse listed at $270k. Condition is rated good.
Deal economics
- At list price, monthly cash flow is $-72 ($-863/yr) — negative.
- To cash-flow at today's rent, offer at most $260k (3.9% below list).
- To meet the 1% rule (rent ≥ 1% of price), the offer needs to be $249k (7.8% below list).
- Recommended offer: $249k (7.8% below list) — sets the bar for 1% rule.
- Cap rate 6.0% vs local median 4.6% in York — top-decile yield for the area; either an underpriced asset or a hidden risk that comps aren't pricing in. Stress-test before assuming the spread holds.
Location & tenants
- Location reads 65/100 on livability (#139 in SC) — a middle-class / working-renter tenant base. Strengths: cost of living A+, housing A+, health & safety A+; Watch: crime F, amenities F, commute F.
- York 01 (rural): math 31% / reading 40% proficiency, ranked #41 of 80 in SC (top 51%) — families likely to look elsewhere, expect single-tenant / working-renter base with shorter leases.
- Zoned schools: Hunter Street Elementary (math 52% / reading 47%, grade D, #168 of 597 statewide, top 31%, 405 students, 74% FRL); York Comprehensive High (math 39% / reading 82%, grade C+, #108 of 196 statewide, top 55%, 1,493 students, 68% FRL) — zoned schools average 71% FRL vs 54% district-wide (17 pts higher); higher-poverty schools than district average — tighter screening recommended.
- Zoned-school proficiency averages 55% at this address vs 36% district-wide (+20 pts) — the actual schools serving this property are materially stronger than the York 01 average implies; a family-tenant draw the district grade alone would hide.
- Market conditions: 541 active listings in the ZIP; 3 comparable units currently listed for rent nearby; rentals at typical pace (median 18d on market — plan ~3-4 weeks tenant-placement turnaround); solid renter incomes; 2,550 units permitted in York County in 2024 (350 in 5+ unit buildings).
- This rent runs 38% of the median local income ($79k/yr) — at the standard rent-burdened threshold; future hikes will face affordability resistance.
Forward outlook
- Local home prices are declining (-3.0%/yr); year-one equity from $2k of loan paydown is wiped out by about $8k of value loss. Plan a longer hold.
- York County population projected at +44% by 2050 — long-run rental-demand tailwind backs the buy-and-hold thesis.
Negotiation context
- It's been on market 24 days — a 2% lower offer ($266k) is reasonable based on typical stale-listing flexibility.
- 2 sale attempts with the ask held roughly flat each time — persistent listings suggest the price (not the market) is what's stuck; bring a comps-based counter.
Questions for the listing agent
- What do current leases actually rent for vs. the listed asking? Can we see a recent rent roll and the last 12 months of T-12 income?
- What does the HOA fee cover, when was the last increase, and are there any pending special assessments or reserve-fund shortfalls?
- Is there a deadline driving the sale (1031 exchange, divorce, estate, relocation)? That informs how much negotiation room exists.
- Schools are D-rated, which usually means shorter tenancies and higher turnover. Who's the typical renter profile here, and what's been the actual vacancy rate?
- Crime grade is F in this area — have there been break-ins, vandalism, or insurance claims at this property in the last 3 years? What carrier currently insures it and at what premium?
- The area grade is low — what's the realistic commute time and amenity access for the typical tenant pool here? Any planned neighborhood developments (good or bad) we should know about?
- What's the average days-on-market for RENTAL listings here right now (not sales)? A rising rental-DOM trend means longer vacancies and softer asking-rent achievability than the comps imply.
- What's the recent tenant-quality profile in this submarket — average credit score on applications, eviction rate, late-payment / NSF rate, and stable-employment percentage? A property-management company in the area should have these aggregated.
- How much new for-sale + rental construction is in the pipeline within 1–3 miles? Heavy new supply typically softens prices + rents 12–24 months out; constrained supply supports both.
Investment metrics
- 1% rule
- 0.92% ✗
- Cap rate
- 5.97%
- Cash-on-cash
- -1.14%
- DSCR
- 0.95
- GRM
- 9.0
CMA / ARV
- ARV (on-the-fly)
- $246,960
- Comps found
- 12
Show comp detail 12 sales within ~0.75 mi
| Address | Dist | Beds/Ba | Sqft | Sold | Price | $/sf | Match |
|---|---|---|---|---|---|---|---|
| 612 Sparano Loop | 0.19mi | 3/2.5 | 1,680 (0%) | 1mo | $236,599 | $141 | 91 |
| 620 Sparano Loop | 0.19mi | 3/2.5 | 1,680 (0%) | 1mo | $224,999 | $134 | 90 |
| 624 Sparano Loop | 0.18mi | 3/2.5 | 1,691 (+1%) | 1mo | $267,429 | $158 | 90 |
| 643 Sparano Loop | 0.17mi | 3/2.5 | 1,661 (-1%) | 1mo | $235,000 | $141 | 89 |
| 647 Sparano Loop | 0.17mi | 3/2.5 | 1,657 (-1%) | 1mo | $237,649 | $143 | 89 |
| 625 Sparano Loop | 0.19mi | 3/2.5 | 1,661 (-1%) | 1mo | $245,000 | $148 | 89 |
| 621 Sparano Loop | 0.19mi | 3/2.5 | 1,657 (-1%) | 1mo | $225,849 | $136 | 88 |
| 613 Sparano Loop | 0.20mi | 3/2.5 | 1,657 (-1%) | 1mo | $225,849 | $136 | 88 |
| 609 Sparano Loop | 0.25mi | 3/2.5 | 1,661 (-1%) | 1mo | $256,000 | $154 | 85 |
| 639 Sparano Loop | 0.27mi | 3/2.5 | 1,657 (-1%) | 1mo | $243,132 | $147 | 85 |
| 2024 Crooked Oak Ln | 0.74mi | 3/2.5 | 1,680 (0%) | 5mo | $250,000 | $149 | 61 |
| 2018 Crooked Oak Ln | 0.73mi | 3/2.5 | 1,677 (-0%) | 10mo | $247,000 | $147 | 57 |
Match score weights: distance 35% · size 25% · config 20% · recency 20%. Top-matched comps best support the ARV.
Projected returns pro-forma
-3.0% appreciation · 3.0% rent growth · sell at horizon
- IRR
- -18.1%
- Equity multiple
- 0.36×
- Total profit
- $-48,216
- Equity at exit
- $40,285
- IRR
- -10.2%
- Equity multiple
- 0.37×
- Total profit
- $-47,299
- Equity at exit
- $23,360
Cash invested: $75,650 (down + closing). Projections, not guarantees.
Landlord ↔ Tenant lean methodology
- Overall (STATE)
- 90 Strongly Landlord-Friendly
- State South Carolina
- 90 Strongly Landlord-Friendly · R+6
- County
- — inherits STATE
- City
- — inherits STATE
ZIP-level market 29745
- Home prices YoY
- -30.3%
- Active inventory
- 541
- Price-to-rent
- 9.0×
Monthly cashflow live
- Estimated rent
- $2,490 medium interval (Pro) →
- Mortgage (P&I)
- −$1,417
- Tax est. 1.5%
- −$338 /mo · $4,053/yr
- Insurance
- −$113
- HOA
- −$172
- Vacancy / Maint / Mgmt
- −$523
- Net cashflow
- $-72
Break-even live
UW: 25.0% down · 7.5% · 30yr · 1.5% tax · 5.0% vac · 8.0% maint · 8.0% mgmt
Financing live
Cash to close
- Down payment
- $67,545
- Closing costs
- $8,105
- Reserves months
- —
- Total cash needed
- —
Loan-product check · same deal, 3 products live
Conventional
25% down · 7.5% · 30yr
- Down + closing
- —
- Monthly P&I
- —
- Monthly cashflow
- —
- DSCR
- —
- Eligible?
- —
Personal DTI + credit; lowest rate.
DSCR
20% down · 8.5% · 30yr
- Down + closing
- —
- Monthly P&I
- —
- Monthly cashflow
- —
- DSCR
- —
- Eligible?
- —
No personal income docs; deal must DSCR.
Hard money
10% down · 12.0% · 12mo
- Down + closing
- —
- Monthly P&I
- —
- Monthly cashflow
- —
- DSCR
- —
- Eligible?
- —
Short-term bridge; refi at stabilization.
Rent comps 3 comps
| Address | Beds | Baths | Sqft | Rent | $/sqft | DOM | Units | Dist |
|---|---|---|---|---|---|---|---|---|
| 495 Switch St York, SC | 3.0 | 2.5 | 1928 | $2,500 | $1.30 | 3d | 1 | 0.85mi |
| 515 Trading Post Ln York, SC | 3.0 | 2.5 | 1429 | $2,300 | $1.61 | 23d | 1 | 0.90mi |
| 53 Travora Cir York, SC | 3.0 | 2.0 | 1156 | $1,995 | $1.73 | 17d | 1 | 1.30mi |
HOA detail
- Monthly dues
- $172 · $2,064/yr
Listing history 5 events
-
2026-06-02statusdays on market $270,179 Pending 24 DOM
-
2026-06-01days on market $270,179 Active 23 DOM
-
2026-05-31days on market $270,179 Active 22 DOM
-
2026-05-09$270,179 Active
-
2026-05-08$270,179 Active 408-char remark
Show marketing remark (408 chars)
This new two-story townhome has a smart layout that maximizes space and convenience. The first floor is occupied by the living area, which includes an open family room, modern kitchen and an intimate breakfast area. Upstairs are all three bedrooms, including the large owner's suite which comes equipped with a private bathroom and an oversized walk-in closet. A convenient two-car garage completes the home.
ⓘ Source: listings_history table (triggers on properties + properties_extension) + one-shot
backfill from property_details.listing_events for pre-trigger history.
Nearby sold comps map
Loading sold comps map…
Walkable amenities ~0.75 mi
Loading nearby amenities…
Taxation est. · year 1
- Rental income
- $29,882
- − Mortgage interest
- −$15,134
- − Property taxes
- −$4,053
- − Insurance
- −$1,351
- − Repairs & maintenance
- −$2,391
- − Management
- −$2,391
- − HOA
- −$2,064
- − Depreciation
- −$7,860
- Taxable loss
- −$5,360
- Est. tax savings @ 24.0%
- +$1,286
- After-tax cash flow
- $424/yr
For passive investors: Depreciation is non-cash, so a rental often shows a tax loss while cash-flowing — sheltering income. Rental losses are passive: they offset passive income freely, and up to $25,000/yr can offset ordinary (W-2) income if you actively participate and your MAGI is under $100k (phasing out to $0 by $150k); unused losses carry forward. On sale, claimed depreciation is recaptured at up to 25%, and gains may owe capital-gains tax (a 1031 exchange can defer both). Figures are a year-1 estimate at your 24.0% rate — not tax advice; consult a CPA.
Condition & rehab AI · 8 photos
This townhouse is in excellent condition with modern finishes and a spacious floorplan. It is move-in ready and would benefit from a fresh coat of paint on the exterior to enhance curb appeal.
Value-add opportunities
- Resale Paint exterior siding — Enhances curb appeal and value
- Both Replace sliding glass doors — Improves natural light and ventilation
- Both Install smart home devices — Enhances convenience and energy efficiency
Renovation cost estimate screening
Value-add ROI direction
- Resale Paint exterior siding — Enhances curb appeal and value ↑
- Both Replace sliding glass doors — Improves natural light and ventilation ↑
- Both Install smart home devices — Enhances convenience and energy efficiency ↑
ⓘ Cost ranges are severity-bucket heuristics (US national rule-of-thumb). Get contractor quotes + a written scope before underwriting a rehab budget.
Schools (NCES district)
- District
- York 01
- NCES district ID
- 4503810
- Math proficiency
- 31% ▼ -16.00%
- Reading proficiency
- 40% ▬ 0.00%
- Median HH income
- $44,491
- Composite
- 30.21/100
- National rank
- #6305
- State rank
- #41 of 80 in SC
Livability — York
- Score
- 65/100
- State rank
- #139
- US rank
- #13425
Category grades
Schools grade is shown separately in the Schools card above.
Census & demographics
- Census place
- York, SC
- County
- York County · 281,758 people
- City population
- 34,909
- Metro
- Charlotte-Concord-Gastonia, NC-SC
- Population (ZIP)
- 34,909
- Household income
- $79,117
- Rent vs Own
- Severe rent burden
- 321.0
Population outlook (York County) Hauer SSP2
- Today (2025)
- 307,757 people
- By 2030
- 335,979 · +9.2%
- By 2040
- 391,378 · +27.2%
- By 2050
- 443,234 · +44.0%
- By 2075
- 557,102 · +81.0%
- By 2100
- 625,837 · +103.4%
Race, ethnicity, and origin ACS 2023
- Neighborhood character
- Predominantly White (75%)
- Race & ethnicity
- White 75% Black 12% Two or more races 6% Hispanic / Latino 6% Asian 1%
- Hispanic origin (detail)
- Mexican 4%
- Common ancestry
- Romanian 3% Serbian 3% Italian 2%
- Foreign-born
- 4% · Canada
- Languages at home
- 94% English-only · Spanish 4%
Political lean MEDSL · York
- 2024 margin
- R (+19.1) · D 39.7% · R 58.8% · Other 1.5%
- 2008→2024 swing
- -1.4pp toward R · 2008: -17.7pp · 2024: -19.1pp
- All cycles
- 2024: R+19.1 2020: R+16.5 2016: R+22.1 2012: R+20.5 2008: R+17.7
Not yet ingested
- Civics
- —
Market trends
- HPI YoY
- ▼ -109.42%
- Current HPI
- 251.6848
- Rent YoY
- —
- Metro
- Charlotte-Concord-Gastonia, NC-SC
- State GDP YoY
- ▲ 4.51%
- F500 in state
- 2
Industry mix (Fortune 500 HQ in SC)
| Industry | F500 HQs | Revenue |
|---|---|---|
| Packaging | 1 | $7B |
|
||
Price history
+0.0% since first listed2 events — show timeline
- 2026-05-09 Listed $270,179 CANOPYMLS as Distributed by MLS Grid
- 2026-05-08 Listed $270,179 Zillow
Cash-flow waterfall
monthlySold comps — $/sqft
last 12 mo · ≤1 miLoading sold comps…