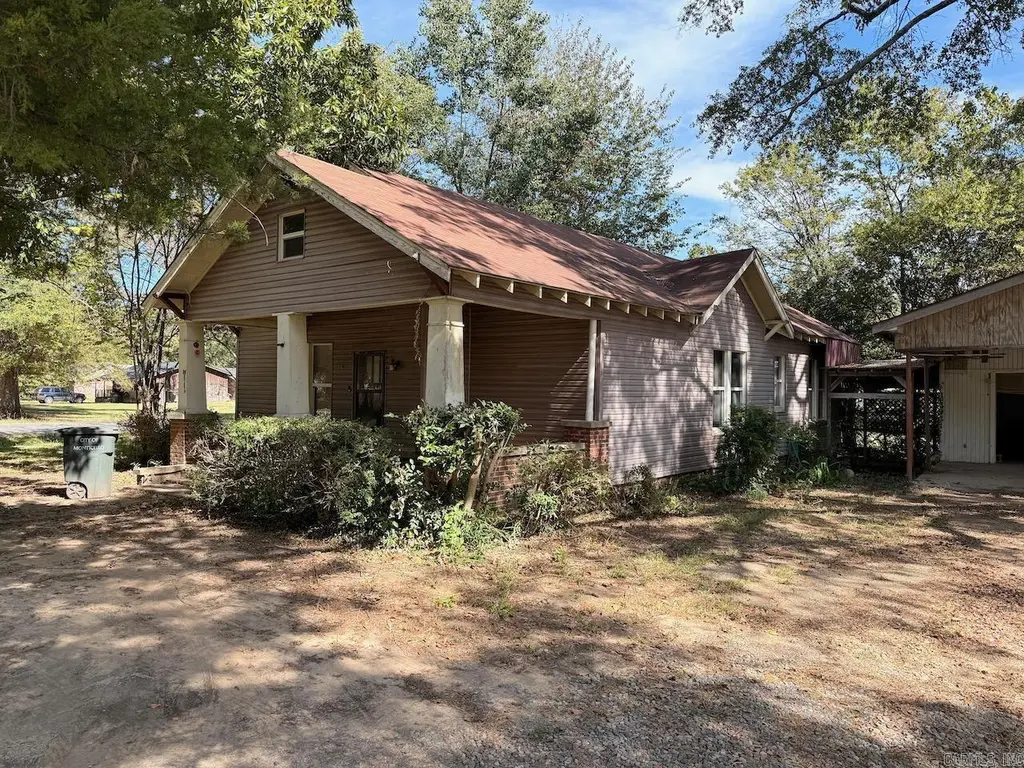
1130 N Gabbert · Monticello, AR
Flood risk 1/10 · Minimal
- FEMA flood zone
- X (unshaded)
- Chance of flooding over 30 yrs
- 0.0%
- Est. flood insurance / yr
- $507 – $1,088
Fire risk 3/10 · Minor
- Est. fire insurance / yr
- $1,499 – $2,785
Heat risk 6/10 · Moderate
- Hot days now (above 109°F)
- 7 days/yr
- Hot days in 30 yrs
- 20 days/yr
Wind risk 6/10 · Moderate
- Chance of severe wind over 30 yrs
- 27.0%
Air-quality risk 1/10 · Minimal
- Unhealthy air days now
- 0 days/yr
- Unhealthy air days in 30 yrs
- 0 days/yr
Risk factors via First Street. Map © Google.
Why this score? — see what drove the D grade
The composite is a weighted blend of 9 inputs, each scored 0–100. Each bar is that input's sub-score; the figure is the points it added to the 100-point composite (weight × sub-score).
- ARV discount +12.5/15.0
- Cash flow +12.4/30.0
- DSCR +3.7/10.0
- Livability +3.5/5.0
- Rent growth +2.5/5.0
- Condition / age +2.5/5.0
- Schools +2.4/10.0
- 1% rule +2.3/10.0
- Appreciation +0.0/10.0
$130,000
🖨 Deal sheet 📄 Offer letter ✓ Due diligence
Listing remarks MLS
2 bedroom 2 bathroom craftsman style home on a corner lot in the heart of Monticello. New shingles on a gable roof with exposed rafters, new flooring throughout with upgraded sub flooring. Full width front porch to enjoy the shaded yard. Detached carport and workshop with plenty of parking. Cash flow opportunity in a rental market that's low on supply or great for a family looking to own their own home.
Key facts
- Gable roof
- Craftsman style home
- Exposed rafters
Tags
Neighborhood map
What this means for you Summary
Snapshot
- This is a 2-bed/1.0-bath single-family listed at $130k.
Deal economics
- At list price, monthly cash flow is $-21 ($-254/yr) — negative.
- To cash-flow at today's rent, offer at most $126k (2.9% below list).
- To meet the 1% rule (rent ≥ 1% of price), the offer needs to be $95k (27.1% below list).
- Recommended offer: $95k (27.1% below list) — sets the bar for 1% rule.
- Cap rate 6.1% vs local median 2.9% in Monticello — top-decile yield for the area; either an underpriced asset or a hidden risk that comps aren't pricing in. Stress-test before assuming the spread holds.
Location & tenants
- Location reads 69/100 on livability (#72 in AR) — a middle-class / working-renter tenant base. Strengths: cost of living A+, health & safety A+, housing A; Watch: schools F, crime D-, amenities F.
- Monticello School District (town): math 30% / reading 29% proficiency, ranked #161 of 238 in AR (top 68%) — low school quality limits family demand, transient renter base, plan for 1-2y turnover.
- Market conditions: 114 active listings in the ZIP; 16 units permitted in Drew County in 2024 (0 in 5+ unit buildings).
Forward outlook
- Local home prices are declining (-3.0%/yr); year-one equity from $899 of loan paydown is wiped out by about $4k of value loss. Plan a longer hold.
- Drew County population projected to shrink 8% by 2050 — rents likely to lag national; underwrite the cash flow, not the appreciation.
Negotiation context
- It's been on market 228 days — a 12% lower offer ($114k) is reasonable based on typical stale-listing flexibility.
- 2 sale attempts with the ask held roughly flat each time — persistent listings suggest the price (not the market) is what's stuck; bring a comps-based counter.
- Current owner paid $28k; list at $130k implies a 364% gain — meaningful room to come down on a strong offer.
Risks & watch-outs
- Watch-outs: built in 1925 — expect roof / HVAC / electrical / plumbing capex.
- Climate carrying-cost: major wind risk, 27% chance of damaging wind over 30y; extreme-heat days projected 7→20/yr by 2055 (HVAC capex compounding) — expect insurance premiums to compound above CPI over the hold.
Questions for the listing agent
- What do current leases actually rent for vs. the listed asking? Can we see a recent rent roll and the last 12 months of T-12 income?
- It's been on market 228 days. Have you received any prior offers? Is the seller open to a 27% concession, seller financing, or rate buy-down credit?
- Built in 1925 — when were the roof, HVAC, electrical panel, plumbing, and water heater last replaced?
- Why hasn't it sold? Are there any deal-killer items the seller is aware of (foundation, flood, title, zoning, code violations)?
- Is there a deadline driving the sale (1031 exchange, divorce, estate, relocation)? That informs how much negotiation room exists.
- Schools are F-rated, which usually means shorter tenancies and higher turnover. Who's the typical renter profile here, and what's been the actual vacancy rate?
- Crime grade is D in this area — have there been break-ins, vandalism, or insurance claims at this property in the last 3 years? What carrier currently insures it and at what premium?
- The area grade is low — what's the realistic commute time and amenity access for the typical tenant pool here? Any planned neighborhood developments (good or bad) we should know about?
- What's the average days-on-market for RENTAL listings here right now (not sales)? A rising rental-DOM trend means longer vacancies and softer asking-rent achievability than the comps imply.
- What's the recent tenant-quality profile in this submarket — average credit score on applications, eviction rate, late-payment / NSF rate, and stable-employment percentage? A property-management company in the area should have these aggregated.
- How much new for-sale + rental construction is in the pipeline within 1–3 miles? Heavy new supply typically softens prices + rents 12–24 months out; constrained supply supports both.
Investment metrics
- 1% rule
- 0.73% ✗
- Cap rate
- 6.10%
- Cash-on-cash
- -0.70%
- DSCR
- 0.97
- GRM
- 11.4
CMA / ARV
- ARV (median comp)
- $146,350
- List price
- $130,000
- Delta
- -11.17%
- Verdict
- UNDERPRICED
- Comps
- 20 within 1.0 mi
Show comp detail 5 sales within ~0.75 mi
| Address | Dist | Beds/Ba | Sqft | Sold | Price | $/sf | Match |
|---|---|---|---|---|---|---|---|
| 705 N Hyatt St | 0.72mi | 2/1.0 | 1,468 (+2%) | 4mo | $31,000 | $21 | 59 |
| 1004 N Chester St | 0.26mi | 3/2.0 (+1) | 1,557 (+8%) | 23mo | $193,500 | $124 | 46 |
| 517 W Wood Ave | 0.70mi | 3/1.0 (+1) | 1,568 (+9%) | 14mo | $55,000 | $35 | 35 |
| 407 Elm Ct | 0.74mi | 3/1.0 (+1) | 1,265 (-12%) | 10mo | $143,000 | $113 | 32 |
| 429 Elm Ct | 0.71mi | 3/1.5 (+1) | 1,324 (-8%) | 19mo | $125,000 | $94 | 31 |
Match score weights: distance 35% · size 25% · config 20% · recency 20%. Top-matched comps best support the ARV.
Projected returns pro-forma
-3.0% appreciation · 3.0% rent growth · sell at horizon
- IRR
- -17.5%
- Equity multiple
- 0.38×
- Total profit
- $-22,480
- Equity at exit
- $19,383
- IRR
- -9.7%
- Equity multiple
- 0.41×
- Total profit
- $-21,575
- Equity at exit
- $11,240
Cash invested: $36,400 (down + closing). Projections, not guarantees.
Landlord ↔ Tenant lean methodology
- Overall (STATE)
- 92 Strongly Landlord-Friendly
- State Arkansas
- 92 Strongly Landlord-Friendly · R+14
- County
- — inherits STATE
- City
- — inherits STATE
ZIP-level market 71655
- Home prices YoY
- -10.8%
- Active inventory
- 114
- Price-to-rent
- 11.4×
Monthly cashflow live
- Estimated rent
- $948 medium interval (Pro) →
- Mortgage (P&I)
- −$682
- Tax from tax record
- −$34 /mo · $413/yr
- Insurance
- −$54
- HOA
- −$0
- Vacancy / Maint / Mgmt
- −$199
- Net cashflow
- $-21
Break-even live
UW: 25.0% down · 7.5% · 30yr · 1.5% tax · 5.0% vac · 8.0% maint · 8.0% mgmt
Financing live
Cash to close
- Down payment
- $32,500
- Closing costs
- $3,900
- Reserves months
- —
- Total cash needed
- —
Loan-product check · same deal, 3 products live
Conventional
25% down · 7.5% · 30yr
- Down + closing
- —
- Monthly P&I
- —
- Monthly cashflow
- —
- DSCR
- —
- Eligible?
- —
Personal DTI + credit; lowest rate.
DSCR
20% down · 8.5% · 30yr
- Down + closing
- —
- Monthly P&I
- —
- Monthly cashflow
- —
- DSCR
- —
- Eligible?
- —
No personal income docs; deal must DSCR.
Hard money
10% down · 12.0% · 12mo
- Down + closing
- —
- Monthly P&I
- —
- Monthly cashflow
- —
- DSCR
- —
- Eligible?
- —
Short-term bridge; refi at stabilization.
Listing history 20 events
-
2026-06-19days on market $130,000 Active 228 DOM
-
2026-06-18days on market $130,000 Active 227 DOM
-
2026-06-17days on market $130,000 Active 226 DOM
-
2026-06-16days on market $130,000 Active 225 DOM
-
2026-06-15days on market $130,000 Active 224 DOM
-
2026-06-14days on market $130,000 Active 222 DOM
-
2026-06-12days on market $130,000 Active 221 DOM
-
2026-06-09days on market $130,000 Active 218 DOM
-
2026-06-08days on market $130,000 Active 217 DOM
-
2026-06-07days on market $130,000 Active 216 DOM
-
2026-06-07days on market $130,000 Active 215 DOM
-
2026-06-04days on market $130,000 Active 212 DOM
-
2026-06-02days on market $130,000 Active 211 DOM
-
2026-06-01days on market $130,000 Active 210 DOM
-
2026-05-31days on market $130,000 Active 209 DOM
-
2026-05-31days on market $130,000 Active 208 DOM
-
2026-05-04status Back on Market 406-char remark
Show marketing remark (406 chars)
2 bedroom 2 bathroom craftsman style home on a corner lot in the heart of Monticello. New shingles on a gable roof with exposed rafters, new flooring throughout with upgraded sub flooring. Full width front porch to enjoy the shaded yard. Detached carport and workshop with plenty of parking. Cash flow opportunity in a rental market that's low on supply or great for a family looking to own their own home.
-
2026-05-01historical 406-char remark
Show marketing remark (406 chars)
2 bedroom 2 bathroom craftsman style home on a corner lot in the heart of Monticello. New shingles on a gable roof with exposed rafters, new flooring throughout with upgraded sub flooring. Full width front porch to enjoy the shaded yard. Detached carport and workshop with plenty of parking. Cash flow opportunity in a rental market that's low on supply or great for a family looking to own their own home.
-
2025-10-30$130,000 New Listing 406-char remark
Show marketing remark (406 chars)
2 bedroom 2 bathroom craftsman style home on a corner lot in the heart of Monticello. New shingles on a gable roof with exposed rafters, new flooring throughout with upgraded sub flooring. Full width front porch to enjoy the shaded yard. Detached carport and workshop with plenty of parking. Cash flow opportunity in a rental market that's low on supply or great for a family looking to own their own home.
-
2010-11-02soldstatus $28,000
ⓘ Source: listings_history table (triggers on properties + properties_extension) + one-shot
backfill from property_details.listing_events for pre-trigger history.
Tax reassessment forecast AR · Resets to sale price
- Current annual tax
- $413 · $34/mo
- Projected year-2 tax
- $832 · $69/mo
- Expected delta
- +$419/yr (+$35/mo · 101.3%)
ⓘ Screening estimate from a state-policy table — verify with the county assessor before closing.
Climate risk First Street
- Flood 1/10 Low FEMA zone X (unshaded) · 0% chance over 30 yrs
- Wildfire 3/10 Moderate
- Heat 6/10 Major 7 d/yr ≥109°F today · 20 d/yr by 30 yrs out
- Wind 6/10 Major 27% chance of damaging wind over 30 yrs
- Air quality 1/10 Low 0 unhealthy d/yr today · 0 by 30 yrs out
Nearby sold comps map
Loading sold comps map…
Walkable amenities ~0.75 mi
Loading nearby amenities…
Taxation est. · year 1
- Rental income
- $11,379
- − Mortgage interest
- −$7,282
- − Property taxes
- −$413
- − Insurance
- −$650
- − Repairs & maintenance
- −$910
- − Management
- −$910
- − Depreciation
- −$3,782
- Taxable loss
- −$2,568
- Est. tax savings @ 24.0%
- +$616
- After-tax cash flow
- $362/yr
For passive investors: Depreciation is non-cash, so a rental often shows a tax loss while cash-flowing — sheltering income. Rental losses are passive: they offset passive income freely, and up to $25,000/yr can offset ordinary (W-2) income if you actively participate and your MAGI is under $100k (phasing out to $0 by $150k); unused losses carry forward. On sale, claimed depreciation is recaptured at up to 25%, and gains may owe capital-gains tax (a 1031 exchange can defer both). Figures are a year-1 estimate at your 24.0% rate — not tax advice; consult a CPA.
Schools (NCES district)
- District
- Monticello School District
- NCES district ID
- 0509840
- Math proficiency
- 30% ▼ -20.00%
- Reading proficiency
- 29% ▼ -12.00%
- Median HH income
- $33,146
- Composite
- 24.19/100
- National rank
- #7732
- State rank
- #161 of 238 in AR
Livability — Monticello
- Score
- 69/100
- State rank
- #72
- US rank
- #8686
Category grades
Schools grade is shown separately in the Schools card above.
Census & demographics
- Census place
- Monticello, AR
- Population (ZIP)
- 13,892
Population outlook (Drew County) Hauer SSP2
- Today (2025)
- 18,483 people
- By 2030
- 18,278 · -1.1%
- By 2040
- 17,712 · -4.2%
- By 2050
- 17,015 · -7.9%
- By 2075
- 15,815 · -14.4%
- By 2100
- 14,335 · -22.4%
Race, ethnicity, and origin ACS 2023
- Neighborhood character
- Majority White (63%)
- Race & ethnicity
- White 63% Black 28% Two or more races 6% Hispanic / Latino 5%
- Common ancestry
- Lithuanian 2% Slovak 1% Serbian 1%
- Foreign-born
- 3% · Canada, China
- Languages at home
- 94% English-only · Spanish 4%
Political lean MEDSL · Drew
- 2024 margin
- Solid R (+33.8) · D 32.2% · R 66.0% · Other 1.8%
- 2008→2024 swing
- -14.7pp toward R · 2008: -19.1pp · 2024: -33.8pp
- All cycles
- 2024: R+33.8 2020: R+27.8 2016: R+24.5 2012: R+18.9 2008: R+19.1
Not yet ingested
- Civics
- —
Market trends
- HPI YoY
- ▼ -26.27%
- Current HPI
- 218.1414
- Rent YoY
- —
- Metro
- —
- State GDP YoY
- ▲ 3.80%
- F500 in state
- 10
Industry mix (Fortune 500 HQ in AR)
| Industry | F500 HQs | Revenue |
|---|---|---|
| Retail | 1 | $681B |
|
||
| Food / Agriculture | 1 | $53B |
|
||
| Retail / Energy | 1 | $22B |
|
||
| Transportation / Logistics | 1 | $12B |
|
||
| Energy | 1 | $4B |
|
||
Price history
+364.3% since first listed4 events — show timeline
- 2026-05-04 Relisted — CARMLS
- 2026-05-01 Listing Removed — CARMLS
- 2025-10-30 Listed $130,000 CARMLS
- 2010-11-02 Sold (Public Records) $28,000 Public Records
Property tax history
+4.2%/yrLatest (2025): $413 · +3.5% YoY. Source: county tax records.
Cash-flow waterfall
monthlySold comps — $/sqft
last 12 mo · ≤1 miLoading sold comps…