 Triplex
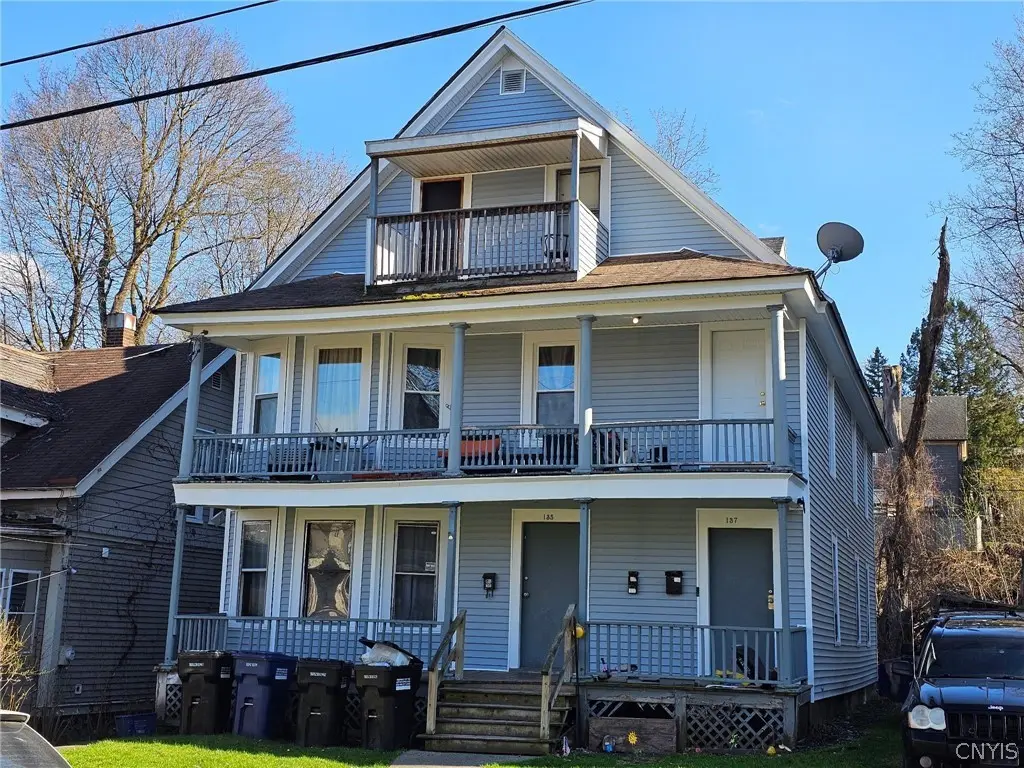
135 Parkside Ave #37 · Syracuse, NY
Flood risk 1/10 · Minimal
- FEMA flood zone
- X (unshaded)
- Chance of flooding over 30 yrs
- 0.0%
- Est. flood insurance / yr
- $473 – $860
Fire risk 1/10 · Minimal
- Est. fire insurance / yr
- $691 – $1,283
Heat risk 3/10 · Minor
- Hot days now (above 95°F)
- 7 days/yr
- Hot days in 30 yrs
- 16 days/yr
Wind risk 1/10 · Minimal
- Chance of severe wind over 30 yrs
- 0.0%
Air-quality risk 2/10 · Minimal
- Unhealthy air days now
- 0 days/yr
- Unhealthy air days in 30 yrs
- 1 days/yr
Risk factors via First Street. Map © Google.
Why this score? — see what drove the C+ grade
The composite is a weighted blend of 9 inputs, each scored 0–100. Each bar is that input's sub-score; the figure is the points it added to the 100-point composite (weight × sub-score).
- Cash flow +30.0/30.0
- 1% rule +10.0/10.0
- DSCR +10.0/10.0
- Livability +3.9/5.0
- Rent growth +2.5/5.0
- Condition / age +2.5/5.0
- Schools +1.8/10.0
- ARV discount +0.0/15.0
- Appreciation +0.0/10.0
$245,000
🖨 Deal sheet 📄 Offer letter ✓ Due diligence
Multi-family units
County records classify this as Multi-Family (2-4 Unit). Listing-text estimate: 3 units. confirmed
Listing remarks
This 3 unit has new windows and new siding put in 2025. All separate meters and Tenants pay their own utilities. GREAT for investors or owner occupied. Exceptional investment opportunity!!!This 3 family could be part of a large portfolio consisting of 13 buildings totaling 36 units, offering scale and strong income potential. All units are occupied by long term tenants, proving consistent cash flow. This is a rare chance to acquire multiple units in a bundle sale. "SOLD AS IS "
Key facts
- Multiple units
- New siding
- New windows
Tags
Property features AI
Finance
- Other: Three separate electric meters and three separate gas meters
- Financial info: Owner pays water; tenants pay all other utilities; Operating expenses include maintenance and water; Each unit currently shows rent of $950
Exterior
- Parking: Paved parking
- Utilities: Public water connected; Sewer connected
- Home design: Multifamily building with 3 units; 2-story building; Vinyl siding; Resale property
- Construction: Vinyl siding construction
- Exterior features: Open porch; Irregular lot; Near public transit; Residential lot; City street frontage
Interior
- Kitchen: Each unit includes an oven/range and refrigerator; Two units include a microwave; one unit specifies an eat-in kitchen
- Bedrooms: Three units: one 2-bedroom unit and two 3-bedroom units
- Flooring: Hardwood; Laminate; Vinyl; Varies
- Bathrooms: Three full bathrooms (one per unit)
- Heating & cooling: Forced air heating with electric and gas options
- Interior features: Full basement; Hardwood, laminate, vinyl and varied flooring
- Laundry & utility: Electric and gas water heaters
Neighborhood map
What this means for you Summary
Snapshot
- This is a 3 × 3-bed/1.0-bath units multifamily listed at $245k.
Deal economics
- At list price, monthly cash flow is $3k ($36k/yr) — positive. Per door: $1k/mo.
- The deal already cash-flows at list — no discount required.
- Meets the 1% rule at list price ($6k rent vs $245k).
- Cap rate 21.1% vs local median 8.2% in Syracuse — top-decile yield for the area; either an underpriced asset or a hidden risk that comps aren't pricing in. Stress-test before assuming the spread holds.
Location & tenants
- Location reads 77/100 on livability (#187 in NY, #2,869 nationally) — a middle-class / working-renter tenant base. Strengths: amenities A+, commute A+, cost of living A+; Watch: schools D+, crime F, employment D-.
- Syracuse City School District (urban): math 18% / reading 26% proficiency, ranked #590 of 590 in NY (top 100%) — low school quality limits family demand, transient renter base, plan for 1-2y turnover; 74% free/reduced lunch — lower-income household profile, screen leases tightly.
- Market conditions: 63 active listings in the ZIP; 616 units permitted in Onondaga County in 2024 (256 in 5+ unit buildings).
Forward outlook
- Local home prices are declining (-3.0%/yr); year-one equity from $2k of loan paydown is wiped out by about $7k of value loss. Plan a longer hold.
- Onondaga County population projected to shrink 9% by 2050 — rents likely to lag national; underwrite the cash flow, not the appreciation.
- At projected returns (-3.0% appreciation + 3.0% rent growth), your $69k cash investment doubles in ~3 years — after that, you're playing with house money.
Negotiation context
- Only 11 days on market — expect competitive offers; lowballing is unlikely to land.
- Current owner paid $30k; list at $245k implies a 717% gain — meaningful room to come down on a strong offer.
Risks & watch-outs
- Watch-outs: built in 1920 — expect roof / HVAC / electrical / plumbing capex.
Questions for the listing agent
- Can we see the unit-by-unit rent roll, current vacancy, and any below-market leases? What's the average tenancy length?
- What capital expenditures (roof, boiler, parking lot, exteriors) have been made in the last 5 years, and what's planned in the next 2?
- Built in 1920 — when were the roof, HVAC, electrical panel, plumbing, and water heater last replaced?
- Is there a deadline driving the sale (1031 exchange, divorce, estate, relocation)? That informs how much negotiation room exists.
- Schools are D-rated, which usually means shorter tenancies and higher turnover. Who's the typical renter profile here, and what's been the actual vacancy rate?
- Crime grade is F in this area — have there been break-ins, vandalism, or insurance claims at this property in the last 3 years? What carrier currently insures it and at what premium?
- What's the average days-on-market for RENTAL listings here right now (not sales)? A rising rental-DOM trend means longer vacancies and softer asking-rent achievability than the comps imply.
- What's the recent tenant-quality profile in this submarket — average credit score on applications, eviction rate, late-payment / NSF rate, and stable-employment percentage? A property-management company in the area should have these aggregated.
- How much new apartment / multifamily construction is in the pipeline within 1–3 miles? Heavy new supply (>2% of stock underway) typically softens rents 12–24 months out; light construction supports rent growth.
Investment metrics
- 1% rule
- 2.35% ✓
- Cap rate
- 21.06%
- Cash-on-cash
- 52.75%
- DSCR
- 3.35
- GRM
- 3.6
CMA / ARV
- ARV (median comp)
- $168,395
- List price
- $245,000
- Delta
- 45.49%
- Verdict
- OVERPRICED
- Comps
- 20 within 1.0 mi
Show comp detail 7 sales within ~0.75 mi
| Address | Dist | Beds/Ba | Sqft | Sold | Price | $/sf | Match |
|---|---|---|---|---|---|---|---|
| 228 Palmer Ave #30 | 0.51mi | 9/3.0 (+1) | 3,462 (-1%) | 3mo | $205,000 | $59 | 66 |
| 944 Bellevue Ave | 0.65mi | 8/3.0 | 3,378 (-4%) | 0mo | $380,000 | $112 | 63 |
| 200 Kirk Ave | 0.70mi | 7/4.0 (-1) | 3,624 (+3%) | 3mo | $209,000 | $58 | 50 |
| 367-369 Furman St | 0.45mi | 9/3.0 (+1) | 3,138 (-11%) | 10mo | $197,000 | $63 | 47 |
| 248 Sterling Ave | 0.47mi | 8/2.0 | 3,076 (-12%) | 16mo | $90,000 | $29 | 41 |
| 252 - 254 Furman St | 0.64mi | 8/2.0 | 3,820 (+9%) | 14mo | $120,000 | $31 | 40 |
| 303 Landon Ave | 0.72mi | 7/3.0 (-1) | 3,740 (+6%) | 14mo | $120,000 | $32 | 39 |
Match score weights: distance 35% · size 25% · config 20% · recency 20%. Top-matched comps best support the ARV.
Projected returns pro-forma
-3.0% appreciation · 3.0% rent growth · sell at horizon
- IRR
- 50.7%
- Equity multiple
- 3.22×
- Total profit
- $152,330
- Equity at exit
- $36,530
- IRR
- 56.1%
- Equity multiple
- 6.54×
- Total profit
- $379,876
- Equity at exit
- $21,183
Cash invested: $68,600 (down + closing). Projections, not guarantees.
Landlord ↔ Tenant lean methodology
- Overall (STATE)
- 15 Strongly Tenant-Friendly
- State New York
- 15 Strongly Tenant-Friendly · D+10
- County
- — inherits STATE
- City
- — inherits STATE
ZIP-level market 13207
- Home prices YoY
- -23.0%
- Active inventory
- 63
- Price-to-rent
- 10.7×
Monthly cashflow live
- Estimated rent
- $5,751 high interval (Pro) →
- Mortgage (P&I)
- −$1,285
- Tax from tax record
- −$141 /mo · $1,693/yr
- Insurance
- −$102
- HOA
- −$0
- Vacancy / Maint / Mgmt
- −$1,208
- Net cashflow
- $3,015
Break-even live
3-unit breakdown (identical units grouped — click to expand)
| Units | Beds | Baths | Est. rent |
|---|---|---|---|
| 3× units | 3 | 1 | $5,751 |
| #1 | 3 | 1 | $1,917 |
| #2 | 3 | 1 | $1,917 |
| #3 | 3 | 1 | $1,917 |
| Total (3 units) | $5,751 | ||
UW: 25.0% down · 7.5% · 30yr · 1.5% tax · 5.0% vac · 8.0% maint · 8.0% mgmt
Financing live
Cash to close
- Down payment
- $61,250
- Closing costs
- $7,350
- Reserves months
- —
- Total cash needed
- —
Loan-product check · same deal, 3 products live
Conventional
25% down · 7.5% · 30yr
- Down + closing
- —
- Monthly P&I
- —
- Monthly cashflow
- —
- DSCR
- —
- Eligible?
- —
Personal DTI + credit; lowest rate.
DSCR
20% down · 8.5% · 30yr
- Down + closing
- —
- Monthly P&I
- —
- Monthly cashflow
- —
- DSCR
- —
- Eligible?
- —
No personal income docs; deal must DSCR.
Hard money
10% down · 12.0% · 12mo
- Down + closing
- —
- Monthly P&I
- —
- Monthly cashflow
- —
- DSCR
- —
- Eligible?
- —
Short-term bridge; refi at stabilization.
Listing history 3 events
-
2026-05-05status Pending 492-char remark
-
2026-04-24$245,000 Active 492-char remark
-
1996-09-16soldstatus $30,000
ⓘ Source: listings_history table (triggers on properties + properties_extension) + one-shot
backfill from property_details.listing_events for pre-trigger history.
Tax reassessment forecast NY · Partial reset (capped growth)
- Current annual tax
- $1,693 · $141/mo
- Projected year-2 tax
- $2,917 · $243/mo
- Expected delta
- +$1,224/yr (+$102/mo · 72.3%)
ⓘ Screening estimate from a state-policy table — verify with the county assessor before closing.
Climate risk First Street
- Flood 1/10 Low FEMA zone X (unshaded) · 0% chance over 30 yrs
- Wildfire 1/10 Low
- Heat 3/10 Moderate 7 d/yr ≥95°F today · 16 d/yr by 30 yrs out
- Wind 1/10 Low 0% chance of damaging wind over 30 yrs
- Air quality 2/10 Low 0 unhealthy d/yr today · 1 by 30 yrs out
Nearby sold comps map
Loading sold comps map…
Walkable amenities ~0.75 mi
Loading nearby amenities…
Taxation est. · year 1
- Rental income
- $69,012
- − Mortgage interest
- −$13,724
- − Property taxes
- −$1,693
- − Insurance
- −$1,225
- − Repairs & maintenance
- −$5,521
- − Management
- −$5,521
- − Depreciation
- −$7,127
- Taxable income
- $34,201
- Est. tax owed @ 24.0%
- −$8,208
- After-tax cash flow
- $27,975/yr
For passive investors: Depreciation is non-cash, so a rental often shows a tax loss while cash-flowing — sheltering income. Rental losses are passive: they offset passive income freely, and up to $25,000/yr can offset ordinary (W-2) income if you actively participate and your MAGI is under $100k (phasing out to $0 by $150k); unused losses carry forward. On sale, claimed depreciation is recaptured at up to 25%, and gains may owe capital-gains tax (a 1031 exchange can defer both). Figures are a year-1 estimate at your 24.0% rate — not tax advice; consult a CPA.
Schools (NCES district)
- District
- Syracuse City School District
- NCES district ID
- 3628590
- Math proficiency
- 18% ▼ -5.00%
- Reading proficiency
- 26% ▬ 0.00%
- Median HH income
- $32,097
- Composite
- 17.83/100
- National rank
- #9007
- State rank
- #590 of 590 in NY
Livability — Syracuse
- Score
- 77/100
- State rank
- #187
- US rank
- #2869
Category grades
Schools grade is shown separately in the Schools card above.
Census & demographics
- Census place
- Syracuse, NY
- City population
- 152,627
- Population (ZIP)
- 12,383
Population outlook (Onondaga County) Hauer SSP2
- Today (2025)
- 467,894 people
- By 2030
- 463,381 · -1.0%
- By 2040
- 447,697 · -4.3%
- By 2050
- 426,399 · -8.9%
- By 2075
- 373,661 · -20.1%
- By 2100
- 307,967 · -34.2%
Race, ethnicity, and origin ACS 2023
- Neighborhood character
- Diverse neighborhood (Simpson 0.68)
- Race & ethnicity
- White 43% Black 33% Hispanic / Latino 17% Two or more races 11% Native American 1% Asian 1%
- Hispanic origin (detail)
- Puerto Rican 13% Cuban 1%
- Common ancestry
- Romanian 3% Lithuanian 1% Slovak 1%
- Foreign-born
- 4% · Canada, South Korea
- Languages at home
- 89% English-only · Spanish 9% French/Haitian/Cajun 1%
Political lean MEDSL · Onondaga
- 2024 margin
- D (+17.3) · D 58.6% · R 41.4%
- 2008→2024 swing
- -3.0pp toward R · 2008: 20.3pp · 2024: 17.3pp
- All cycles
- 2024: D+17.3 2020: D+20.6 2016: D+12.8 2012: D+21.1 2008: D+20.3
Not yet ingested
- Civics
- —
Market trends
- HPI YoY
- ▼ -95.17%
- Current HPI
- 318.9257
- Rent YoY
- —
- Metro
- —
- State GDP YoY
- ▲ 2.60%
- F500 in state
- 92
Industry mix (Fortune 500 HQ in NY)
| Industry | F500 HQs | Revenue |
|---|---|---|
| Financial Services | 10 | $950B |
|
||
| Consumer Goods | 9 | $162B |
|
||
| Insurance | 4 | $225B |
|
||
| Telecommunications | 2 | $144B |
|
||
| Pharmaceuticals | 2 | $112B |
|
||
| Media / Entertainment | 2 | $69B |
|
||
Price history
+716.7% since first listed3 events — show timeline
- 2026-05-05 Pending — CNYIS
- 2026-04-24 Listed $245,000 CNYIS
- 1996-09-16 Sold (Public Records) $30,000 Public Records
Property tax history
+0.1%/yrLatest (2025): $1,693 · +1.4% YoY. Source: county tax records.
Cash-flow waterfall
monthlySold comps — $/sqft
last 12 mo · ≤1 miLoading sold comps…