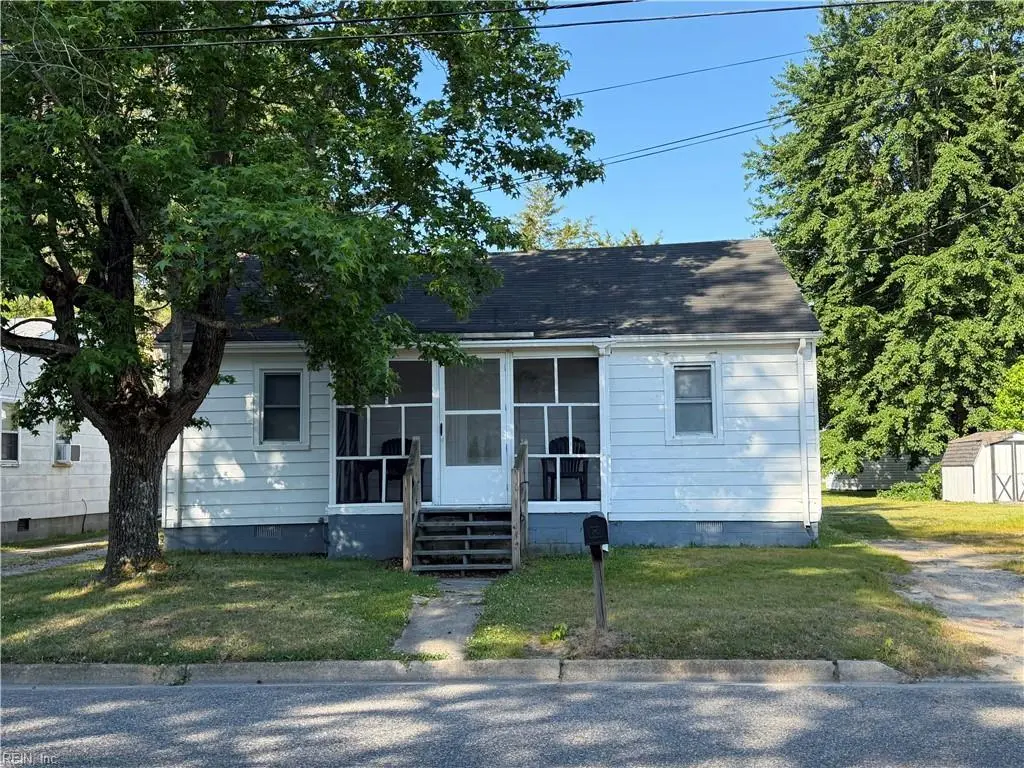
310 S College Dr · Franklin, VA
Flood risk 1/10 · Minimal
- FEMA flood zone
- X (unshaded)
- Chance of flooding over 30 yrs
- 0.0%
- Est. flood insurance / yr
- $507 – $1,088
Fire risk 3/10 · Minor
- Est. fire insurance / yr
- $666 – $1,236
Heat risk 8/10 · Major
- Hot days now (above 107°F)
- 7 days/yr
- Hot days in 30 yrs
- 16 days/yr
Wind risk 7/10 · Major
- Chance of severe wind over 30 yrs
- 78.0%
Air-quality risk 2/10 · Minimal
- Unhealthy air days now
- 0 days/yr
- Unhealthy air days in 30 yrs
- 1 days/yr
Risk factors via First Street. Map © Google.
Why this score? — see what drove the B- grade
The composite is a weighted blend of 9 inputs, each scored 0–100. Each bar is that input's sub-score; the figure is the points it added to the 100-point composite (weight × sub-score).
- Cash flow +30.0/30.0
- 1% rule +10.0/10.0
- DSCR +10.0/10.0
- ARV discount +7.5/15.0
- Schools +3.0/10.0
- Livability +3.0/5.0
- Rent growth +2.5/5.0
- Condition / age +2.5/5.0
- Appreciation +0.0/10.0
$109,000
🖨 Deal sheet 📄 Offer letter ✓ Due diligence
Listing remarks
Welcome to 310 S College Dr in Franklin, Virginia — a charming 2-bedroom, 1-bath home full of opportunity and potential! Whether you’re a first-time homebuyer, downsizing, or searching for your next investment property, this home offers comfortable living with convenience and value. Inside, you’ll find a functional layout with inviting living spaces and plenty of natural light. Situated on a spacious lot, the property provides room to enjoy outdoor living, entertaining, gardening, or future possibilities. Conveniently located near downtown Franklin, shopping, dining, schools, and local amenities, this home offers small-town charm with everyday convenience. Don’t miss
Key facts
- Natural light
- Spacious lot
- Outdoor living
Tags
Property features AI
Finance
- HOA & community: No HOA fees listed
Exterior
- Parking: Driveway spaces; Street parking
- Utilities: City/County water; City/County sewer; Electric service
- Home design: Detached ranch; Single-story (1 story); Crawl foundation; Simple ownership
- Construction: Vinyl exterior; Composite roofing; Crawl space foundation
- Exterior features: Vinyl siding; Composite roof; Approximately 0.172 acre lot
Interior
- Kitchen: Electric range; Refrigerator
- Bedrooms: Bedroom and full bathroom on the first floor
- Flooring: Carpet; Vinyl
- Bathrooms: 1 full bathroom
- Heating & cooling: Heat pump heating; Central air conditioning; Electric water heater
- Interior features: Carpet and vinyl flooring
Neighborhood map
What this means for you Summary
Snapshot
- This is a 2-bed/1.0-bath single-family listed at $109k.
Deal economics
- At list price, monthly cash flow is $742 ($9k/yr) — positive.
- The deal already cash-flows at list — no discount required.
- Meets the 1% rule at list price ($2k rent vs $109k).
- Recommended offer: $107k (1.5% below list) — sets the bar for market timing.
- Cap rate 14.5% vs local median 3.9% in Franklin — top-decile yield for the area; either an underpriced asset or a hidden risk that comps aren't pricing in. Stress-test before assuming the spread holds.
Location & tenants
- Location reads 59/100 on livability (#461 in VA) — a working-class tenant base; expect higher turnover. Strengths: cost of living A+, housing A+, health & safety B+; Watch: crime F, amenities F, commute F.
- Franklin City Public School District (town): math 23% / reading 51% proficiency, ranked #127 of 131 in VA (top 97%) — families likely to look elsewhere, expect single-tenant / working-renter base with shorter leases; 75% free/reduced lunch — lower-income household profile, screen leases tightly.
- Zoned schools: S.P. Morton Elementary (math 16% / reading 38%, grade F, #1,029 of 1,108 statewide, top 94%, 481 students, 101% FRL); Franklin High (math 37% / reading 82%, grade C+, #247 of 319 statewide, top 80%, 378 students, 100% FRL) — zoned schools average 101% FRL vs 75% district-wide (26 pts higher); higher-poverty schools than district average — tighter screening recommended.
- Market conditions: 137 active listings in the ZIP; 1 comparable units currently listed for rent nearby.
Forward outlook
- Local home prices are declining (-3.0%/yr); year-one equity from $754 of loan paydown is wiped out by about $3k of value loss. Plan a longer hold.
- Franklin County population projected at -22% by 2050 — secular population decline; favor cash flow + early exit over multi-decade hold.
- At projected returns (-3.0% appreciation + 3.0% rent growth), your $31k cash investment doubles in ~5 years — after that, you're playing with house money.
Negotiation context
- It's been on market 29 days — a 2% lower offer ($107k) is reasonable based on typical stale-listing flexibility.
- 2 sale attempts; this cycle's ask has dropped $40k (27%) from the opening price — seller is motivated, your offer sets the floor, not the list.
Risks & watch-outs
- Climate carrying-cost: major wind risk, 78% chance of damaging wind over 30y; extreme-heat days projected 7→16/yr by 2055 (HVAC capex compounding) — expect insurance premiums to compound above CPI over the hold.
Questions for the listing agent
- Built in 1969 — when were the roof, HVAC, electrical panel, plumbing, and water heater last replaced?
- Is there a deadline driving the sale (1031 exchange, divorce, estate, relocation)? That informs how much negotiation room exists.
- Schools are B-rated — typically a magnet for longer-tenancy family renters. What's the average tenant stay here, and is there a school-zone premium baked into asking?
- Crime grade is F in this area — have there been break-ins, vandalism, or insurance claims at this property in the last 3 years? What carrier currently insures it and at what premium?
- What's the average days-on-market for RENTAL listings here right now (not sales)? A rising rental-DOM trend means longer vacancies and softer asking-rent achievability than the comps imply.
- What's the recent tenant-quality profile in this submarket — average credit score on applications, eviction rate, late-payment / NSF rate, and stable-employment percentage? A property-management company in the area should have these aggregated.
- How much new for-sale + rental construction is in the pipeline within 1–3 miles? Heavy new supply typically softens prices + rents 12–24 months out; constrained supply supports both.
Investment metrics
- 1% rule
- 1.65% ✓
- Cap rate
- 14.46%
- Cash-on-cash
- 29.18%
- DSCR
- 2.30
- GRM
- 5.0
CMA / ARV
No comps found within radius.
Projected returns pro-forma
-3.0% appreciation · 3.0% rent growth · sell at horizon
- IRR
- 23.6%
- Equity multiple
- 1.97×
- Total profit
- $29,592
- Equity at exit
- $16,252
- IRR
- 31.5%
- Equity multiple
- 3.84×
- Total profit
- $86,567
- Equity at exit
- $9,424
Cash invested: $30,520 (down + closing). Projections, not guarantees.
Landlord ↔ Tenant lean methodology
- Overall (STATE)
- 55 Moderately Landlord-Leaning
- State Virginia
- 55 Moderately Landlord-Leaning · D+2
- County
- — inherits STATE
- City
- — inherits STATE
ZIP-level market 23851
- Home prices YoY
- -10.2%
- Active inventory
- 137
- Price-to-rent
- 5.0×
Monthly cashflow live
- Estimated rent
- $1,800 medium interval (Pro) →
- Mortgage (P&I)
- −$572
- Tax from tax record
- −$63 /mo · $753/yr
- Insurance
- −$45
- HOA
- −$0
- Vacancy / Maint / Mgmt
- −$378
- Net cashflow
- $742
Break-even live
UW: 25.0% down · 7.5% · 30yr · 1.5% tax · 5.0% vac · 8.0% maint · 8.0% mgmt
Financing live
Cash to close
- Down payment
- $27,250
- Closing costs
- $3,270
- Reserves months
- —
- Total cash needed
- —
Loan-product check · same deal, 3 products live
Conventional
25% down · 7.5% · 30yr
- Down + closing
- —
- Monthly P&I
- —
- Monthly cashflow
- —
- DSCR
- —
- Eligible?
- —
Personal DTI + credit; lowest rate.
DSCR
20% down · 8.5% · 30yr
- Down + closing
- —
- Monthly P&I
- —
- Monthly cashflow
- —
- DSCR
- —
- Eligible?
- —
No personal income docs; deal must DSCR.
Hard money
10% down · 12.0% · 12mo
- Down + closing
- —
- Monthly P&I
- —
- Monthly cashflow
- —
- DSCR
- —
- Eligible?
- —
Short-term bridge; refi at stabilization.
Rent comps 1 comps
| Address | Beds | Baths | Sqft | Rent | $/sqft | DOM | Units | Dist |
|---|---|---|---|---|---|---|---|---|
| 116 Holland Cir Franklin, VA | 3.0 | 1.0 | 1056 | $1,800 | $1.70 | 44d | 1 | 0.38mi |
Listing history 22 events
-
2026-06-18price $109,000 Active 29 DOM
-
2026-06-18days on market $118,000 Active 29 DOM
-
2026-06-17days on market $118,000 Active 28 DOM
-
2026-06-16days on market $118,000 Active 27 DOM
-
2026-06-15days on market $118,000 Active 26 DOM
-
2026-06-15pricedays on market $118,000 Active 25 DOM
-
2026-06-13days on market $128,880 Active 24 DOM
-
2026-06-12pricedays on market $128,880 Active 23 DOM
-
2026-06-09days on market $138,800 Active 20 DOM
-
2026-06-08days on market $138,800 Active 19 DOM
-
2026-06-08pricedays on market $138,800 Active 18 DOM
-
2026-06-05days on market $144,990 Active 16 DOM
-
2026-06-03days on market $144,990 Active 14 DOM
-
2026-06-02days on market $144,990 Active 13 DOM
-
2026-06-01pricedays on market $144,990 Active 12 DOM
-
2026-05-31days on market $149,000 Active 11 DOM
-
2026-05-20$149,000 Active
-
2025-01-23historical
-
2025-01-17price $93,500
-
2025-01-13$94,000 Active
-
2021-09-23soldstatus $100,000
-
2005-02-10soldstatus $25,600
ⓘ Source: listings_history table (triggers on properties + properties_extension) + one-shot
backfill from property_details.listing_events for pre-trigger history.
Tax reassessment forecast VA · Resets to sale price
- Current annual tax
- $753 · $63/mo
- Projected year-2 tax
- $894 · $74/mo
- Expected delta
- +$141/yr (+$12/mo · 18.7%)
ⓘ Screening estimate from a state-policy table — verify with the county assessor before closing.
Climate risk First Street
- Flood 1/10 Low FEMA zone X (unshaded) · 0% chance over 30 yrs
- Wildfire 3/10 Moderate
- Heat 8/10 Severe 7 d/yr ≥107°F today · 16 d/yr by 30 yrs out
- Wind 7/10 Severe 78% chance of damaging wind over 30 yrs
- Air quality 2/10 Low 0 unhealthy d/yr today · 1 by 30 yrs out
Nearby sold comps map
Loading sold comps map…
Walkable amenities ~0.75 mi
Loading nearby amenities…
Taxation est. · year 1
- Rental income
- $21,600
- − Mortgage interest
- −$6,106
- − Property taxes
- −$753
- − Insurance
- −$545
- − Repairs & maintenance
- −$1,728
- − Management
- −$1,728
- − Depreciation
- −$3,171
- Taxable income
- $7,569
- Est. tax owed @ 24.0%
- −$1,817
- After-tax cash flow
- $7,090/yr
For passive investors: Depreciation is non-cash, so a rental often shows a tax loss while cash-flowing — sheltering income. Rental losses are passive: they offset passive income freely, and up to $25,000/yr can offset ordinary (W-2) income if you actively participate and your MAGI is under $100k (phasing out to $0 by $150k); unused losses carry forward. On sale, claimed depreciation is recaptured at up to 25%, and gains may owe capital-gains tax (a 1031 exchange can defer both). Figures are a year-1 estimate at your 24.0% rate — not tax advice; consult a CPA.
Schools (NCES district)
- District
- Franklin City Public School District
- NCES district ID
- 5101410
- Math proficiency
- 23% ▼ -48.00%
- Reading proficiency
- 51% ▼ -18.00%
- Median HH income
- $35,138
- Composite
- 30.47/100
- National rank
- #6227
- State rank
- #127 of 131 in VA
Livability — Franklin
- Score
- 59/100
- State rank
- #461
- US rank
- #19645
Category grades
Schools grade is shown separately in the Schools card above.
Census & demographics
- Census place
- Franklin, VA
- Population (ZIP)
- 13,481
Population outlook (Franklin County) Hauer SSP2
- Today (2025)
- 7,817 people
- By 2030
- 7,480 · -4.3%
- By 2040
- 6,803 · -13.0%
- By 2050
- 6,124 · -21.7%
- By 2075
- 4,484 · -42.6%
- By 2100
- 2,967 · -62.0%
Race, ethnicity, and origin ACS 2023
- Neighborhood character
- Diverse neighborhood (Simpson 0.60)
- Race & ethnicity
- Black 45% White 44% Two or more races 8% Hispanic / Latino 2% Asian 2%
- Common ancestry
- Serbian 2% Slovak 1% Lithuanian 1%
- Foreign-born
- 2% · South Korea, Canada
- Languages at home
- 97% English-only · Spanish 2% Other Indo-European 1%
Political lean MEDSL · Franklin
- 2024 margin
- Strong D (+22.8) · D 60.9% · R 38.1% · Other 1.1%
- 2008→2024 swing
- -5.3pp toward R · 2008: 28.1pp · 2024: 22.8pp
- All cycles
- 2024: D+22.8 2020: D+25.6 2016: D+27.1 2012: D+30.7 2008: D+28.1
Not yet ingested
- Civics
- —
Market trends
- HPI YoY
- ▼ -33.51%
- Current HPI
- 293.564
- Rent YoY
- —
- Metro
- —
- State GDP YoY
- ▲ 2.40%
- F500 in state
- 50
Industry mix (Fortune 500 HQ in VA)
| Industry | F500 HQs | Revenue |
|---|---|---|
| Aerospace / Defense | 4 | $236B |
|
||
| Technology / Defense | 3 | $32B |
|
||
| Financial Services | 2 | $176B |
|
||
| Utilities | 2 | $27B |
|
||
| Insurance | 2 | $25B |
|
||
| Technology | 2 | $15B |
|
||
Price history
+482.0% since first listed6 events — show timeline
- 2026-05-20 Listed $149,000 REINMLS
- 2025-01-23 Listing Removed — REINMLS
- 2025-01-17 Price Changed $93,500 REINMLS
- 2025-01-13 Listed $94,000 REINMLS
- 2021-09-23 Sold (Public Records) $100,000 Public Records
- 2005-02-10 Sold (Public Records) $25,600 Public Records
Property tax history
+3.6%/yrLatest (2025): $753 · +0.0% YoY. Source: county tax records.
Cash-flow waterfall
monthlySold comps — $/sqft
last 12 mo · ≤1 miLoading sold comps…