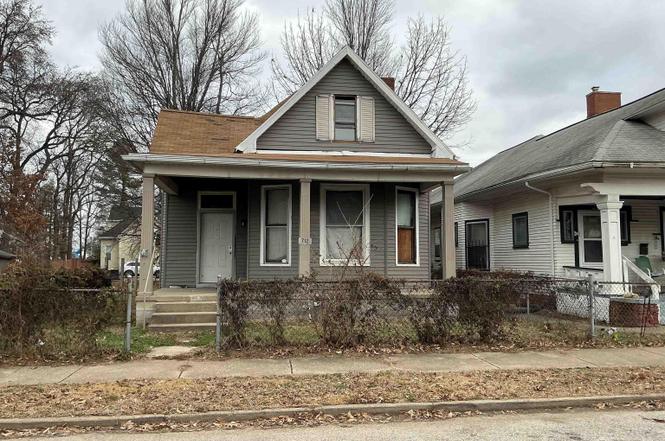
712 E Blackford Ave · Evansville, IN
Flood risk 1/10 · Minimal
- FEMA flood zone
- X (unshaded)
- Chance of flooding over 30 yrs
- 0.0%
- Est. flood insurance / yr
- $473 – $860
Fire risk 1/10 · Minimal
- Est. fire insurance / yr
- $717 – $1,331
Heat risk 5/10 · Moderate
- Hot days now (above 107°F)
- 7 days/yr
- Hot days in 30 yrs
- 18 days/yr
Wind risk 2/10 · Minimal
- Chance of severe wind over 30 yrs
- 3.0%
Air-quality risk 4/10 · Minor
- Unhealthy air days now
- 3 days/yr
- Unhealthy air days in 30 yrs
- 5 days/yr
Risk factors via First Street. Map © Google.
Why this score? — see what drove the B grade
The composite is a weighted blend of 9 inputs, each scored 0–100. Each bar is that input's sub-score; the figure is the points it added to the 100-point composite (weight × sub-score).
- Cash flow +30.0/30.0
- 1% rule +10.0/10.0
- DSCR +10.0/10.0
- ARV discount +7.5/15.0
- Rent growth +5.0/5.0
- Schools +3.3/10.0
- Livability +3.2/5.0
- Condition / age +2.5/5.0
- Appreciation +0.0/10.0
$29,900
🖨 Deal sheet 📄 Offer letter ✓ Due diligence
Listing remarks
2 bedrooms 1 bath house next to open lot.
Key facts
- 4,588 sq ft lot
- Built 1919
- Listed 52 days
Property features AI
Exterior
- Utilities: Public water; Public sewer
- Home design: Single-family residence; Site-built home; One story
- Construction: Aluminum siding; Vinyl siding
- Exterior features: Lot approximately 37 x 124 (0.11 acre)
Interior
- Bathrooms: 1 full bathroom; 1 main-level bathroom
- Heating & cooling: Central air conditioning; Forced air heating
- Interior features: Partial, unfinished basement; 5 total rooms
Neighborhood map
What this means for you Summary
Snapshot
- This is a 2-bed/1.0-bath single-family listed at $30k.
Deal economics
- At list price, monthly cash flow is $730 ($9k/yr) — positive.
- The deal already cash-flows at list — no discount required.
- Meets the 1% rule at list price ($1k rent vs $30k).
- Recommended offer: $29k (3.0% below list) — sets the bar for market timing.
- Cap rate 35.6% vs local median 4.6% in Evansville — top-decile yield for the area; either an underpriced asset or a hidden risk that comps aren't pricing in. Stress-test before assuming the spread holds.
Location & tenants
- Location reads 63/100 on livability (#416 in IN) — a middle-class / working-renter tenant base. Strengths: cost of living A+, housing A+, health & safety A+; Watch: crime F, commute F, employment D-.
- Evansville Vanderburgh School Corporation (urban): math 36% / reading 43% proficiency, ranked #153 of 301 in IN (top 51%) — families likely to look elsewhere, expect single-tenant / working-renter base with shorter leases.
- Zoned schools: Lodge Community School (math 11% / reading 19%, grade F, #859 of 994 statewide, top 87%, 382 students, 85% FRL) — zoned schools average 85% FRL vs 50% district-wide (35 pts higher); higher-poverty schools than district average — tighter screening recommended.
- Zoned-school proficiency averages 15% at this address vs 40% district-wide (-24 pts) — the specific schools serving this property underperform the Evansville Vanderburgh School Corporation average; the district grade overstates school quality for this exact location.
- Market conditions: Rents rising fast (+9.9%/yr); 118 active listings in the ZIP; 17 comparable units currently listed for rent nearby; rentals at typical pace (median 21d on market — plan ~3-4 weeks tenant-placement turnaround); lower-income renter base — watch delinquency; 508 units permitted in Vanderburgh County in 2024 (32 in 5+ unit buildings).
- This rent runs 36% of the median local income ($41k/yr) — at the standard rent-burdened threshold; future hikes will face affordability resistance.
Forward outlook
- Local home prices are declining (-3.0%/yr); year-one equity from $207 of loan paydown is wiped out by about $897 of value loss. Plan a longer hold.
- At projected returns (-3.0% appreciation + 8.0% rent growth), your $8k cash investment doubles in ~2 years — after that, you're playing with house money.
Negotiation context
- It's been on market 52 days — a 3% lower offer ($29k) is reasonable based on typical stale-listing flexibility.
Risks & watch-outs
- Watch-outs: property tax is 3.0% of price; built in 1919 — expect roof / HVAC / electrical / plumbing capex.
- Climate carrying-cost: extreme-heat days projected 7→18/yr by 2055 (HVAC capex compounding) — expect insurance premiums to compound above CPI over the hold.
Questions for the listing agent
- It's been on market 52 days. Have you received any prior offers? Is the seller open to a 3% concession, seller financing, or rate buy-down credit?
- Built in 1919 — when were the roof, HVAC, electrical panel, plumbing, and water heater last replaced?
- Property tax is high relative to price — has the assessment been appealed recently, and will the sale trigger a re-assessment?
- Is there a deadline driving the sale (1031 exchange, divorce, estate, relocation)? That informs how much negotiation room exists.
- Schools are D-rated, which usually means shorter tenancies and higher turnover. Who's the typical renter profile here, and what's been the actual vacancy rate?
- Crime grade is F in this area — have there been break-ins, vandalism, or insurance claims at this property in the last 3 years? What carrier currently insures it and at what premium?
- What's the average days-on-market for RENTAL listings here right now (not sales)? A rising rental-DOM trend means longer vacancies and softer asking-rent achievability than the comps imply.
- What's the recent tenant-quality profile in this submarket — average credit score on applications, eviction rate, late-payment / NSF rate, and stable-employment percentage? A property-management company in the area should have these aggregated.
- How much new for-sale + rental construction is in the pipeline within 1–3 miles? Heavy new supply typically softens prices + rents 12–24 months out; constrained supply supports both.
Investment metrics
- 1% rule
- 4.13% ✓
- Cap rate
- 35.57%
- Cash-on-cash
- 104.57%
- DSCR
- 5.65
- GRM
- 2.0
CMA / ARV
- ARV (on-the-fly)
- $157,913
- Comps found
- 12
Show comp detail 12 sales within ~0.75 mi
| Address | Dist | Beds/Ba | Sqft | Sold | Price | $/sf | Match |
|---|---|---|---|---|---|---|---|
| 712 E Blackford Ave | 0.00mi | 2/1.0 | 1,327 (0%) | 1mo | $22,000 | $17 | 100 |
| 717 E Blackford Ave | 0.03mi | 3/1.0 (+1) | 1,303 (-2%) | 5mo | $29,250 | $22 | 86 |
| 868 Bellemeade Ave | 0.40mi | 2/1.0 | 1,232 (-7%) | 5mo | $150,000 | $122 | 66 |
| 613 Madison Ave | 0.28mi | 3/1.0 (+1) | 1,176 (-11%) | 4mo | $165,000 | $140 | 60 |
| 1101 Ravenswood Dr | 0.72mi | 2/1.0 | 1,269 (-4%) | 1mo | $155,000 | $122 | 58 |
| 1025 Jefferson Ave | 0.48mi | 2/1.0 | 1,453 (+10%) | 5mo | $113,000 | $78 | 58 |
| 600 E Chandler Ave | 0.18mi | 3/2.0 (+1) | 1,525 (+15%) | 3mo | $51,000 | $33 | 55 |
| 1108 E Blackford Ave | 0.51mi | 2/1.0 | 1,176 (-11%) | 3mo | $48,500 | $41 | 54 |
| 1041 E Chandler Ave | 0.46mi | 3/2.0 (+1) | 1,412 (+6%) | 6mo | $167,888 | $119 | 54 |
| 1045 Bayard Park Dr | 0.49mi | 3/1.5 (+1) | 1,440 (+8%) | 4mo | $110,000 | $76 | 53 |
| 957 Taylor Ave | 0.56mi | 2/1.0 | 1,196 (-10%) | 6mo | $159,900 | $134 | 52 |
| 300 Waggoner Ave | 0.72mi | 3/1.0 (+1) | 1,232 (-7%) | 7mo | $146,500 | $119 | 44 |
Match score weights: distance 35% · size 25% · config 20% · recency 20%. Top-matched comps best support the ARV.
Projected returns pro-forma
-3.0% appreciation · 8.0% rent growth · sell at horizon
- IRR
- —
- Equity multiple
- 6.75×
- Total profit
- $48,180
- Equity at exit
- $4,458
- IRR
- —
- Equity multiple
- 16.72×
- Total profit
- $131,625
- Equity at exit
- $2,585
Cash invested: $8,372 (down + closing). Projections, not guarantees.
Landlord ↔ Tenant lean methodology
- Overall (STATE)
- 90 Strongly Landlord-Friendly
- State Indiana
- 90 Strongly Landlord-Friendly · R+11
- County
- — inherits STATE
- City
- — inherits STATE
ZIP-level market 47713
- Home prices YoY
- -34.1%
- Rents YoY
- 9.9%
- Active inventory
- 118
- Price-to-rent
- 2.0×
Monthly cashflow live
- Estimated rent
- $1,234 high interval (Pro) →
- Mortgage (P&I)
- −$157
- Tax from tax record
- −$76 /mo · $908/yr
- Insurance
- −$12
- HOA
- −$0
- Vacancy / Maint / Mgmt
- −$259
- Net cashflow
- $730
Break-even live
UW: 25.0% down · 7.5% · 30yr · 1.5% tax · 5.0% vac · 8.0% maint · 8.0% mgmt
Financing live
Cash to close
- Down payment
- $7,475
- Closing costs
- $897
- Reserves months
- —
- Total cash needed
- —
Loan-product check · same deal, 3 products live
Conventional
25% down · 7.5% · 30yr
- Down + closing
- —
- Monthly P&I
- —
- Monthly cashflow
- —
- DSCR
- —
- Eligible?
- —
Personal DTI + credit; lowest rate.
DSCR
20% down · 8.5% · 30yr
- Down + closing
- —
- Monthly P&I
- —
- Monthly cashflow
- —
- DSCR
- —
- Eligible?
- —
No personal income docs; deal must DSCR.
Hard money
10% down · 12.0% · 12mo
- Down + closing
- —
- Monthly P&I
- —
- Monthly cashflow
- —
- DSCR
- —
- Eligible?
- —
Short-term bridge; refi at stabilization.
Rent comps 17 comps
| Address | Beds | Baths | Sqft | Rent | $/sqft | DOM | Units | Dist |
|---|---|---|---|---|---|---|---|---|
| 734 Bayard Park Dr Evansville, IN | 3.0 | 2.0 | 1000 | $1,425 | $1.43 | 20d | 1 | 0.19mi |
| 605 Madison Ave Evansville, IN | 2.0 | 1.0 | 1069 | $1,375 | $1.29 | 20d | 1 | 0.29mi |
| 827 Judson St Evansville, IN | 3.0 | 1.0 | 1008 | $1,295 | $1.28 | 13d | 1 | 0.43mi |
| 1133 Bayard Park Dr Unit B Evansville, IN | 2.0 | 1.0 | 990 | $800 | $0.81 | 20d | 1 | 0.57mi |
| 17 Washington Ave Evansville, IN | 2.0 | 1.0 | 882 | $1,455 | $1.65 | 20d | 1 | 0.63mi |
| 615 SE 3rd St Unit D Evansville, IN | 1.0 | 1.0 | 1122 | $895 | $0.80 | 20d | 1 | 0.76mi |
| 304 S Grand Ave Evansville, IN | 2.0 | 1.0 | 967 | $955 | $0.99 | 20d | 1 | 0.77mi |
| 322 SE 1st St Evansville, IN | 1.0–2.0 | 1.0 | 1100 | $1,700 | $1.55 | 20d | 6 | 0.97mi |
| 315 SE 1st St Evansville, IN | 1.0 | 1.0 | 1331 | $1,695 | $1.27 | 20d | 1 | 1.00mi |
| 202 SE 1st St Evansville, IN | 1.0–2.0 | 1.0 | 926 | $2,449 | $2.64 | 20d | 4 | 1.05mi |
| 100 SE 1st St Evansville, IN | 1.0–2.0 | 1.0–2.0 | 715 | $1,725 | $2.41 | 13d | 17 | 1.11mi |
| 41 W Division St Apt 200 Evansville, IN | 2.0 | 2.0 | 1083 | $1,500 | $1.39 | 20d | 1 | 1.15mi |
| 706 Court St Evansville, IN | 2.0 | 1.5 | 1100 | $850 | $0.77 | 20d | 1 | 1.20mi |
| 313 NW Martin Luther King Junior Blvd Unit 311 Evansville, IN | 2.0 | 1.0 | 1200 | $950 | $0.79 | 20d | 1 | 1.21mi |
| 1303 E Indiana St Evansville, IN | 2.0 | 1.0 | 975 | $1,195 | $1.23 | 13d | 1 | 1.22mi |
| 1321 E Indiana St Evansville, IN | 2.0 | 1.0 | 964 | $1,050 | $1.09 | 13d | 1 | 1.23mi |
| 200 N Main St Evansville, IN | 2.0 | 1.0–2.0 | 857 | $1,599 | $1.86 | 13d | 7 | 1.24mi |
Listing history 3 events
-
2026-05-01status Pending
-
2026-03-24price $29,900
-
2026-03-10$35,000 Active
ⓘ Source: listings_history table (triggers on properties + properties_extension) + one-shot
backfill from property_details.listing_events for pre-trigger history.
Tax reassessment forecast IN · Partial reset (capped growth)
- Current annual tax
- $908 · $76/mo
- Projected year-2 tax
- $908 · $76/mo
- Expected delta
- $0/yr ($0/mo · 0.0%)
ⓘ Screening estimate from a state-policy table — verify with the county assessor before closing.
Climate risk First Street
- Flood 1/10 Low FEMA zone X (unshaded) · 0% chance over 30 yrs
- Wildfire 1/10 Low
- Heat 5/10 Major 7 d/yr ≥107°F today · 18 d/yr by 30 yrs out
- Wind 2/10 Low 3% chance of damaging wind over 30 yrs
- Air quality 4/10 Moderate 3 unhealthy d/yr today · 5 by 30 yrs out
Nearby sold comps map
Loading sold comps map…
Walkable amenities ~0.75 mi
Loading nearby amenities…
Taxation est. · year 1
- Rental income
- $14,802
- − Mortgage interest
- −$1,675
- − Property taxes
- −$908
- − Insurance
- −$150
- − Repairs & maintenance
- −$1,184
- − Management
- −$1,184
- − Depreciation
- −$870
- Taxable income
- $8,831
- Est. tax owed @ 24.0%
- −$2,120
- After-tax cash flow
- $6,635/yr
For passive investors: Depreciation is non-cash, so a rental often shows a tax loss while cash-flowing — sheltering income. Rental losses are passive: they offset passive income freely, and up to $25,000/yr can offset ordinary (W-2) income if you actively participate and your MAGI is under $100k (phasing out to $0 by $150k); unused losses carry forward. On sale, claimed depreciation is recaptured at up to 25%, and gains may owe capital-gains tax (a 1031 exchange can defer both). Figures are a year-1 estimate at your 24.0% rate — not tax advice; consult a CPA.
Schools (NCES district)
- District
- Evansville Vanderburgh School Corporation
- NCES district ID
- 1803450
- Math proficiency
- 36% ▼ -7.00%
- Reading proficiency
- 43% ▼ -3.00%
- Median HH income
- $43,270
- Composite
- 33.41/100
- National rank
- #5471
- State rank
- #153 of 301 in IN
Livability — Evansville
- Score
- 63/100
- State rank
- #416
- US rank
- #15047
Category grades
Schools grade is shown separately in the Schools card above.
Census & demographics
- Census place
- Evansville, IN
- County
- Vanderburgh County · 146,793 people
- City population
- 146,793
- Metro
- Evansville, IN-KY
- Population (ZIP)
- 9,988
- Household income
- $40,873
- Rent vs Own
- Severe rent burden
- 735.0
Population outlook (Vanderburgh County) Hauer SSP2
- Today (2025)
- 187,038 people
- By 2030
- 188,907 · +1.0%
- By 2040
- 190,272 · +1.7%
- By 2050
- 188,871 · +1.0%
- By 2075
- 180,751 · -3.4%
- By 2100
- 163,015 · -12.8%
Race, ethnicity, and origin ACS 2023
- Neighborhood character
- Diverse neighborhood (Simpson 0.60)
- Race & ethnicity
- White 50% Black 39% Two or more races 7% Hispanic / Latino 3% Pacific Islander 1% Asian 1%
- Common ancestry
- Romanian 2% Lithuanian 1% Italian 1%
- Foreign-born
- 5% · Canada
- Languages at home
- 96% English-only · Spanish 2% Tagalog/Filipino 1% French/Haitian/Cajun 1%
Political lean MEDSL · Vanderburgh
- 2024 margin
- R (+12.7) · D 43.0% · R 55.6% · Other 1.4%
- 2008→2024 swing
- -15.1pp toward R · 2008: 2.5pp · 2024: -12.7pp
- All cycles
- 2024: R+12.7 2020: R+9.6 2016: R+16.9 2012: R+10.8 2008: D+2.5
Not yet ingested
- Civics
- —
Market trends
- HPI YoY
- ▼ -119.22%
- Current HPI
- 229.9312
- Rent YoY
- ▲ 9.87%
- Metro
- Evansville, IN-KY
- State GDP YoY
- ▲ 2.90%
- F500 in state
- 18
Industry mix (Fortune 500 HQ in IN)
| Industry | F500 HQs | Revenue |
|---|---|---|
| Industrial Machinery | 2 | $37B |
|
||
| Healthcare | 1 | $177B |
|
||
| Pharmaceuticals | 1 | $45B |
|
||
| Metals / Steel | 1 | $18B |
|
||
| Agriculture | 1 | $17B |
|
||
| Packaging | 1 | $12B |
|
||
Price history
-14.6% since first listed3 events — show timeline
- 2026-05-01 Pending — IRMLS
- 2026-03-24 Price Changed $29,900 IRMLS
- 2026-03-10 Listed $35,000 IRMLS
Property tax history
-3.9%/yrLatest (2024): $908 · +2.8% YoY. Source: county tax records.
Cash-flow waterfall
monthlySold comps — $/sqft
last 12 mo · ≤1 miLoading sold comps…