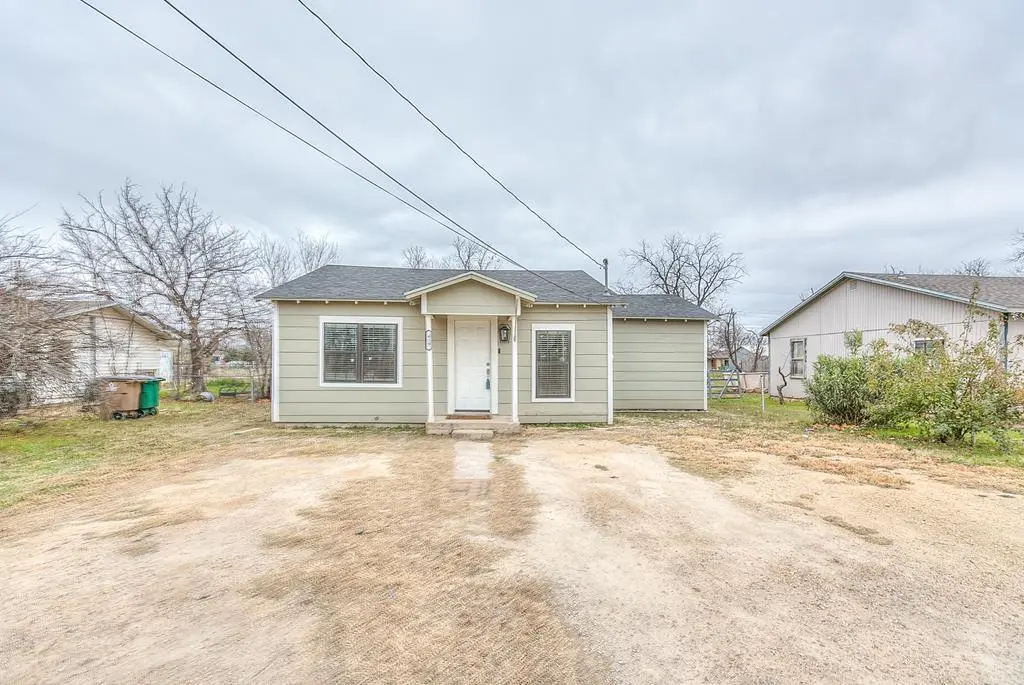
419 E 29th St · San Angelo, TX
Flood risk 4/10 · Minor
- FEMA flood zone
- X (unshaded)
- Chance of flooding over 30 yrs
- 0.22%
- Est. flood insurance / yr
- $507 – $1,088
Fire risk 6/10 · Moderate
- Est. fire insurance / yr
- $1,222 – $2,270
Heat risk 7/10 · Major
- Hot days now (above 104°F)
- 7 days/yr
- Hot days in 30 yrs
- 22 days/yr
Wind risk 4/10 · Minor
- Chance of severe wind over 30 yrs
- 17.0%
Air-quality risk 1/10 · Minimal
- Unhealthy air days now
- 0 days/yr
- Unhealthy air days in 30 yrs
- 0 days/yr
Risk factors via First Street. Map © Google.
Why this score? — see what drove the D grade
The composite is a weighted blend of 9 inputs, each scored 0–100. Each bar is that input's sub-score; the figure is the points it added to the 100-point composite (weight × sub-score).
- ARV discount +15.0/15.0
- Cash flow +9.1/30.0
- Rent growth +4.6/5.0
- Livability +3.7/5.0
- 1% rule +3.6/10.0
- Schools +2.6/10.0
- DSCR +2.5/10.0
- Condition / age +2.5/5.0
- Appreciation +0.0/10.0
$155,000
🖨 Deal sheet (PDF) 📄 Offer letter ✓ Due diligence
Listing remarks MLS
Charming 3-Bed, 2-Bath Home – Perfect for First-Time Buyers! Welcome to your dream starter home! This cozy 3-bedroom, 2-bathroom home offers comfort, style, and functionality in every square foot. This home is ideal for first-time buyers seeking affordability without sacrificing modern conveniences, Step inside to find a bright and inviting living area, The kitchen boasts updated countertop. Outside, you'll love the fully fenced backyard—ideal for pets, gardening, or entertaining. With updated floors, bathrooms, new electrical panel and convenient access to schools, shops, and parks, this home checks all the boxes. $0 down payment and down payment assistance options are available. Do not miss the chance to make this house your home—schedule a tour today!
Key facts
- Updated countertop
- Updated floors
- New electrical panel
Tags
Neighborhood map
What this means for you Summary
Snapshot
- This is a 3-bed/2.0-bath single-family listed at $155k.
Deal economics
- At list price, monthly cash flow is $-120 ($-1k/yr) — negative.
- To cash-flow at today's rent, offer at most $134k (13.7% below list).
- To meet the 1% rule (rent ≥ 1% of price), the offer needs to be $133k (14.4% below list).
- Recommended offer: $133k (14.4% below list) — sets the bar for 1% rule.
- Cap rate 5.4% vs local median 3.8% in San Angelo — top-decile yield for the area; either an underpriced asset or a hidden risk that comps aren't pricing in. Stress-test before assuming the spread holds.
Location & tenants
- Location reads 73/100 on livability (#199 in TX) — a middle-class / working-renter tenant base. Strengths: cost of living A+, housing A+, health & safety A+; Watch: employment C-, amenities F, commute F.
- San Angelo ISD (urban): math 27% / reading 33% proficiency, ranked #627 of 826 in TX (top 76%) — families likely to look elsewhere, expect single-tenant / working-renter base with shorter leases.
- Zoned schools: Bradford El (math 12% / reading 17%, grade F, #4,048 of 4,322 statewide, top 95%, 418 students, 94% FRL); Lincoln Middle (math 19% / reading 23%, grade F, #1,387 of 1,662 statewide, top 85%, 844 students, 78% FRL); Lake View H S (math 6% / reading 22%, grade F, #1,527 of 1,632 statewide, top 94%, 1,085 students, 64% FRL) — zoned schools average 79% FRL vs 53% district-wide (26 pts higher); higher-poverty schools than district average — tighter screening recommended.
- Zoned-school proficiency averages 16% at this address vs 30% district-wide (-14 pts) — the specific schools serving this property underperform the San Angelo ISD average; the district grade overstates school quality for this exact location.
- Market conditions: Rents rising fast (+8.5%/yr); 229 active listings in the ZIP; 14 comparable units currently listed for rent nearby; rentals at typical pace (median 23d on market — plan ~3-4 weeks tenant-placement turnaround); 233 units permitted in Tom Green County in 2024 (0 in 5+ unit buildings).
- This rent runs 32% of the median local income ($49k/yr) — at the standard rent-burdened threshold; future hikes will face affordability resistance.
Forward outlook
- Local home prices are declining (-3.0%/yr); year-one equity from $1k of loan paydown is wiped out by about $5k of value loss. Plan a longer hold.
- Tom Green County population projected at +35% by 2050 — long-run rental-demand tailwind backs the buy-and-hold thesis.
Negotiation context
- It's been on market 139 days — a 12% lower offer ($136k) is reasonable based on typical stale-listing flexibility.
- 6 sale attempts since 15y ago with the ask held roughly flat each time — persistent listings suggest the price (not the market) is what's stuck; bring a comps-based counter.
Risks & watch-outs
- Watch-outs: built in 1950 — expect roof / HVAC / electrical / plumbing capex.
- Climate carrying-cost: major wildfire risk; extreme-heat days projected 7→22/yr by 2055 (HVAC capex compounding) — expect insurance premiums to compound above CPI over the hold.
Questions for the listing agent
- What do current leases actually rent for vs. the listed asking? Can we see a recent rent roll and the last 12 months of T-12 income?
- It's been on market 139 days. Have you received any prior offers? Is the seller open to a 14% concession, seller financing, or rate buy-down credit?
- Built in 1950 — when were the roof, HVAC, electrical panel, plumbing, and water heater last replaced?
- Why hasn't it sold? Are there any deal-killer items the seller is aware of (foundation, flood, title, zoning, code violations)?
- Is there a deadline driving the sale (1031 exchange, divorce, estate, relocation)? That informs how much negotiation room exists.
- Schools are F-rated, which usually means shorter tenancies and higher turnover. Who's the typical renter profile here, and what's been the actual vacancy rate?
- The area grade is low — what's the realistic commute time and amenity access for the typical tenant pool here? Any planned neighborhood developments (good or bad) we should know about?
- What's the average days-on-market for RENTAL listings here right now (not sales)? A rising rental-DOM trend means longer vacancies and softer asking-rent achievability than the comps imply.
- What's the recent tenant-quality profile in this submarket — average credit score on applications, eviction rate, late-payment / NSF rate, and stable-employment percentage? A property-management company in the area should have these aggregated.
- How much new for-sale + rental construction is in the pipeline within 1–3 miles? Heavy new supply typically softens prices + rents 12–24 months out; constrained supply supports both.
Investment metrics
- 1% rule
- 0.86% ✗
- Cap rate
- 5.36%
- Cash-on-cash
- -3.33%
- DSCR
- 0.85
- GRM
- 9.7
CMA / ARV
- ARV (median comp)
- $199,617
- List price
- $155,000
- Delta
- -22.35%
- Verdict
- UNDERPRICED
- Comps
- 20 within 1.0 mi
Show comp detail 12 sales within ~0.75 mi
| Address | Dist | Beds/Ba | Sqft | Sold | Price | $/sf | Match |
|---|---|---|---|---|---|---|---|
| 425 E 29th St | 0.01mi | 2/1.0 (-1) | 1,056 (+5%) | 9mo | $40,000 | $38 | 75 |
| 319 E 24th St | 0.39mi | 3/1.0 | 1,036 (+3%) | 7mo | $123,000 | $119 | 68 |
| 310 E 38th St | 0.54mi | 2/1.0 (-1) | 996 (-1%) | 1mo | $150,000 | $151 | 63 |
| 258 E 23rd St | 0.40mi | 3/2.0 | 1,138 (+13%) | 0mo | $180,000 | $158 | 60 |
| 250 E 23rd St | 0.39mi | 3/2.0 | 1,138 (+13%) | 3mo | $180,000 | $158 | 58 |
| 610 E 24th St | 0.56mi | 2/2.0 (-1) | 1,045 (+4%) | 6mo | $145,000 | $139 | 58 |
| 266 E 23rd St | 0.41mi | 3/2.0 | 1,138 (+13%) | 2mo | $180,000 | $158 | 57 |
| 302 E 38th St | 0.55mi | 2/1.0 (-1) | 996 (-1%) | 9mo | $165,000 | $166 | 56 |
| 67 37th St | 0.58mi | 2/3.0 (-1) | 1,048 (+4%) | 2mo | $139,900 | $133 | 55 |
| 15 E 24th St | 0.55mi | 2/1.5 (-1) | 945 (-6%) | 8mo | $130,000 | $138 | 50 |
| 529 E 23rd St | 0.58mi | 2/1.0 (-1) | 925 (-8%) | 7mo | $141,500 | $153 | 44 |
| 59 W 34th St | 0.69mi | 2/2.0 (-1) | 1,120 (+11%) | 2mo | $175,000 | $156 | 43 |
Match score weights: distance 35% · size 25% · config 20% · recency 20%. Top-matched comps best support the ARV.
Projected returns pro-forma
-3.0% appreciation · 8.0% rent growth · sell at horizon
- IRR
- -15.9%
- Equity multiple
- 0.41×
- Total profit
- $-25,694
- Equity at exit
- $23,111
- IRR
- -0.0%
- Equity multiple
- 1.00×
- Total profit
- $-20
- Equity at exit
- $13,402
Cash invested: $43,400 (down + closing). Projections, not guarantees.
Landlord ↔ Tenant lean methodology
- Overall (STATE)
- 87 Strongly Landlord-Friendly
- State Texas
- 87 Strongly Landlord-Friendly · R+5
- County
- — inherits STATE
- City
- — inherits STATE
ZIP-level market 76903
- Rents YoY
- 8.5%
- Active inventory
- 229
- Price-to-rent
- 9.7×
Monthly cashflow live
- Estimated rent
- $1,326 high interval (Pro) →
- Mortgage (P&I)
- −$813
- Tax from tax record
- −$291 /mo · $3,489/yr
- Insurance
- −$65
- HOA
- −$0
- Vacancy / Maint / Mgmt
- −$279
- Net cashflow
- $-120
Break-even live
Sensitivity live
| Price | -10% $-33 | -5% $-77 | +0% $-120 | +5% $-164 | +10% $-208 |
|---|---|---|---|---|---|
| Rent | -10% $-225 | -5% $-173 | +0% $-120 | +5% $-68 | +10% $-16 |
| Rate | -1.0pp $-42 | -0.5pp $-81 | base $-120 | +0.5pp $-161 | +1.0pp $-201 |
UW: 25.0% down · 7.5% · 30yr · 1.5% tax · 5.0% vac · 8.0% maint · 8.0% mgmt
Financing live
Cash to close
- Down payment
- $38,750
- Closing costs
- $4,650
- Reserves months
- —
- Total cash needed
- —
Loan-product check · same deal, 3 products live
Conventional
25% down · 7.5% · 30yr
- Down + closing
- —
- Monthly P&I
- —
- Monthly cashflow
- —
- DSCR
- —
- Eligible?
- —
Personal DTI + credit; lowest rate.
DSCR
20% down · 8.5% · 30yr
- Down + closing
- —
- Monthly P&I
- —
- Monthly cashflow
- —
- DSCR
- —
- Eligible?
- —
No personal income docs; deal must DSCR.
Hard money
10% down · 12.0% · 12mo
- Down + closing
- —
- Monthly P&I
- —
- Monthly cashflow
- —
- DSCR
- —
- Eligible?
- —
Short-term bridge; refi at stabilization.
Rent comps 14 comps
| Address | Beds | Baths | Sqft | Rent | $/sqft | DOM | Units | Dist |
|---|---|---|---|---|---|---|---|---|
| 3212 Orchard Dr San Angelo, TX | 4.0 | 1.0 | 1216 | $1,445 | $1.19 | 45d | 1 | 0.34mi |
| 2417 Oaklawn Blvd San Angelo, TX | 2.0 | 2.0 | 897 | $1,550 | $1.73 | 45d | 1 | 0.35mi |
| 510 E 28th St San Angelo, TX | 3.0 | 1.5 | 924 | $1,102 | $1.19 | 23d | 1 | 0.37mi |
| 2917 JFK Dr San Angelo, TX | 3.0 | 1.5 | 924 | $1,102 | $1.19 | 23d | 1 | 0.40mi |
| 2921 JFK Dr San Angelo, TX | 3.0 | 1.5 | 924 | $1,102 | $1.19 | 23d | 1 | 0.40mi |
| 939 LBJ Dr San Angelo, TX | 3.0 | 1.5 | 924 | $1,102 | $1.19 | 23d | 1 | 0.42mi |
| 940 LBJ Dr San Angelo, TX | 3.0 | 1.5 | 924 | $1,102 | $1.19 | 23d | 1 | 0.43mi |
| 312 E 23rd St San Angelo, TX | 3.0 | 1.0 | 1148 | $1,400 | $1.22 | 45d | 1 | 0.43mi |
| 3302 N Bryant Blvd San Angelo, TX | 3.0 | 1.0 | 559 | $975 | $1.74 | 23d | 1 | 1.23mi |
| 134 E 11th St San Angelo, TX | 3.0 | 2.0 | 872 | $1,025 | $1.18 | 45d | 1 | 1.30mi |
| 540 W 16th St San Angelo, TX | 3.0 | 2.0 | 1090 | $1,364 | $1.25 | 45d | 1 | 1.30mi |
| 810 W 19th St San Angelo, TX | 3.0 | 2.0 | 1090 | $1,249 | $1.15 | 23d | 1 | 1.36mi |
| 706 W 16th St San Angelo, TX | 3.0 | 2.0 | 1298 | $1,590 | $1.22 | 23d | 1 | 1.41mi |
| 2308 Carley St San Angelo, TX | 3.0 | 1.5 | 985 | $1,102 | $1.12 | 23d | 1 | 1.43mi |
Listing history 16 events
-
2026-05-31days on market $155,000 Active 139 DOM
-
2026-05-30days on market $155,000 Active 138 DOM
-
2026-01-12$155,000 Active 782-char remark
Show marketing remark (782 chars)
Charming 3-Bed, 2-Bath Home – Perfect for First-Time Buyers! Welcome to your dream starter home! This cozy 3-bedroom, 2-bathroom home offers comfort, style, and functionality in every square foot. This home is ideal for first-time buyers seeking affordability without sacrificing modern conveniences, Step inside to find a bright and inviting living area, The kitchen boasts updated countertop. Outside, you'll love the fully fenced backyard—ideal for pets, gardening, or entertaining. With updated floors, bathrooms, new electrical panel and convenient access to schools, shops, and parks, this home checks all the boxes. $0 down payment and down payment assistance options are available. Do not miss the chance to make this house your home—schedule a tour today!
-
2025-07-09$155,000 Active
-
2025-04-22price $155,000
-
2025-04-15$157,000 Active
-
2025-03-24price $157,000
-
2025-01-29$159,000 Active
-
2021-10-01soldstatus
-
2021-09-30soldstatus
-
2021-08-31$119,000
-
2021-04-16soldstatus
-
2013-06-28soldstatus
-
2011-03-23soldstatus
-
2011-02-16$21,300
-
2007-04-02soldstatus
ⓘ Source: listings_history table (triggers on properties + properties_extension) + one-shot
backfill from property_details.listing_events for pre-trigger history.
Tax reassessment forecast TX · Resets to sale price
- Current annual tax
- $3,489 · $291/mo
- Projected year-2 tax
- $3,489 · $291/mo
- Expected delta
- $0/yr ($0/mo · 0.0%)
ⓘ Screening estimate from a state-policy table — verify with the county assessor before closing.
Climate risk First Street
- Flood 4/10 Moderate FEMA zone X (unshaded) · 22% chance over 30 yrs
- Wildfire 6/10 Major
- Heat 7/10 Severe 7 d/yr ≥104°F today · 22 d/yr by 30 yrs out
- Wind 4/10 Moderate 17% chance of damaging wind over 30 yrs
- Air quality 1/10 Low 0 unhealthy d/yr today · 0 by 30 yrs out
Nearby sold comps map
Loading sold comps map…
Walkable amenities ~0.75 mi
Loading nearby amenities…
Taxation est. · year 1
- Rental income
- $15,916
- − Mortgage interest
- −$8,682
- − Property taxes
- −$3,489
- − Insurance
- −$775
- − Repairs & maintenance
- −$1,273
- − Management
- −$1,273
- − Depreciation
- −$4,509
- Taxable loss
- −$4,086
- Est. tax savings @ 24.0%
- +$981
- After-tax cash flow
- $-464/yr
For passive investors: Depreciation is non-cash, so a rental often shows a tax loss while cash-flowing — sheltering income. Rental losses are passive: they offset passive income freely, and up to $25,000/yr can offset ordinary (W-2) income if you actively participate and your MAGI is under $100k (phasing out to $0 by $150k); unused losses carry forward. On sale, claimed depreciation is recaptured at up to 25%, and gains may owe capital-gains tax (a 1031 exchange can defer both). Figures are a year-1 estimate at your 24.0% rate — not tax advice; consult a CPA.
Schools (NCES district)
- District
- San Angelo ISD
- NCES district ID
- 4838700
- Math proficiency
- 27% ▼ -9.00%
- Reading proficiency
- 33% ▼ -3.00%
- Median HH income
- $43,501
- Composite
- 25.56/100
- National rank
- #7427
- State rank
- #627 of 826 in TX
Livability — San Angelo
- Score
- 73/100
- State rank
- #199
- US rank
- #5030
Category grades
Schools grade is shown separately in the Schools card above.
Census & demographics
- Census place
- San Angelo, TX
- County
- Tom Green County · 113,188 people
- City population
- 81,357
- Metro
- San Angelo, TX
- Population (ZIP)
- 29,947
- Household income
- $49,498
- Rent vs Own
- Severe rent burden
- 1255.0
Population outlook (Tom Green County) Hauer SSP2
- Today (2025)
- 135,110 people
- By 2030
- 144,090 · +6.6%
- By 2040
- 162,561 · +20.3%
- By 2050
- 182,158 · +34.8%
- By 2075
- 232,274 · +71.9%
- By 2100
- 268,218 · +98.5%
Race, ethnicity, and origin ACS 2023
- Neighborhood character
- Diverse neighborhood (Simpson 0.56)
- Race & ethnicity
- Hispanic / Latino 56% White 36% Two or more races 26% Black 5%
- Hispanic origin (detail)
- Mexican 49% Puerto Rican 1%
- Common ancestry
- Italian 1% Serbian 1% Slovak 1%
- Foreign-born
- 10% · Canada
- Languages at home
- 66% English-only · Spanish 33%
Political lean MEDSL · Tom Green
- 2024 margin
- Solid R (+48.0) · D 25.5% · R 73.5% · Other 1.0%
- 2008→2024 swing
- -6.3pp toward R · 2008: -41.7pp · 2024: -48.0pp
- All cycles
- 2024: R+48.0 2020: R+44.4 2016: R+47.9 2012: R+47.9 2008: R+41.7
Not yet ingested
- Civics
- —
Market trends
- HPI YoY
- ▼ -164.90%
- Current HPI
- 217.0406
- Rent YoY
- ▲ 8.46%
- Metro
- San Angelo, TX
- State GDP YoY
- ▲ 3.95%
- F500 in state
- 110
Industry mix (Fortune 500 HQ in TX)
| Industry | F500 HQs | Revenue |
|---|---|---|
| Energy | 16 | $1,198B |
|
||
| Technology | 5 | $198B |
|
||
| Engineering / Construction | 4 | $72B |
|
||
| Energy Services | 3 | $60B |
|
||
| Utilities | 3 | $41B |
|
||
| Healthcare | 2 | $330B |
|
||
Price history
+627.7% since first listed14 events — show timeline
- 2026-01-12 Listed $155,000 SAAR TX
- 2025-07-09 Listed $155,000 SAAR TX
- 2025-04-22 Price Changed $155,000 SAAR TX
- 2025-04-15 Listed $157,000 SAAR TX
- 2025-03-24 Price Changed $157,000 SAAR TX
- 2025-01-29 Listed $159,000 SAAR TX
- 2021-10-01 Sold (Public Records) — Public Records
- 2021-09-30 Sold (MLS) — SAAR TX
- 2021-08-31 Listed $119,000 SAAR TX
- 2021-04-16 Sold (Public Records) — Public Records
- 2013-06-28 Sold (Public Records) — Public Records
- 2011-03-23 Sold (MLS) — SAAR TX
- 2011-02-16 Listed $21,300 SAAR TX
- 2007-04-02 Sold (Public Records) — Public Records
Property tax history
+15.4%/yrLatest (2025): $3,489 · +17.0% YoY. Source: county tax records.
Cash-flow waterfall
monthlySold comps — $/sqft
last 12 mo · ≤1 miLoading sold comps…