423 E Hazelcroft Ave · New Castle, PA
Flood risk 1/10 · Minimal
- FEMA flood zone
- X (unshaded)
- Chance of flooding over 30 yrs
- 0.0%
- Est. flood insurance / yr
- $473 – $860
Fire risk 1/10 · Minimal
- Est. fire insurance / yr
- $511 – $949
Heat risk 3/10 · Minor
- Hot days now (above 96°F)
- 7 days/yr
- Hot days in 30 yrs
- 18 days/yr
Wind risk 1/10 · Minimal
- Chance of severe wind over 30 yrs
- —
Air-quality risk 2/10 · Minimal
- Unhealthy air days now
- 1 days/yr
- Unhealthy air days in 30 yrs
- 3 days/yr
Risk factors via First Street. Map © Google.
Why this score? — see what drove the C- grade
The composite is a weighted blend of 9 inputs, each scored 0–100. Each bar is that input's sub-score; the figure is the points it added to the 100-point composite (weight × sub-score).
- Cash flow +18.0/30.0
- ARV discount +11.7/15.0
- DSCR +5.7/10.0
- 1% rule +5.4/10.0
- Livability +4.1/5.0
- Rent growth +2.5/5.0
- Condition / age +2.5/5.0
- Schools +1.1/10.0
- Appreciation +0.0/10.0
$129,900
🖨 Deal sheet 📄 Offer letter ✓ Due diligence
Listing remarks MLS
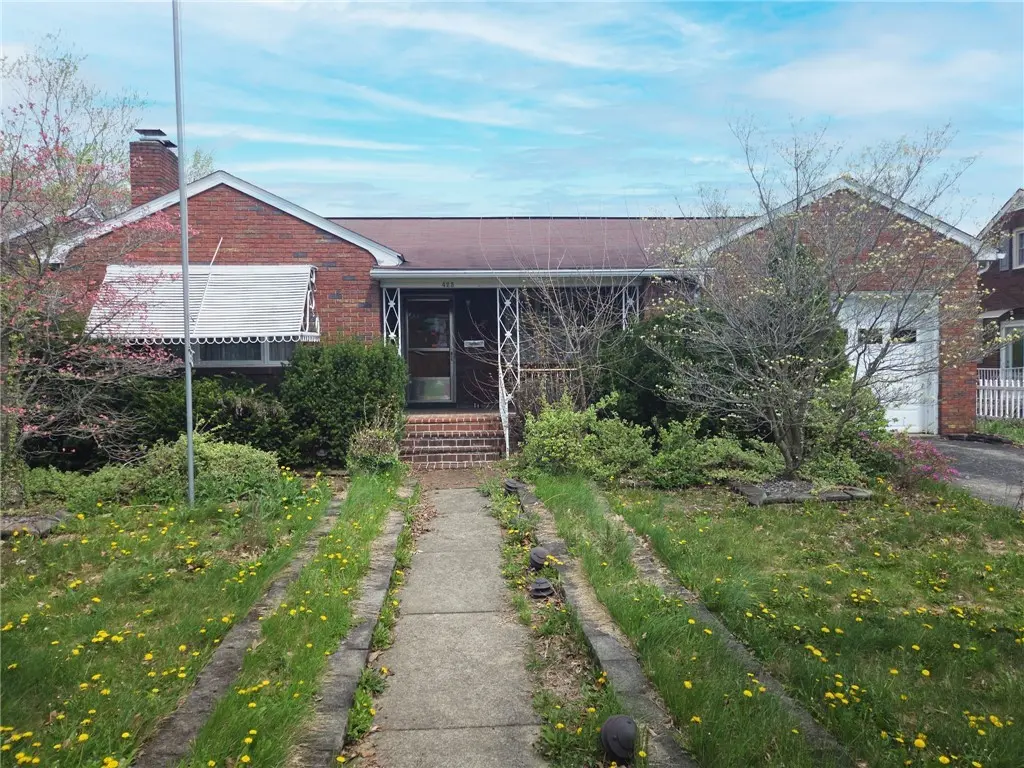
Welcome to 423 E Hazelcroft Ave in New Castle—a charming and well-maintained 2-bedroom, 1-bath home that offers comfort, convenience, and great curb appeal. From the moment you arrive, you’ll appreciate the inviting covered front porch, perfect for relaxing with your morning coffee or unwinding in the evening. Inside, the home features a functional layout with cozy living spaces, ideal for both everyday living and entertaining. The two bedrooms provide comfortable accommodations, while the full bathroom is conveniently located and easy to access. Step outside to enjoy the level yard—perfect for outdoor gatherings, gardening, or simply enjoying the open space. A one-car garage adds extra convenience for parking and storage. Whether you’re a first-time buyer, downsizing, or looking for an investment opportunity, this property offers a great combination of value and livability in a convenient New Castle location. Don’t miss your chance to make this house your home!
Key facts
- Covered front porch
- Level yard
- One-car garage
Tags
Neighborhood map
What this means for you Summary
Snapshot
- This is a 2-bed/1.0-bath single-family listed at $130k.
Deal economics
- At list price, monthly cash flow is $112 ($1k/yr) — positive.
- The deal already cash-flows at list — no discount required.
- Meets the 1% rule at list price ($1k rent vs $130k).
- Recommended offer: $122k (6.0% below list) — sets the bar for market timing.
Location & tenants
- Location reads 82/100 on livability (#137 in PA, #1,120 nationally) — a professional / high-income tenant draw. Strengths: crime A+, commute A+, cost of living A+; Watch: amenities F, employment F.
- New Castle Area SD (town): math 9% / reading 19% proficiency, ranked #519 of 539 in PA (top 96%) — low school quality limits family demand, transient renter base, plan for 1-2y turnover; 66% free/reduced lunch — lower-income household profile, screen leases tightly.
- Market conditions: 105 active listings in the ZIP; 51 units permitted in Lawrence County in 2024 (0 in 5+ unit buildings).
Forward outlook
- Local home prices are declining (-3.0%/yr); year-one equity from $898 of loan paydown is wiped out by about $4k of value loss. Plan a longer hold.
- Lawrence County population projected at -25% by 2050 — secular population decline; favor cash flow + early exit over multi-decade hold.
Negotiation context
- It's been on market 64 days — a 6% lower offer ($122k) is reasonable based on typical stale-listing flexibility.
- 2 sale attempts since 29y ago with the ask held roughly flat each time — persistent listings suggest the price (not the market) is what's stuck; bring a comps-based counter.
- Current owner paid $64k; list at $130k implies a 104% gain — meaningful room to come down on a strong offer.
Risks & watch-outs
- Watch-outs: built in 1955 — expect roof / HVAC / electrical / plumbing capex.
Questions for the listing agent
- It's been on market 64 days. Have you received any prior offers? Is the seller open to a 6% concession, seller financing, or rate buy-down credit?
- Built in 1955 — when were the roof, HVAC, electrical panel, plumbing, and water heater last replaced?
- Why hasn't it sold? Are there any deal-killer items the seller is aware of (foundation, flood, title, zoning, code violations)?
- Is there a deadline driving the sale (1031 exchange, divorce, estate, relocation)? That informs how much negotiation room exists.
- What's the average days-on-market for RENTAL listings here right now (not sales)? A rising rental-DOM trend means longer vacancies and softer asking-rent achievability than the comps imply.
- What's the recent tenant-quality profile in this submarket — average credit score on applications, eviction rate, late-payment / NSF rate, and stable-employment percentage? A property-management company in the area should have these aggregated.
- How much new for-sale + rental construction is in the pipeline within 1–3 miles? Heavy new supply typically softens prices + rents 12–24 months out; constrained supply supports both.
Investment metrics
- 1% rule
- 1.04% ✓
- Cap rate
- 7.33%
- Cash-on-cash
- 3.71%
- DSCR
- 1.17
- GRM
- 8.0
CMA / ARV
- ARV (median comp)
- $143,250
- List price
- $129,900
- Delta
- -9.32%
- Verdict
- FAIR
- Comps
- 20 within 1.0 mi
Show comp detail 12 sales within ~0.75 mi
| Address | Dist | Beds/Ba | Sqft | Sold | Price | $/sf | Match |
|---|---|---|---|---|---|---|---|
| 603 E Edgewood Ave | 0.16mi | 3/1.5 (+1) | 1,120 (-2%) | 6mo | $186,000 | $166 | 76 |
| 318 E Elizabeth St | 0.33mi | 3/1.0 (+1) | 1,158 (+1%) | 19mo | $45,000 | $39 | 62 |
| 211 E Northview Ave | 0.42mi | 2/1.5 | 1,244 (+8%) | 6mo | $110,000 | $88 | 60 |
| 2421 Graceland Rd | 0.59mi | 3/2.0 (+1) | 1,160 (+1%) | 2mo | $222,500 | $192 | 60 |
| 11 Manor Ave | 0.70mi | 3/1.0 (+1) | 1,149 (+0%) | 8mo | $220,000 | $191 | 56 |
| 212 E Meyer Ave | 0.40mi | 2/2.5 | 1,316 (+15%) | 0mo | $138,000 | $105 | 51 |
| 1806 Graceland Rd | 0.65mi | 3/2.0 (+1) | 1,176 (+2%) | 10mo | $118,000 | $100 | 48 |
| 220 E Edgewood Ave | 0.35mi | 3/1.0 (+1) | 1,316 (+15%) | 16mo | $109,900 | $84 | 41 |
| 132 E Hillcrest Ave | 0.59mi | 3/1.0 (+1) | 1,248 (+9%) | 15mo | $145,000 | $116 | 41 |
| 2804 Mercer Rd | 0.53mi | 3/1.0 (+1) | 1,241 (+8%) | 20mo | $139,500 | $112 | 40 |
| 1710 Audley Ave | 0.51mi | 2/1.0 | 1,000 (-13%) | 23mo | $111,500 | $112 | 36 |
| 210 E Hillcrest Ave | 0.54mi | 3/2.5 (+1) | 1,280 (+12%) | 21mo | $139,000 | $109 | 27 |
Match score weights: distance 35% · size 25% · config 20% · recency 20%. Top-matched comps best support the ARV.
Projected returns pro-forma
-3.0% appreciation · 3.0% rent growth · sell at horizon
- IRR
- -10.4%
- Equity multiple
- 0.62×
- Total profit
- $-13,832
- Equity at exit
- $19,369
- IRR
- -1.0%
- Equity multiple
- 0.93×
- Total profit
- $-2,599
- Equity at exit
- $11,231
Cash invested: $36,372 (down + closing). Projections, not guarantees.
Landlord ↔ Tenant lean methodology
- Overall (STATE)
- 62 Landlord-Friendly
- State Pennsylvania
- 62 Landlord-Friendly · EVEN
- County
- — inherits STATE
- City
- — inherits STATE
ZIP-level market 16105
- Home prices YoY
- -26.5%
- Active inventory
- 105
- Price-to-rent
- 8.0×
Monthly cashflow live
- Estimated rent
- $1,350 medium interval (Pro) →
- Mortgage (P&I)
- −$681
- Tax from tax record
- −$219 /mo · $2,626/yr
- Insurance
- −$54
- HOA
- −$0
- Vacancy / Maint / Mgmt
- −$284
- Net cashflow
- $112
Break-even live
UW: 25.0% down · 7.5% · 30yr · 1.5% tax · 5.0% vac · 8.0% maint · 8.0% mgmt
Financing live
Cash to close
- Down payment
- $32,475
- Closing costs
- $3,897
- Reserves months
- —
- Total cash needed
- —
Loan-product check · same deal, 3 products live
Conventional
25% down · 7.5% · 30yr
- Down + closing
- —
- Monthly P&I
- —
- Monthly cashflow
- —
- DSCR
- —
- Eligible?
- —
Personal DTI + credit; lowest rate.
DSCR
20% down · 8.5% · 30yr
- Down + closing
- —
- Monthly P&I
- —
- Monthly cashflow
- —
- DSCR
- —
- Eligible?
- —
No personal income docs; deal must DSCR.
Hard money
10% down · 12.0% · 12mo
- Down + closing
- —
- Monthly P&I
- —
- Monthly cashflow
- —
- DSCR
- —
- Eligible?
- —
Short-term bridge; refi at stabilization.
Listing history 19 events
-
2026-06-19days on market $129,900 Active 64 DOM
-
2026-06-18days on market $129,900 Active 63 DOM
-
2026-06-17days on market $129,900 Active 62 DOM
-
2026-06-16days on market $129,900 Active 61 DOM
-
2026-06-15days on market $129,900 Active 60 DOM
-
2026-06-14days on market $129,900 Active 58 DOM
-
2026-06-12days on market $129,900 Active 57 DOM
-
2026-06-09days on market $129,900 Active 54 DOM
-
2026-06-08days on market $129,900 Active 53 DOM
-
2026-06-07days on market $129,900 Active 52 DOM
-
2026-06-03days on market $129,900 Active 48 DOM
-
2026-06-02days on market $129,900 Active 47 DOM
-
2026-06-01days on market $129,900 Active 46 DOM
-
2026-05-31days on market $129,900 Active 45 DOM
-
2026-05-30days on market $129,900 Active 44 DOM
-
2026-04-15$129,900 Active 1006-char remark
Show marketing remark (1006 chars)
Welcome to 423 E Hazelcroft Ave in New Castle—a charming and well-maintained 2-bedroom, 1-bath home that offers comfort, convenience, and great curb appeal. From the moment you arrive, you’ll appreciate the inviting covered front porch, perfect for relaxing with your morning coffee or unwinding in the evening. Inside, the home features a functional layout with cozy living spaces, ideal for both everyday living and entertaining. The two bedrooms provide comfortable accommodations, while the full bathroom is conveniently located and easy to access. Step outside to enjoy the level yard—perfect for outdoor gatherings, gardening, or simply enjoying the open space. A one-car garage adds extra convenience for parking and storage. Whether you’re a first-time buyer, downsizing, or looking for an investment opportunity, this property offers a great combination of value and livability in a convenient New Castle location. Don’t miss your chance to make this house your home!
-
1997-05-23soldstatus $63,750 105-char remark
Show marketing remark (105 chars)
OUTSTANDING! QUALITY THROUGHOUT! EXCEPTIONALLY WELL MAINTAINED. NEWER ROOF. FP FULL BASEMENT. VERY CLEAN
-
1997-05-15soldstatus $63,750
-
1997-03-31$67,500 105-char remark
Show marketing remark (105 chars)
OUTSTANDING! QUALITY THROUGHOUT! EXCEPTIONALLY WELL MAINTAINED. NEWER ROOF. FP FULL BASEMENT. VERY CLEAN
ⓘ Source: listings_history table (triggers on properties + properties_extension) + one-shot
backfill from property_details.listing_events for pre-trigger history.
Tax reassessment forecast PA · Partial reset (capped growth)
- Current annual tax
- $2,626 · $219/mo
- Projected year-2 tax
- $2,626 · $219/mo
- Expected delta
- $0/yr ($0/mo · 0.0%)
ⓘ Screening estimate from a state-policy table — verify with the county assessor before closing.
Climate risk First Street
- Flood 1/10 Low FEMA zone X (unshaded) · 0% chance over 30 yrs
- Wildfire 1/10 Low
- Heat 3/10 Moderate 7 d/yr ≥96°F today · 18 d/yr by 30 yrs out
- Wind 1/10 Low
- Air quality 2/10 Low 1 unhealthy d/yr today · 3 by 30 yrs out
Nearby sold comps map
Loading sold comps map…
Walkable amenities ~0.75 mi
Loading nearby amenities…
Taxation est. · year 1
- Rental income
- $16,201
- − Mortgage interest
- −$7,276
- − Property taxes
- −$2,626
- − Insurance
- −$650
- − Repairs & maintenance
- −$1,296
- − Management
- −$1,296
- − Depreciation
- −$3,779
- Taxable loss
- −$721
- Est. tax savings @ 24.0%
- +$173
- After-tax cash flow
- $1,523/yr
For passive investors: Depreciation is non-cash, so a rental often shows a tax loss while cash-flowing — sheltering income. Rental losses are passive: they offset passive income freely, and up to $25,000/yr can offset ordinary (W-2) income if you actively participate and your MAGI is under $100k (phasing out to $0 by $150k); unused losses carry forward. On sale, claimed depreciation is recaptured at up to 25%, and gains may owe capital-gains tax (a 1031 exchange can defer both). Figures are a year-1 estimate at your 24.0% rate — not tax advice; consult a CPA.
Schools (NCES district)
- District
- New Castle Area SD
- NCES district ID
- 4216620
- Math proficiency
- 9% ▼ -13.00%
- Reading proficiency
- 19% ▼ -23.00%
- Median HH income
- $30,967
- Composite
- 11.08/100
- National rank
- #9736
- State rank
- #519 of 539 in PA
Livability — New Castle
- Score
- 82/100
- State rank
- #137
- US rank
- #1120
Category grades
Schools grade is shown separately in the Schools card above.
Census & demographics
- Census place
- New Castle, PA
- City population
- 30,767
- Population (ZIP)
- 15,195
Population outlook (Lawrence County) Hauer SSP2
- Today (2025)
- 81,781 people
- By 2030
- 77,978 · -4.7%
- By 2040
- 69,522 · -15.0%
- By 2050
- 61,344 · -25.0%
- By 2075
- 45,027 · -44.9%
- By 2100
- 31,305 · -61.7%
Race, ethnicity, and origin ACS 2023
- Neighborhood character
- Predominantly White (93%)
- Race & ethnicity
- White 93% Black 3% Hispanic / Latino 2% Two or more races 1%
- Common ancestry
- Romanian 9% Serbian 3% Lithuanian 3%
- Foreign-born
- 2% · Canada
- Languages at home
- 96% English-only · Other Indo-European 1% Spanish 1% German/W. Germanic 1%
Political lean MEDSL · Lawrence
- 2024 margin
- Solid R (+33.8) · D 32.8% · R 66.5%
- 2008→2024 swing
- -28.7pp toward R · 2008: -5.1pp · 2024: -33.8pp
- All cycles
- 2024: R+33.8 2020: R+29.6 2016: R+28.1 2012: R+9.0 2008: R+5.1
Not yet ingested
- Civics
- —
Market trends
- HPI YoY
- ▼ -62.26%
- Current HPI
- 173.0332
- Rent YoY
- —
- Metro
- —
- State GDP YoY
- ▲ 1.68%
- F500 in state
- 34
Industry mix (Fortune 500 HQ in PA)
| Industry | F500 HQs | Revenue |
|---|---|---|
| Healthcare | 2 | $309B |
|
||
| Insurance | 2 | $27B |
|
||
| Telecommunications / Media | 1 | $124B |
|
||
| Industrial Distribution | 1 | $22B |
|
||
| Financial Services | 1 | $20B |
|
||
| Chemicals / Materials | 1 | $18B |
|
||
Price history
+92.4% since first listed4 events — show timeline
- 2026-04-15 Listed $129,900 West Penn MLS
- 1997-05-23 Sold (MLS) $63,750 West Penn MLS
- 1997-05-15 Sold (Public Records) $63,750 Public Records
- 1997-03-31 Listed $67,500 West Penn MLS
Property tax history
+1.3%/yrLatest (2025): $2,626 · -0.5% YoY. Source: county tax records.
Cash-flow waterfall
monthlySold comps — $/sqft
last 12 mo · ≤1 miLoading sold comps…