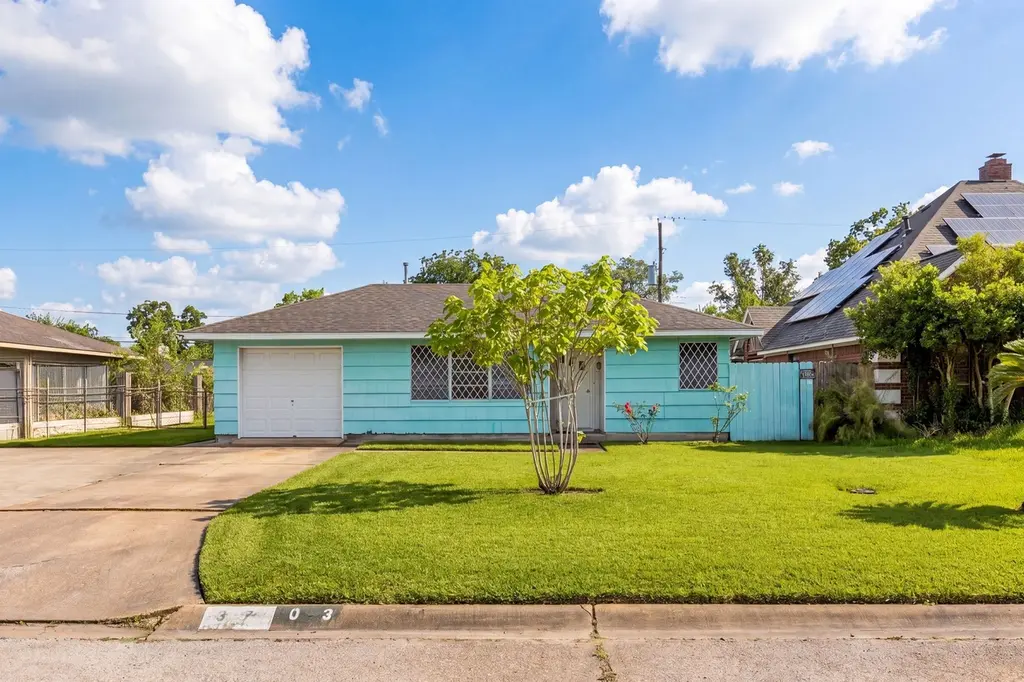
3703 Tanglebriar Dr · Pasadena, TX
Flood risk 1/10 · Minimal
- FEMA flood zone
- X (unshaded)
- Chance of flooding over 30 yrs
- 0.0%
- Est. flood insurance / yr
- $507 – $1,088
Fire risk 1/10 · Minimal
- Est. fire insurance / yr
- $1,222 – $2,270
Heat risk 9/10 · Severe
- Hot days now (above 109°F)
- 7 days/yr
- Hot days in 30 yrs
- 24 days/yr
Wind risk 9/10 · Severe
- Chance of severe wind over 30 yrs
- 99.0%
Air-quality risk 2/10 · Minimal
- Unhealthy air days now
- 2 days/yr
- Unhealthy air days in 30 yrs
- 2 days/yr
Risk factors via First Street. Map © Google.
Why this score? — see what drove the F grade
The composite is a weighted blend of 9 inputs, each scored 0–100. Each bar is that input's sub-score; the figure is the points it added to the 100-point composite (weight × sub-score).
- ARV discount +11.4/15.0
- Cash flow +5.5/30.0
- Livability +3.3/5.0
- Schools +2.6/10.0
- Condition / age +2.5/5.0
- 1% rule +1.8/10.0
- Rent growth +0.1/5.0
- DSCR +0.0/10.0
- Appreciation +0.0/10.0
$215,000
🖨 Deal sheet (PDF) 📄 Offer letter ✓ Due diligence
Listing remarks
Discover a Pasadena opportunity that combines comfort, convenience, and value! This inviting home offers a great location with easy access to nearby shopping, dining, entertainment, and everyday necessities. Thoughtful updates provide added peace of mind, including updated piping, central air, and a newer water heater. The home offers a welcoming canvas ready for your personal touches, whether you’re looking to settle in, create your dream space, or add to your investment portfolio. Enjoy the benefits of an established Pasadena community with convenient access to major roadways and everything the area has to offer. With its blend of location, updates, and potential, this property pres
Key facts
- Easy access
- Updated piping
- Great location
Tags
Property features AI
Exterior
- Parking: Attached garage (1 car); Additional parking
- Utilities: Public water; Public sewer
- Home design: Residential property; Built in 1970; Slab foundation; Composition roof
- Construction: Cement siding
- Exterior features: Subdivision lot
Interior
- Kitchen: Dishwasher; Gas cooktop; Gas oven
- Flooring: Carpet
- Bathrooms: 2 full bathrooms
- Heating & cooling: Central heating (gas); Central electric air conditioning
- Interior features: Tub with shower; Kitchen/dining combo; 7 total rooms
- Laundry & utility: Washer hookup; Gas dryer hookup
Neighborhood map
What this means for you Summary
Snapshot
- This is a 3-bed/1.0-bath single-family listed at $215k.
Deal economics
- At list price, monthly cash flow is $-456 ($-5k/yr) — negative.
- To cash-flow at today's rent, offer at most $134k (37.5% below list).
- To meet the 1% rule (rent ≥ 1% of price), the offer needs to be $147k (31.7% below list).
- Recommended offer: $134k (37.5% below list) — sets the bar for cash-flow.
Location & tenants
- Location reads 66/100 on livability (#600 in TX) — a middle-class / working-renter tenant base. Strengths: cost of living A+, housing A+; Watch: employment D+, crime F, amenities F.
- Pasadena ISD (suburban): math 29% / reading 32% proficiency, ranked #612 of 826 in TX (top 74%) — families likely to look elsewhere, expect single-tenant / working-renter base with shorter leases; 71% free/reduced lunch — lower-income household profile, screen leases tightly.
- Zoned schools: Mcmasters El (math 17% / reading 22%, grade F, #3,583 of 4,322 statewide, top 86%, 363 students, 88% FRL); Keller Middle (math 15% / reading 21%, grade F, #1,491 of 1,662 statewide, top 91%, 657 students, 92% FRL); Pasadena H S (math 41% / reading 31%, grade F, #930 of 1,632 statewide, top 57%, 2,221 students, 90% FRL) — zoned schools average 90% FRL vs 71% district-wide (19 pts higher); higher-poverty schools than district average — tighter screening recommended.
- Market conditions: Rents falling (-9.4%/yr); 82 active listings in the ZIP; 17 comparable units currently listed for rent nearby; rentals at typical pace (median 24d on market — plan ~3-4 weeks tenant-placement turnaround); 29,883 units permitted in Harris County in 2024 (8,621 in 5+ unit buildings).
Forward outlook
- Local home prices are declining (-3.0%/yr); year-one equity from $1k of loan paydown is wiped out by about $6k of value loss. Plan a longer hold.
- Harris County population projected at +47% by 2050 — long-run rental-demand tailwind backs the buy-and-hold thesis.
Negotiation context
- Only 2 days on market — expect competitive offers; lowballing is unlikely to land.
Risks & watch-outs
- Climate carrying-cost: severe wind risk, 99% chance of damaging wind over 30y; extreme-heat days projected 7→24/yr by 2055 (HVAC capex compounding) — expect insurance premiums to compound above CPI over the hold.
Questions for the listing agent
- What do current leases actually rent for vs. the listed asking? Can we see a recent rent roll and the last 12 months of T-12 income?
- Built in 1970 — when were the roof, HVAC, electrical panel, plumbing, and water heater last replaced?
- Is there a deadline driving the sale (1031 exchange, divorce, estate, relocation)? That informs how much negotiation room exists.
- Schools are D-rated, which usually means shorter tenancies and higher turnover. Who's the typical renter profile here, and what's been the actual vacancy rate?
- Crime grade is F in this area — have there been break-ins, vandalism, or insurance claims at this property in the last 3 years? What carrier currently insures it and at what premium?
- The area grade is low — what's the realistic commute time and amenity access for the typical tenant pool here? Any planned neighborhood developments (good or bad) we should know about?
- What's the average days-on-market for RENTAL listings here right now (not sales)? A rising rental-DOM trend means longer vacancies and softer asking-rent achievability than the comps imply.
- What's the recent tenant-quality profile in this submarket — average credit score on applications, eviction rate, late-payment / NSF rate, and stable-employment percentage? A property-management company in the area should have these aggregated.
- How much new for-sale + rental construction is in the pipeline within 1–3 miles? Heavy new supply typically softens prices + rents 12–24 months out; constrained supply supports both.
Investment metrics
- 1% rule
- 0.68% ✗
- Cap rate
- 3.75%
- Cash-on-cash
- -9.09%
- DSCR
- 0.60
- GRM
- 12.2
CMA / ARV
- ARV (on-the-fly)
- $235,638
- Comps found
- 12
Show comp detail 12 sales within ~0.75 mi
| Address | Dist | Beds/Ba | Sqft | Sold | Price | $/sf | Match |
|---|---|---|---|---|---|---|---|
| 3705 Crawford Dr | 0.20mi | 3/1.0 | 1,540 (+4%) | 1mo | $159,900 | $104 | 83 |
| 3803 Karen Ln | 0.33mi | 3/2.0 | 1,472 (-1%) | 3mo | $245,000 | $166 | 76 |
| 4123 Bermuda Dr | 0.52mi | 3/2.0 | 1,481 (-0%) | 3mo | $238,900 | $161 | 69 |
| 1416 Bennett Dr | 0.37mi | 3/1.5 | 1,342 (-9%) | 3mo | $130,000 | $97 | 63 |
| 510 Bennett Dr | 0.54mi | 3/2.0 | 1,556 (+5%) | 1mo | $295,000 | $190 | 62 |
| 3112 Briar Dr | 0.71mi | 3/2.0 | 1,468 (-1%) | 2mo | $220,000 | $150 | 60 |
| 3804 Edgefield Dr | 0.25mi | 3/2.0 | 1,679 (+13%) | 4mo | $240,000 | $143 | 59 |
| 3816 Kaplan Dr | 0.32mi | 4/2.0 (+1) | 1,636 (+10%) | 2mo | $259,900 | $159 | 57 |
| 1210 Glenmore Dr | 0.35mi | 4/2.0 (+1) | 1,348 (-9%) | 3mo | $224,900 | $167 | 57 |
| 3803 Ramsey Dr | 0.36mi | 4/2.0 (+1) | 1,620 (+9%) | 2mo | $210,000 | $130 | 57 |
| 3017 Cedarcrest Dr | 0.72mi | 3/1.0 | 1,395 (-6%) | 0mo | $125,000 | $90 | 56 |
| 4127 Alecia Dr | 0.60mi | 3/2.0 | 1,274 (-14%) | 1mo | $235,000 | $184 | 44 |
Match score weights: distance 35% · size 25% · config 20% · recency 20%. Top-matched comps best support the ARV.
Projected returns pro-forma
-3.0% appreciation · 0.0% rent growth · sell at horizon
- IRR
- -36.2%
- Equity multiple
- -0.13×
- Total profit
- $-68,094
- Equity at exit
- $32,057
- IRR
- -75.8%
- Equity multiple
- -0.88×
- Total profit
- $-112,925
- Equity at exit
- $18,589
Cash invested: $60,200 (down + closing). Projections, not guarantees.
Landlord ↔ Tenant lean methodology
- Overall (STATE)
- 87 Strongly Landlord-Friendly
- State Texas
- 87 Strongly Landlord-Friendly · R+5
- County
- — inherits STATE
- City
- — inherits STATE
ZIP-level market 77503
- Home prices YoY
- -13.7%
- Rents YoY
- -9.4%
- Active inventory
- 82
- Price-to-rent
- 12.2×
Monthly cashflow live
- Estimated rent
- $1,469 high interval (Pro) →
- Mortgage (P&I)
- −$1,127
- Tax from tax record
- −$400 /mo · $4,794/yr
- Insurance
- −$90
- HOA
- −$0
- Vacancy / Maint / Mgmt
- −$308
- Net cashflow
- $-456
Break-even live
Sensitivity live
| Price | -10% $-334 | -5% $-395 | +0% $-456 | +5% $-517 | +10% $-578 |
|---|---|---|---|---|---|
| Rent | -10% $-572 | -5% $-514 | +0% $-456 | +5% $-398 | +10% $-340 |
| Rate | -1.0pp $-348 | -0.5pp $-401 | base $-456 | +0.5pp $-512 | +1.0pp $-569 |
UW: 25.0% down · 7.5% · 30yr · 1.5% tax · 5.0% vac · 8.0% maint · 8.0% mgmt
Financing live
Cash to close
- Down payment
- $53,750
- Closing costs
- $6,450
- Reserves months
- —
- Total cash needed
- —
Loan-product check · same deal, 3 products live
Conventional
25% down · 7.5% · 30yr
- Down + closing
- —
- Monthly P&I
- —
- Monthly cashflow
- —
- DSCR
- —
- Eligible?
- —
Personal DTI + credit; lowest rate.
DSCR
20% down · 8.5% · 30yr
- Down + closing
- —
- Monthly P&I
- —
- Monthly cashflow
- —
- DSCR
- —
- Eligible?
- —
No personal income docs; deal must DSCR.
Hard money
10% down · 12.0% · 12mo
- Down + closing
- —
- Monthly P&I
- —
- Monthly cashflow
- —
- DSCR
- —
- Eligible?
- —
Short-term bridge; refi at stabilization.
Rent comps 17 comps
| Address | Beds | Baths | Sqft | Rent | $/sqft | DOM | Units | Dist |
|---|---|---|---|---|---|---|---|---|
| 915 Birnham Woods Blvd Pasadena, TX | 3.0 | 1.0 | 1340 | $1,550 | $1.16 | 46d | 1 | 0.14mi |
| 909 Birnham Woods Blvd Pasadena, TX | 3.0 | 1.5–2.0 | 1234 | $1,737 | $1.41 | 0d | 6 | 0.15mi |
| 1111 E. Beltway 8 Pasadena, TX | 2.0 | 1.0 | 900 | $825 | $0.92 | 7d | 1 | 0.27mi |
| 1516 Sam Houston Pkwy Pasadena, TX | 1.0–3.0 | 1.0–2.0 | 943 | $1,600 | $1.70 | 46d | 1 | 0.49mi |
| 3506 Red Bluff Rd Pasadena, TX | 2.0 | 1.0 | 936 | $976 | $1.04 | 46d | 1 | 0.58mi |
| 3500 Red Bluff Rd Pasadena, TX | 1.0–2.0 | 1.0–1.5 | 804 | $1,050 | $1.31 | 0d | 72 | 0.59mi |
| 1516 E Sam Houston Pkwy S Apt 803 Pasadena, TX | 2.0 | 1.5 | 1175 | $1,375 | $1.17 | 1d | 1 | 0.59mi |
| 1516 E Sam Houston Pkwy S Unit 1187 Pasadena, TX | 2.0 | 1.5 | 1105 | $1,500 | $1.36 | 1d | 1 | 0.59mi |
| 1516 E Sam Houston Pkwy S Apt 1308 Pasadena, TX | 2.0 | 2.0 | 940 | $1,250 | $1.33 | 1d | 1 | 0.59mi |
| 3119 Chestershire Dr Pasadena, TX | 3.0 | 1.0 | 1081 | $1,625 | $1.50 | 46d | 1 | 0.87mi |
| 707 Preston Ave Pasadena, TX | 3.0 | 2.0 | 1250 | $1,089 | $0.87 | 24d | 1 | 0.89mi |
| 707 Preston Ave Pasadena, TX | 2.0 | 2.0 | 965 | $949 | $0.98 | 46d | 1 | 0.89mi |
| 1803 Weeping Oaks Pasadena, TX | 3.0 | 3.0 | 1833 | $1,895 | $1.03 | 46d | 1 | 1.02mi |
| 3112 Grant St Pasadena, TX | 3.0 | 1.0 | 1330 | $1,625 | $1.22 | 24d | 1 | 1.04mi |
| 1817 New Orleans St Deer Park, TX | 3.0 | 2.0 | 1798 | $2,240 | $1.25 | 26d | 1 | 1.08mi |
| 2401 Southmore Ave Pasadena, TX | 1.0–3.0 | 1.0–2.0 | 835 | $1,325 | $1.59 | 5d | 4 | 1.36mi |
| 2513 Leslie St Pasadena, TX | 3.0 | 2.0 | 1849 | $1,895 | $1.02 | 5d | 1 | 1.38mi |
Listing history 2 events
-
2026-06-21remarks 693-char remark
-
2026-06-21$215,000 Active 2 DOM
ⓘ Source: listings_history table (triggers on properties + properties_extension) + one-shot
backfill from property_details.listing_events for pre-trigger history.
Tax reassessment forecast TX · Resets to sale price
- Current annual tax
- $4,794 · $400/mo
- Projected year-2 tax
- $4,794 · $400/mo
- Expected delta
- $0/yr ($0/mo · 0.0%)
ⓘ Screening estimate from a state-policy table — verify with the county assessor before closing.
Climate risk First Street
- Flood 1/10 Low FEMA zone X (unshaded) · 0% chance over 30 yrs
- Wildfire 1/10 Low
- Heat 9/10 Extreme 7 d/yr ≥109°F today · 24 d/yr by 30 yrs out
- Wind 9/10 Extreme 99% chance of damaging wind over 30 yrs
- Air quality 2/10 Low 2 unhealthy d/yr today · 2 by 30 yrs out
Nearby sold comps map
Loading sold comps map…
Walkable amenities ~0.75 mi
Loading nearby amenities…
Taxation est. · year 1
- Rental income
- $17,627
- − Mortgage interest
- −$12,043
- − Property taxes
- −$4,794
- − Insurance
- −$1,075
- − Repairs & maintenance
- −$1,410
- − Management
- −$1,410
- − Depreciation
- −$6,255
- Taxable loss
- −$9,361
- Est. tax savings @ 24.0%
- +$2,247
- After-tax cash flow
- $-3,227/yr
For passive investors: Depreciation is non-cash, so a rental often shows a tax loss while cash-flowing — sheltering income. Rental losses are passive: they offset passive income freely, and up to $25,000/yr can offset ordinary (W-2) income if you actively participate and your MAGI is under $100k (phasing out to $0 by $150k); unused losses carry forward. On sale, claimed depreciation is recaptured at up to 25%, and gains may owe capital-gains tax (a 1031 exchange can defer both). Figures are a year-1 estimate at your 24.0% rate — not tax advice; consult a CPA.
Schools (NCES district)
- District
- Pasadena ISD
- NCES district ID
- 4834320
- Math proficiency
- 29% ▼ -17.00%
- Reading proficiency
- 32% ▼ -9.00%
- Median HH income
- $45,163
- Composite
- 26.15/100
- National rank
- #7275
- State rank
- #612 of 826 in TX
Livability — Pasadena
- Score
- 66/100
- State rank
- #600
- US rank
- #11438
Category grades
Schools grade is shown separately in the Schools card above.
Census & demographics
- Census place
- Pasadena, TX
- County
- Harris County · 4,702,590 people
- City population
- 109,190
- Metro
- Houston-The Woodlands-Sugar Land, TX
- Population (ZIP)
- 23,866
- Household income
- $66,797
- Rent vs Own
- Severe rent burden
- 1101.0
Population outlook (Harris County) Hauer SSP2
- Today (2025)
- 5,571,493 people
- By 2030
- 6,089,821 · +9.3%
- By 2040
- 7,142,806 · +28.2%
- By 2050
- 8,185,864 · +46.9%
- By 2075
- 10,574,329 · +89.8%
- By 2100
- 12,109,958 · +117.4%
Race, ethnicity, and origin ACS 2023
- Neighborhood character
- Predominantly Hispanic (75%)
- Race & ethnicity
- Hispanic / Latino 75% Two or more races 34% White 20% Native American 2% Black 2%
- Hispanic origin (detail)
- Mexican 62% Puerto Rican 3%
- Common ancestry
- Italian 3% Romanian 1% Lithuanian 1%
- Foreign-born
- 25% · Canada
- Languages at home
- 50% English-only · Spanish 49%
Political lean MEDSL · Harris
- 2024 margin
- Lean D (+5.5) · D 52.0% · R 46.4% · Other 1.6%
- 2008→2024 swing
- +3.9pp toward D · 2008: 1.6pp · 2024: 5.5pp
- All cycles
- 2024: D+5.5 2020: D+13.3 2016: D+12.4 2012: D+0.1 2008: D+1.6
Not yet ingested
- Civics
- —
Market trends
- HPI YoY
- ▼ -46.01%
- Current HPI
- 288.9079
- Rent YoY
- ▼ -9.41%
- Metro
- Houston-The Woodlands-Sugar Land, TX
- State GDP YoY
- ▲ 3.95%
- F500 in state
- 110
Industry mix (Fortune 500 HQ in TX)
| Industry | F500 HQs | Revenue |
|---|---|---|
| Energy | 16 | $1,198B |
|
||
| Technology | 5 | $198B |
|
||
| Engineering / Construction | 4 | $72B |
|
||
| Energy Services | 3 | $60B |
|
||
| Utilities | 3 | $41B |
|
||
| Healthcare | 2 | $330B |
|
||
Price history
4 events — show timeline
- 2026-06-19 Listed $215,000 HARMLS
- 2026-03-23 Sold (Public Records) — Public Records
- 2015-12-21 Sold (Public Records) — Public Records
- 1963-10-09 Sold (Public Records) — Public Records
Property tax history
+7.0%/yrLatest (2025): $4,794 · -4.3% YoY. Source: county tax records.
Cash-flow waterfall
monthlySold comps — $/sqft
last 12 mo · ≤1 miLoading sold comps…