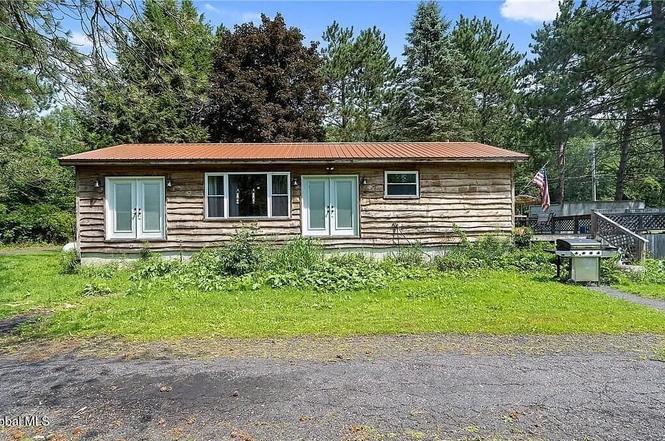
423 County Route 51a · Oswego, NY
Flood risk 1/10 · Minimal
- FEMA flood zone
- X (unshaded)
- Chance of flooding over 30 yrs
- 0.0%
- Est. flood insurance / yr
- $507 – $1,088
Fire risk 1/10 · Minimal
- Est. fire insurance / yr
- $691 – $1,283
Heat risk 2/10 · Minimal
- Hot days now (above 93°F)
- 7 days/yr
- Hot days in 30 yrs
- 16 days/yr
Wind risk 1/10 · Minimal
- Chance of severe wind over 30 yrs
- 0.0%
Air-quality risk 2/10 · Minimal
- Unhealthy air days now
- 2 days/yr
- Unhealthy air days in 30 yrs
- 2 days/yr
Risk factors via First Street. Map © Google.
Why this score? — see what drove the C- grade
The composite is a weighted blend of 9 inputs, each scored 0–100. Each bar is that input's sub-score; the figure is the points it added to the 100-point composite (weight × sub-score).
- Cash flow +14.8/30.0
- ARV discount +7.5/15.0
- 1% rule +5.0/10.0
- Rent growth +5.0/5.0
- DSCR +4.5/10.0
- Appreciation +3.9/10.0
- Livability +3.8/5.0
- Schools +3.3/10.0
- Condition / age +2.5/5.0
$129,900
🖨 Deal sheet 📄 Offer letter ✓ Due diligence
Listing remarks
Cozy, Modern, and Waiting for your Finishing Touches!! Located in Oswego, NY, this charming ranch offers a unique blend of modern construction and peaceful country living. Built in 2018, this home makes for an ideal starter home or retreat.
Key facts
- 1.21 acre lot
- 2 garage spots
- Built 2018
Neighborhood map
What this means for you Summary
Snapshot
- This is a 1-bed/2.0-bath manufactured listed at $130k.
Deal economics
- At list price, monthly cash flow is $35 ($425/yr) — positive.
- The deal already cash-flows at list — no discount required.
- To meet the 1% rule (rent ≥ 1% of price), the offer needs to be $130k (0.0% below list).
- Recommended offer: $128k (1.5% below list) — sets the bar for market timing.
- Cap rate 6.6% vs local median 8.8% in Oswego — below-typical yield; the buyer is paying a premium for something (appreciation thesis, condition, location) that the cap rate doesn't capture.
Location & tenants
- Location reads 75/100 on livability (#265 in NY, #4,189 nationally) — a middle-class / working-renter tenant base. Strengths: cost of living A+, housing A+, health & safety A+; Watch: schools D+, crime F, commute F.
- Mexico Central School District (rural): math 33% / reading 42% proficiency, ranked #540 of 590 in NY (top 92%) — families likely to look elsewhere, expect single-tenant / working-renter base with shorter leases.
- Market conditions: Rents rising fast (+19.2%/yr); 168 active listings in the ZIP; 172 units permitted in Oswego County in 2024 (27 in 5+ unit buildings).
Forward outlook
- Local home prices are declining (-2.2%/yr); year-one equity from $898 of loan paydown is wiped out by about $3k of value loss. Plan a longer hold.
- Oswego County population projected at -23% by 2050 — secular population decline; favor cash flow + early exit over multi-decade hold.
- At projected returns (-2.2% appreciation + 8.0% rent growth), your $36k cash investment doubles in ~10 years — after that, you're playing with house money.
Negotiation context
- It's been on market 16 days — a 2% lower offer ($128k) is reasonable based on typical stale-listing flexibility.
- 3 sale attempts since 5y ago with the ask held roughly flat each time — persistent listings suggest the price (not the market) is what's stuck; bring a comps-based counter.
Questions for the listing agent
- Is there a deadline driving the sale (1031 exchange, divorce, estate, relocation)? That informs how much negotiation room exists.
- Schools are D-rated, which usually means shorter tenancies and higher turnover. Who's the typical renter profile here, and what's been the actual vacancy rate?
- Crime grade is F in this area — have there been break-ins, vandalism, or insurance claims at this property in the last 3 years? What carrier currently insures it and at what premium?
- What's the average days-on-market for RENTAL listings here right now (not sales)? A rising rental-DOM trend means longer vacancies and softer asking-rent achievability than the comps imply.
- What's the recent tenant-quality profile in this submarket — average credit score on applications, eviction rate, late-payment / NSF rate, and stable-employment percentage? A property-management company in the area should have these aggregated.
- How much new for-sale + rental construction is in the pipeline within 1–3 miles? Heavy new supply typically softens prices + rents 12–24 months out; constrained supply supports both.
Investment metrics
- 1% rule
- 1.00% ✗
- Cap rate
- 6.62%
- Cash-on-cash
- 1.17%
- DSCR
- 1.05
- GRM
- 8.3
CMA / ARV
No comps found within radius.
Projected returns pro-forma
-2.25% appreciation · 8.0% rent growth · sell at horizon
- IRR
- -5.1%
- Equity multiple
- 0.79×
- Total profit
- $-7,754
- Equity at exit
- $23,733
- IRR
- 8.5%
- Equity multiple
- 1.86×
- Total profit
- $31,305
- Equity at exit
- $18,874
Cash invested: $36,372 (down + closing). Projections, not guarantees.
Landlord ↔ Tenant lean methodology
- Overall (STATE)
- 15 Strongly Tenant-Friendly
- State New York
- 15 Strongly Tenant-Friendly · D+10
- County
- — inherits STATE
- City
- — inherits STATE
ZIP-level market 13126
- Home prices YoY
- -0.8%
- Rents YoY
- 19.2%
- Active inventory
- 168
- Price-to-rent
- 8.3×
Monthly cashflow live
- Estimated rent
- $1,298 medium interval (Pro) →
- Mortgage (P&I)
- −$681
- Tax from tax record
- −$255 /mo · $3,061/yr
- Insurance
- −$54
- HOA
- −$0
- Vacancy / Maint / Mgmt
- −$273
- Net cashflow
- $35
Break-even live
UW: 25.0% down · 7.5% · 30yr · 1.5% tax · 5.0% vac · 8.0% maint · 8.0% mgmt
Financing live
Cash to close
- Down payment
- $32,475
- Closing costs
- $3,897
- Reserves months
- —
- Total cash needed
- —
Loan-product check · same deal, 3 products live
Conventional
25% down · 7.5% · 30yr
- Down + closing
- —
- Monthly P&I
- —
- Monthly cashflow
- —
- DSCR
- —
- Eligible?
- —
Personal DTI + credit; lowest rate.
DSCR
20% down · 8.5% · 30yr
- Down + closing
- —
- Monthly P&I
- —
- Monthly cashflow
- —
- DSCR
- —
- Eligible?
- —
No personal income docs; deal must DSCR.
Hard money
10% down · 12.0% · 12mo
- Down + closing
- —
- Monthly P&I
- —
- Monthly cashflow
- —
- DSCR
- —
- Eligible?
- —
Short-term bridge; refi at stabilization.
Listing history 12 events
-
2026-03-05status Pending
-
2026-02-17$129,900 Active
-
2024-12-31historical
-
2024-09-30historical Active Under Contract
-
2024-09-26price $125,000
-
2024-08-26price $129,999
-
2024-08-03price $149,500
-
2024-07-22$155,000 Active
-
2021-12-09historical
-
2021-11-23price $135,000
-
2021-09-15price $140,000
-
2021-07-20$145,000 Active
ⓘ Source: listings_history table (triggers on properties + properties_extension) + one-shot
backfill from property_details.listing_events for pre-trigger history.
Tax reassessment forecast NY · Partial reset (capped growth)
- Current annual tax
- $3,061 · $255/mo
- Projected year-2 tax
- $3,061 · $255/mo
- Expected delta
- $0/yr ($0/mo · 0.0%)
ⓘ Screening estimate from a state-policy table — verify with the county assessor before closing.
Climate risk First Street
- Flood 1/10 Low FEMA zone X (unshaded) · 0% chance over 30 yrs
- Wildfire 1/10 Low
- Heat 2/10 Low 7 d/yr ≥93°F today · 16 d/yr by 30 yrs out
- Wind 1/10 Low 0% chance of damaging wind over 30 yrs
- Air quality 2/10 Low 2 unhealthy d/yr today · 2 by 30 yrs out
Nearby sold comps map
Loading sold comps map…
Walkable amenities ~0.75 mi
Loading nearby amenities…
Taxation est. · year 1
- Rental income
- $15,582
- − Mortgage interest
- −$7,276
- − Property taxes
- −$3,061
- − Insurance
- −$650
- − Repairs & maintenance
- −$1,247
- − Management
- −$1,247
- − Depreciation
- −$3,779
- Taxable loss
- −$1,677
- Est. tax savings @ 24.0%
- +$402
- After-tax cash flow
- $827/yr
For passive investors: Depreciation is non-cash, so a rental often shows a tax loss while cash-flowing — sheltering income. Rental losses are passive: they offset passive income freely, and up to $25,000/yr can offset ordinary (W-2) income if you actively participate and your MAGI is under $100k (phasing out to $0 by $150k); unused losses carry forward. On sale, claimed depreciation is recaptured at up to 25%, and gains may owe capital-gains tax (a 1031 exchange can defer both). Figures are a year-1 estimate at your 24.0% rate — not tax advice; consult a CPA.
Schools (NCES district)
- District
- Mexico Central School District
- NCES district ID
- 3619170
- Math proficiency
- 33% ▼ -19.00%
- Reading proficiency
- 42% ▲ 1.00%
- Median HH income
- $51,635
- Composite
- 32.55/100
- National rank
- #5691
- State rank
- #540 of 590 in NY
Livability — Oswego
- Score
- 75/100
- State rank
- #265
- US rank
- #4189
Category grades
Schools grade is shown separately in the Schools card above.
Census & demographics
- County
- Oswego County · 36,495 people
- City population
- 36,495
- Metro
- Syracuse, NY
- Population (ZIP)
- 36,495
- Household income
- $65,346
- Rent vs Own
- Severe rent burden
- 1341.0
Population outlook (Oswego County) Hauer SSP2
- Today (2025)
- 114,465 people
- By 2030
- 109,968 · -3.9%
- By 2040
- 99,205 · -13.3%
- By 2050
- 87,979 · -23.1%
- By 2075
- 65,100 · -43.1%
- By 2100
- 47,117 · -58.8%
Race, ethnicity, and origin ACS 2023
- Neighborhood character
- Predominantly White (87%)
- Race & ethnicity
- White 87% Hispanic / Latino 5% Two or more races 5% Black 2% Asian 2%
- Hispanic origin (detail)
- Mexican 1% Puerto Rican 2%
- Common ancestry
- Romanian 6% Lithuanian 4% Italian 2%
- Foreign-born
- 3% · Canada
- Languages at home
- 93% English-only · Spanish 3% Other Asian/Pacific 1% Other Indo-European 1%
Political lean MEDSL · Oswego
- 2024 margin
- Strong R (+24.2) · D 37.9% · R 62.1%
- 2008→2024 swing
- -26.6pp toward R · 2008: 2.5pp · 2024: -24.2pp
- All cycles
- 2024: R+24.2 2020: R+20.2 2016: R+23.2 2012: D+7.9 2008: D+2.5
Not yet ingested
- Civics
- —
Market trends
- HPI YoY
- ▼ -2.25%
- Current HPI
- 295.5134
- Rent YoY
- ▲ 19.18%
- Metro
- Syracuse, NY
- State GDP YoY
- ▲ 2.60%
- F500 in state
- 92
Industry mix (Fortune 500 HQ in NY)
| Industry | F500 HQs | Revenue |
|---|---|---|
| Financial Services | 10 | $950B |
|
||
| Consumer Goods | 9 | $162B |
|
||
| Insurance | 4 | $225B |
|
||
| Telecommunications | 2 | $144B |
|
||
| Pharmaceuticals | 2 | $112B |
|
||
| Media / Entertainment | 2 | $69B |
|
||
Price history
-10.4% since first listed12 events — show timeline
- 2026-03-05 Pending — Global MLS
- 2026-02-17 Listed $129,900 Global MLS
- 2024-12-31 Listing Removed — CNYIS
- 2024-09-30 Contingent — CNYIS
- 2024-09-26 Price Changed $125,000 CNYIS
- 2024-08-26 Price Changed $129,999 CNYIS
- 2024-08-03 Price Changed $149,500 CNYIS
- 2024-07-22 Listed $155,000 CNYIS
- 2021-12-09 Listing Removed — CNYIS
- 2021-11-23 Price Changed $135,000 CNYIS
- 2021-09-15 Price Changed $140,000 CNYIS
- 2021-07-20 Listed $145,000 CNYIS
Property tax history
+7.8%/yrLatest (2025): $3,061 · -0.1% YoY. Source: county tax records.
Cash-flow waterfall
monthlySold comps — $/sqft
last 12 mo · ≤1 miLoading sold comps…