 🌊 Lakefront
18710 SE 61st Street Rd · Silver Springs Shores East, FL
Flood risk 1/10 · Minimal
- FEMA flood zone
- X (unshaded)
- Chance of flooding over 30 yrs
- 0.0%
- Est. flood insurance / yr
- $507 – $1,088
Fire risk 7/10 · Major
- Est. fire insurance / yr
- $947 – $1,759
Heat risk 8/10 · Major
- Hot days now (above 108°F)
- 7 days/yr
- Hot days in 30 yrs
- 21 days/yr
Wind risk 9/10 · Severe
- Chance of severe wind over 30 yrs
- 99.0%
Air-quality risk 3/10 · Minor
- Unhealthy air days now
- 2 days/yr
- Unhealthy air days in 30 yrs
- 2 days/yr
Risk factors via First Street. Map © Google.
Why this score? — see what drove the C+ grade
The composite is a weighted blend of 9 inputs, each scored 0–100. Each bar is that input's sub-score; the figure is the points it added to the 100-point composite (weight × sub-score).
- Cash flow +30.0/30.0
- DSCR +10.0/10.0
- 1% rule +9.5/10.0
- Schools +3.6/10.0
- Rent growth +2.5/5.0
- Livability +2.5/5.0
- Condition / age +2.5/5.0
- ARV discount +0.0/15.0
- Appreciation +0.0/10.0
$121,500
🖨 Deal sheet 📄 Offer letter ✓ Due diligence
Listing remarks
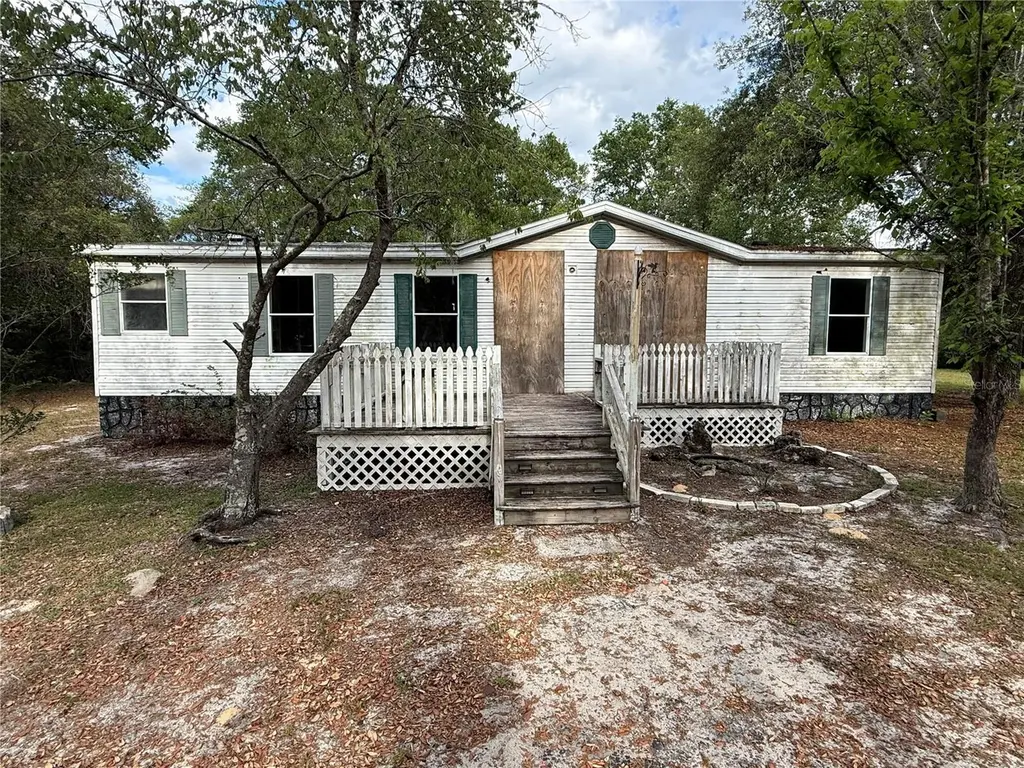
Handyman special! So much potential! The perfect opportunity to create your homestead property in Central Florida! Renovate the current fixer upper mobile home, or put something new on the property. Enjoy the good life on this large 3 acre parcel with A1 zoning! A short distance to Lake Weir, Ocala, Belleview, and The Villages. Located minutes from the Ocala National Forest, a 387,000 acre playground with over 600 lakes, rivers, and springs! Fantastic boating, fishing, camping, and hiking in the area. Minutes from the Ocklawaha River! No HOA! Seller does not have any records on functionality or condition. Investor owned, seller has no records on the property. Buyer to do their own due dilig
Key facts
- 3 acre lot
- Built 1998
- Listed 50 days
Property features AI
Finance
- Other: Property type: Residential; Property subtype: Manufactured Home; Zoned A1; Lot size approximately 3 acres (332 x 394); Total acreage: 2 to less than 5 acres; One well and one septic on property; Building area total recorded as 1,594 square feet; Living area recorded as 1,296 square feet
- Financial info: No lease restrictions; Tax year 2025
- HOA & community: No HOA
Exterior
- Parking: No parking details provided
- Security: No security details provided
- Utilities: Well water; Septic tank; Electricity available
- Home design: Residential manufactured home (double wide); Fixer condition; Single-story; Faces west; Entry level: One
- Construction: Other construction materials; Shingle roof; Crawlspace foundation; Built on double wide body type
- Exterior features: Cleared lot; Dirt road access
Interior
- Kitchen: No appliances included
- Bedrooms: 3 bedrooms
- Flooring: Other flooring
- Bathrooms: 2 full bathrooms
- Heating & cooling: Electric heating; Central air conditioning
- Interior features: Other interior features
- Laundry & utility: Indoor laundry
Neighborhood map
What this means for you Summary
Snapshot
- This is a 3-bed/2.0-bath manufactured listed at $122k.
Deal economics
- At list price, monthly cash flow is $497 ($6k/yr) — positive.
- The deal already cash-flows at list — no discount required.
- Meets the 1% rule at list price ($2k rent vs $122k).
- Recommended offer: $118k (3.0% below list) — sets the bar for market timing.
- Cap rate 11.2% vs local median 5.2% in Silver Springs Shores East — top-decile yield for the area; either an underpriced asset or a hidden risk that comps aren't pricing in. Stress-test before assuming the spread holds.
Location & tenants
- Location reads: area grade C — affects rentability + tenant quality, not the cash-flow math above.
- Marion (rural): math 42% / reading 43% proficiency, ranked #61 of 73 in FL (top 84%) — families likely to look elsewhere, expect single-tenant / working-renter base with shorter leases; 61% free/reduced lunch — lower-income household profile, screen leases tightly.
- Market conditions: 426 active listings in the ZIP; 7,071 units permitted in Marion County in 2024 (534 in 5+ unit buildings).
- At $1,765/mo this rent would consume 46% of the median local household income ($47k/yr) (locally 303% of renters already pay >50% of income on rent) — very limited rent-growth headroom before tenants either downsize or default.
Forward outlook
- Local home prices are declining (-3.0%/yr); year-one equity from $840 of loan paydown is wiped out by about $4k of value loss. Plan a longer hold.
- Marion County population projected at +13% by 2050 — modest demand growth; plan on rents tracking national, not racing it.
- At projected returns (-3.0% appreciation + 3.0% rent growth), your $34k cash investment doubles in ~7 years — after that, you're playing with house money.
Negotiation context
- It's been on market 50 days — a 3% lower offer ($118k) is reasonable based on typical stale-listing flexibility.
- Current owner paid $64k; list at $122k implies a 91% gain — meaningful room to come down on a strong offer.
Risks & watch-outs
- Climate carrying-cost: severe wind risk, 99% chance of damaging wind over 30y; major wildfire risk; extreme-heat days projected 7→21/yr by 2055 (HVAC capex compounding) — expect insurance premiums to compound above CPI over the hold.
Questions for the listing agent
- It's been on market 50 days. Have you received any prior offers? Is the seller open to a 3% concession, seller financing, or rate buy-down credit?
- Is there a deadline driving the sale (1031 exchange, divorce, estate, relocation)? That informs how much negotiation room exists.
- This sits on a lake — are riparian / water-frontage rights deeded with the parcel? Any dock permits, shoreline easements, or HOA water-use restrictions?
- What's the documented flood / surge / shoreline-erosion history here (FEMA AND non-FEMA — e.g., storm surge, creek backup, septic-field saturation)?
- Any water-quality or seasonal algae-bloom issues that affect tenant satisfaction or short-term-rental demand?
- What's the average days-on-market for RENTAL listings here right now (not sales)? A rising rental-DOM trend means longer vacancies and softer asking-rent achievability than the comps imply.
- What's the recent tenant-quality profile in this submarket — average credit score on applications, eviction rate, late-payment / NSF rate, and stable-employment percentage? A property-management company in the area should have these aggregated.
- How much new for-sale + rental construction is in the pipeline within 1–3 miles? Heavy new supply typically softens prices + rents 12–24 months out; constrained supply supports both.
Investment metrics
- 1% rule
- 1.45% ✓
- Cap rate
- 11.20%
- Cash-on-cash
- 17.52%
- DSCR
- 1.78
- GRM
- 5.7
CMA / ARV
- ARV (median comp)
- $84,517
- List price
- $121,500
- Delta
- 43.76%
- Verdict
- OVERPRICED
- Comps
- 2 within 1.0 mi
Show comp detail 2 sales within ~0.75 mi
| Address | Dist | Beds/Ba | Sqft | Sold | Price | $/sf | Match |
|---|---|---|---|---|---|---|---|
| 5515 SE 182nd Ter | 0.63mi | 2/2.0 (-1) | 1,256 (-3%) | 6mo | $100,000 | $80 | 55 |
| 18540 SE 53 Pl | 0.59mi | 3/2.0 | 1,352 (+4%) | 14mo | $149,900 | $111 | 54 |
Match score weights: distance 35% · size 25% · config 20% · recency 20%. Top-matched comps best support the ARV.
Projected returns pro-forma
-3.0% appreciation · 3.0% rent growth · sell at horizon
- IRR
- 9.0%
- Equity multiple
- 1.35×
- Total profit
- $12,013
- Equity at exit
- $18,116
- IRR
- 18.2%
- Equity multiple
- 2.51×
- Total profit
- $51,455
- Equity at exit
- $10,505
Cash invested: $34,020 (down + closing). Projections, not guarantees.
Landlord ↔ Tenant lean methodology
- Overall (STATE)
- 87 Strongly Landlord-Friendly
- State Florida
- 87 Strongly Landlord-Friendly · R+3
- County
- — inherits STATE
- City
- — inherits STATE
ZIP-level market 32179
- Home prices YoY
- -18.3%
- Active inventory
- 426
- Price-to-rent
- 5.7×
Monthly cashflow live
- Estimated rent
- $1,765 medium interval (Pro) →
- Mortgage (P&I)
- −$637
- Tax from tax record
- −$210 /mo · $2,519/yr
- Insurance
- −$51
- HOA
- −$0
- Vacancy / Maint / Mgmt
- −$371
- Net cashflow
- $497
Break-even live
UW: 25.0% down · 7.5% · 30yr · 1.5% tax · 5.0% vac · 8.0% maint · 8.0% mgmt
Financing live
Cash to close
- Down payment
- $30,375
- Closing costs
- $3,645
- Reserves months
- —
- Total cash needed
- —
Loan-product check · same deal, 3 products live
Conventional
25% down · 7.5% · 30yr
- Down + closing
- —
- Monthly P&I
- —
- Monthly cashflow
- —
- DSCR
- —
- Eligible?
- —
Personal DTI + credit; lowest rate.
DSCR
20% down · 8.5% · 30yr
- Down + closing
- —
- Monthly P&I
- —
- Monthly cashflow
- —
- DSCR
- —
- Eligible?
- —
No personal income docs; deal must DSCR.
Hard money
10% down · 12.0% · 12mo
- Down + closing
- —
- Monthly P&I
- —
- Monthly cashflow
- —
- DSCR
- —
- Eligible?
- —
Short-term bridge; refi at stabilization.
Listing history 17 events
-
2026-06-18days on market $121,500 Active 50 DOM
-
2026-06-17days on market $121,500 Active 49 DOM
-
2026-06-16days on market $121,500 Active 48 DOM
-
2026-06-15days on market $121,500 Active 47 DOM
-
2026-06-14days on market $121,500 Active 45 DOM
-
2026-06-13days on market $121,500 Active 44 DOM
-
2026-06-10days on market $121,500 Active 42 DOM
-
2026-06-09days on market $121,500 Active 41 DOM
-
2026-06-08days on market $121,500 Active 40 DOM
-
2026-06-07days on market $121,500 Active 39 DOM
-
2026-06-03days on market $121,500 Active 35 DOM
-
2026-06-02days on market $121,500 Active 34 DOM
-
2026-06-01days on market $121,500 Active 33 DOM
-
2026-05-31days on market $121,500 Active 32 DOM
-
2026-05-30days on market $121,500 Active 31 DOM
-
2026-04-29$135,000 Active 876-char remark
-
2001-01-31soldstatus $63,500
ⓘ Source: listings_history table (triggers on properties + properties_extension) + one-shot
backfill from property_details.listing_events for pre-trigger history.
Tax reassessment forecast FL · Resets to sale price
- Current annual tax
- $2,519 · $210/mo
- Projected year-2 tax
- $2,519 · $210/mo
- Expected delta
- $0/yr ($0/mo · 0.0%)
ⓘ Screening estimate from a state-policy table — verify with the county assessor before closing.
Climate risk First Street
- Flood 1/10 Low FEMA zone X (unshaded) · 0% chance over 30 yrs
- Wildfire 7/10 Severe
- Heat 8/10 Severe 7 d/yr ≥108°F today · 21 d/yr by 30 yrs out
- Wind 9/10 Extreme 99% chance of damaging wind over 30 yrs
- Air quality 3/10 Moderate 2 unhealthy d/yr today · 2 by 30 yrs out
Nearby sold comps map
Loading sold comps map…
Walkable amenities ~0.75 mi
Loading nearby amenities…
Taxation est. · year 1
- Rental income
- $21,182
- − Mortgage interest
- −$6,806
- − Property taxes
- −$2,519
- − Insurance
- −$608
- − Repairs & maintenance
- −$1,695
- − Management
- −$1,695
- − Depreciation
- −$3,535
- Taxable income
- $4,326
- Est. tax owed @ 24.0%
- −$1,038
- After-tax cash flow
- $4,923/yr
For passive investors: Depreciation is non-cash, so a rental often shows a tax loss while cash-flowing — sheltering income. Rental losses are passive: they offset passive income freely, and up to $25,000/yr can offset ordinary (W-2) income if you actively participate and your MAGI is under $100k (phasing out to $0 by $150k); unused losses carry forward. On sale, claimed depreciation is recaptured at up to 25%, and gains may owe capital-gains tax (a 1031 exchange can defer both). Figures are a year-1 estimate at your 24.0% rate — not tax advice; consult a CPA.
Schools (NCES district)
- District
- Marion
- NCES district ID
- 1201260
- Math proficiency
- 42% ▼ -7.00%
- Reading proficiency
- 43% ▼ -4.00%
- Median HH income
- $40,015
- Composite
- 35.61/100
- National rank
- #4890
- State rank
- #61 of 73 in FL
Livability — Silver Springs Shores East
No livability data for this city. (Only ~50 U.S. cities are tracked.)
Census & demographics
- County
- Marion County · 315,796 people
- Metro
- Ocala, FL
- Population (ZIP)
- 9,318
- Household income
- $46,512
- Rent vs Own
- Severe rent burden
- 303.0
Population outlook (Marion County) Hauer SSP2
- Today (2025)
- 365,905 people
- By 2030
- 376,768 · +3.0%
- By 2040
- 396,555 · +8.4%
- By 2050
- 412,723 · +12.8%
- By 2075
- 446,090 · +21.9%
- By 2100
- 436,193 · +19.2%
Race, ethnicity, and origin ACS 2023
- Neighborhood character
- Predominantly White (81%)
- Race & ethnicity
- White 81% Two or more races 12% Hispanic / Latino 11%
- Hispanic origin (detail)
- Mexican 5% Puerto Rican 3% Cuban 3%
- Common ancestry
- Slovak 4% Romanian 2% Lithuanian 2%
- Foreign-born
- 5% · Canada
- Languages at home
- 93% English-only · Spanish 7%
Political lean MEDSL · Marion
- 2024 margin
- Solid R (+31.6) · D 33.8% · R 65.5%
- 2008→2024 swing
- -20.0pp toward R · 2008: -11.6pp · 2024: -31.6pp
- All cycles
- 2024: R+31.6 2020: R+25.9 2016: R+26.2 2012: R+16.2 2008: R+11.6
Not yet ingested
- Civics
- —
Market trends
- HPI YoY
- ▼ -54.21%
- Current HPI
- 242.0408
- Rent YoY
- —
- Metro
- Ocala, FL
- State GDP YoY
- ▲ 3.28%
- F500 in state
- 36
Industry mix (Fortune 500 HQ in FL)
| Industry | F500 HQs | Revenue |
|---|---|---|
| Industrial Technology | 2 | $29B |
|
||
| Insurance | 2 | $17B |
|
||
| Retail | 1 | $60B |
|
||
| Technology Distribution | 1 | $58B |
|
||
| Homebuilding | 1 | $35B |
|
||
| Technology Manufacturing | 1 | $35B |
|
||
Price history
+91.3% since first listed3 events — show timeline
- 2026-05-20 Price Changed $121,500 Stellar MLS as Distributed by MLS Grid
- 2026-04-29 Listed $135,000 Stellar MLS as Distributed by MLS Grid
- 2001-01-31 Sold (Public Records) $63,500 Public Records
Property tax history
+12.7%/yrLatest (2025): $2,519 · +13.2% YoY. Source: county tax records.
Cash-flow waterfall
monthlySold comps — $/sqft
last 12 mo · ≤1 miLoading sold comps…