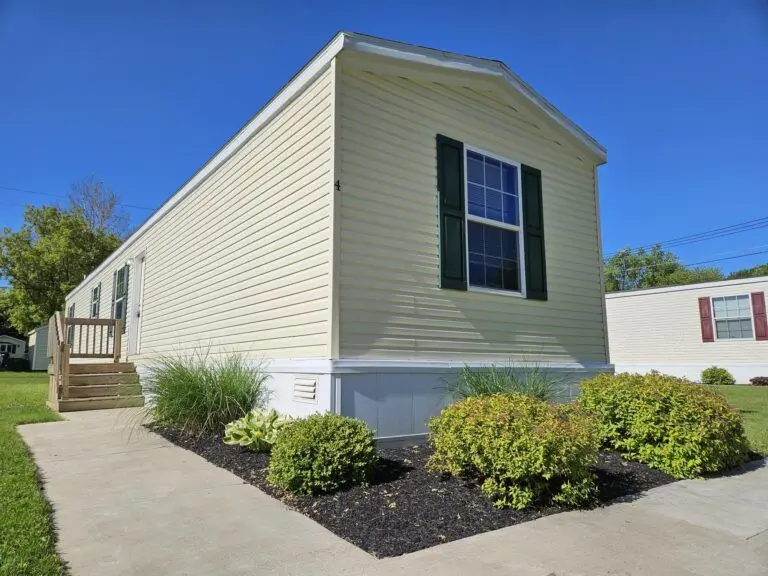
4 Sycamore Dr · East Avon, NY
Flood risk No data
- FEMA flood zone
- —
- Chance of flooding over 30 yrs
- —
- Est. flood insurance / yr
- —
Fire risk No data
- Est. fire insurance / yr
- —
Heat risk No data
- Hot days now (above threshold)
- —
- Hot days in 30 yrs
- —
Wind risk No data
- Chance of severe wind over 30 yrs
- —
Air-quality risk No data
- Unhealthy air days now
- —
- Unhealthy air days in 30 yrs
- —
Risk factors via First Street. Map © Google.
Why this score? — see what drove the B grade
The composite is a weighted blend of 9 inputs, each scored 0–100. Each bar is that input's sub-score; the figure is the points it added to the 100-point composite (weight × sub-score).
- Cash flow +30.0/30.0
- 1% rule +10.0/10.0
- DSCR +10.0/10.0
- ARV discount +10.0/15.0
- Schools +4.5/10.0
- Livability +3.0/5.0
- Rent growth +2.5/5.0
- Condition / age +2.5/5.0
- Appreciation +0.0/10.0
$72,900
🖨 Deal sheet 📄 Offer letter ✓ Due diligence
Listing remarks
Countryside Comfort. Everyday Convenience. Budget Friendly Living!
Key facts
- Built 2026
- Listed 14 days
Property features AI
Finance
- Financial info: List price $72,900
Exterior
- Home design: Single-family residence (spec home)
- Construction: Living area: 1,216
- Exterior features: Address: 4 Sycamore Dr, Avon NY 14414
Interior
- Bedrooms: 3 bedrooms
- Bathrooms: 2 full bathrooms
- Interior features: Spec home (Twin Cedars of Avon plan)
Neighborhood map
What this means for you Summary
Snapshot
- This is a 3-bed/2.0-bath manufactured listed at $73k.
Deal economics
- At list price, monthly cash flow is $857 ($10k/yr) — positive.
- The deal already cash-flows at list — no discount required.
- Meets the 1% rule at list price ($2k rent vs $73k).
Location & tenants
- Location reads 60/100 on livability (#1,004 in NY) — a middle-class / working-renter tenant base. Strengths: housing A+, employment A-, cost of living B; Watch: schools F, crime F, amenities F.
- Avon Central School District (town): math 53% / reading 50% proficiency, ranked #349 of 590 in NY (top 59%) — acceptable for families but not a draw, mixed tenant base, ~2y average lease.
- Market conditions: 37 active listings in the ZIP; 86 units permitted in Livingston County in 2024 (0 in 5+ unit buildings).
Forward outlook
- Local home prices are declining (-3.0%/yr); year-one equity from $504 of loan paydown is wiped out by about $2k of value loss. Plan a longer hold.
- Livingston County population projected at -13% by 2050 — secular population decline; favor cash flow + early exit over multi-decade hold.
- At projected returns (-3.0% appreciation + 3.0% rent growth), your $20k cash investment doubles in ~3 years — after that, you're playing with house money.
Negotiation context
- Only 14 days on market — expect competitive offers; lowballing is unlikely to land.
Questions for the listing agent
- Is there a deadline driving the sale (1031 exchange, divorce, estate, relocation)? That informs how much negotiation room exists.
- Schools are F-rated, which usually means shorter tenancies and higher turnover. Who's the typical renter profile here, and what's been the actual vacancy rate?
- Crime grade is F in this area — have there been break-ins, vandalism, or insurance claims at this property in the last 3 years? What carrier currently insures it and at what premium?
- What's the average days-on-market for RENTAL listings here right now (not sales)? A rising rental-DOM trend means longer vacancies and softer asking-rent achievability than the comps imply.
- What's the recent tenant-quality profile in this submarket — average credit score on applications, eviction rate, late-payment / NSF rate, and stable-employment percentage? A property-management company in the area should have these aggregated.
- How much new for-sale + rental construction is in the pipeline within 1–3 miles? Heavy new supply typically softens prices + rents 12–24 months out; constrained supply supports both.
Investment metrics
- 1% rule
- 2.36% ✓
- Cap rate
- 20.40%
- Cash-on-cash
- 50.38%
- DSCR
- 3.24
- GRM
- 3.5
CMA / ARV
- ARV (on-the-fly)
- $77,168
- Comps found
- 5
Show comp detail 5 sales within ~0.75 mi
| Address | Dist | Beds/Ba | Sqft | Sold | Price | $/sf | Match |
|---|---|---|---|---|---|---|---|
| 27 Hillside Dr | 0.22mi | 3/2.0 | 1,450 (-0%) | 17mo | $117,500 | $81 | 75 |
| 100 Hillside Dr | 0.49mi | 3/2.0 | 1,458 (+0%) | 8mo | $117,900 | $81 | 70 |
| 36 Harper Parkway Pkwy | 0.27mi | 3/2.0 | 1,404 (-4%) | 15mo | $64,000 | $46 | 69 |
| 68 Hillside Dr Dr | 0.39mi | 3/2.0 | 1,568 (+8%) | 4mo | $78,000 | $50 | 66 |
| 53 Hillside Dr | 0.36mi | 3/2.0 | 1,560 (+7%) | 21mo | $83,000 | $53 | 54 |
Match score weights: distance 35% · size 25% · config 20% · recency 20%. Top-matched comps best support the ARV.
Projected returns pro-forma
-3.0% appreciation · 3.0% rent growth · sell at horizon
- IRR
- 48.1%
- Equity multiple
- 3.10×
- Total profit
- $42,792
- Equity at exit
- $10,870
- IRR
- 53.8%
- Equity multiple
- 6.27×
- Total profit
- $107,647
- Equity at exit
- $6,303
Cash invested: $20,412 (down + closing). Projections, not guarantees.
Landlord ↔ Tenant lean methodology
- Overall (STATE)
- 15 Strongly Tenant-Friendly
- State New York
- 15 Strongly Tenant-Friendly · D+10
- County
- — inherits STATE
- City
- — inherits STATE
ZIP-level market 14414
- Home prices YoY
- -14.1%
- Active inventory
- 37
- Price-to-rent
- 3.5×
Monthly cashflow live
- Estimated rent
- $1,722 medium interval (Pro) →
- Mortgage (P&I)
- −$382
- Tax est. 1.5%
- −$91 /mo · $1,094/yr
- Insurance
- −$30
- HOA
- −$0
- Vacancy / Maint / Mgmt
- −$362
- Net cashflow
- $857
Break-even live
UW: 25.0% down · 7.5% · 30yr · 1.5% tax · 5.0% vac · 8.0% maint · 8.0% mgmt
Financing live
Cash to close
- Down payment
- $18,225
- Closing costs
- $2,187
- Reserves months
- —
- Total cash needed
- —
Loan-product check · same deal, 3 products live
Conventional
25% down · 7.5% · 30yr
- Down + closing
- —
- Monthly P&I
- —
- Monthly cashflow
- —
- DSCR
- —
- Eligible?
- —
Personal DTI + credit; lowest rate.
DSCR
20% down · 8.5% · 30yr
- Down + closing
- —
- Monthly P&I
- —
- Monthly cashflow
- —
- DSCR
- —
- Eligible?
- —
No personal income docs; deal must DSCR.
Hard money
10% down · 12.0% · 12mo
- Down + closing
- —
- Monthly P&I
- —
- Monthly cashflow
- —
- DSCR
- —
- Eligible?
- —
Short-term bridge; refi at stabilization.
Listing history 11 events
-
2026-06-18days on market $72,900 Active 14 DOM
-
2026-06-17days on market $72,900 Active 13 DOM
-
2026-06-16days on market $72,900 Active 12 DOM
-
2026-06-15days on market $72,900 Active 11 DOM
-
2026-06-13days on market $72,900 Active 9 DOM
-
2026-06-13days on market $72,900 Active 8 DOM
-
2026-06-10days on market $72,900 Active 6 DOM
-
2026-06-09days on market $72,900 Active 5 DOM
-
2026-06-08days on market $72,900 Active 4 DOM
-
2026-06-07remarks 66-char remark
-
2026-06-07$72,900 Active 3 DOM
ⓘ Source: listings_history table (triggers on properties + properties_extension) + one-shot
backfill from property_details.listing_events for pre-trigger history.
Nearby sold comps map
Loading sold comps map…
Walkable amenities ~0.75 mi
Loading nearby amenities…
Taxation est. · year 1
- Rental income
- $20,669
- − Mortgage interest
- −$4,084
- − Property taxes
- −$1,094
- − Insurance
- −$364
- − Repairs & maintenance
- −$1,654
- − Management
- −$1,654
- − Depreciation
- −$2,121
- Taxable income
- $9,700
- Est. tax owed @ 24.0%
- −$2,328
- After-tax cash flow
- $7,955/yr
For passive investors: Depreciation is non-cash, so a rental often shows a tax loss while cash-flowing — sheltering income. Rental losses are passive: they offset passive income freely, and up to $25,000/yr can offset ordinary (W-2) income if you actively participate and your MAGI is under $100k (phasing out to $0 by $150k); unused losses carry forward. On sale, claimed depreciation is recaptured at up to 25%, and gains may owe capital-gains tax (a 1031 exchange can defer both). Figures are a year-1 estimate at your 24.0% rate — not tax advice; consult a CPA.
Schools (NCES district)
- District
- Avon Central School District
- NCES district ID
- 3603660
- Math proficiency
- 53% ▬ 0.00%
- Reading proficiency
- 50% ▲ 12.00%
- Median HH income
- $55,407
- Composite
- 44.56/100
- National rank
- #2786
- State rank
- #349 of 590 in NY
Livability — East Avon
- Score
- 60/100
- State rank
- #1004
- US rank
- #19541
Category grades
Schools grade is shown separately in the Schools card above.
Census & demographics
- County
- Livingston County · 6,576 people
- Metro
- Rochester, NY
- Population (ZIP)
- 6,576
- Household income
- $72,006
- Rent vs Own
- Severe rent burden
- 100.0
Population outlook (Livingston County) Hauer SSP2
- Today (2025)
- 63,466 people
- By 2030
- 61,966 · -2.4%
- By 2040
- 58,398 · -8.0%
- By 2050
- 54,955 · -13.4%
- By 2075
- 49,958 · -21.3%
- By 2100
- 43,944 · -30.8%
Race, ethnicity, and origin ACS 2023
- Neighborhood character
- Predominantly White (92%)
- Race & ethnicity
- White 92% Two or more races 4% Hispanic / Latino 2% Black 1%
- Common ancestry
- Romanian 6% Italian 4% Lithuanian 2%
- Foreign-born
- 2% · China, Canada
- Languages at home
- 98% English-only · Spanish 1%
Political lean MEDSL · Livingston
- 2024 margin
- Strong R (+21.4) · D 39.3% · R 60.7%
- 2008→2024 swing
- -13.6pp toward R · 2008: -7.9pp · 2024: -21.4pp
- All cycles
- 2024: R+21.4 2020: R+18.2 2016: R+27.8 2012: R+9.4 2008: R+7.9
Not yet ingested
- Civics
- —
Market trends
- HPI YoY
- ▼ -40.57%
- Current HPI
- 247.7027
- Rent YoY
- —
- Metro
- Rochester, NY
- State GDP YoY
- ▲ 2.60%
- F500 in state
- 92
Industry mix (Fortune 500 HQ in NY)
| Industry | F500 HQs | Revenue |
|---|---|---|
| Financial Services | 10 | $950B |
|
||
| Consumer Goods | 9 | $162B |
|
||
| Insurance | 4 | $225B |
|
||
| Telecommunications | 2 | $144B |
|
||
| Pharmaceuticals | 2 | $112B |
|
||
| Media / Entertainment | 2 | $69B |
|
||
Cash-flow waterfall
monthlySold comps — $/sqft
last 12 mo · ≤1 miLoading sold comps…