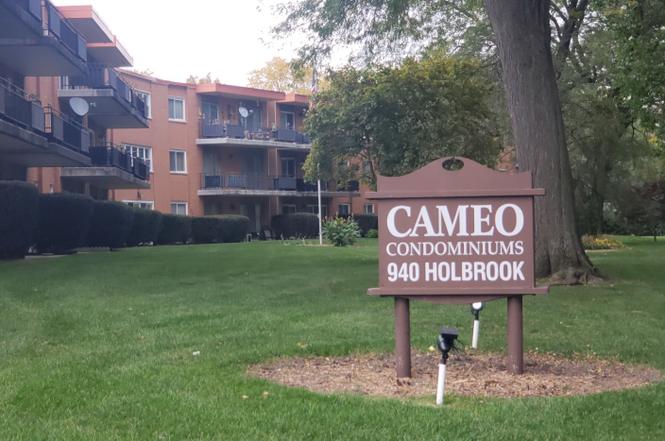
940 Holbrook Rd Unit 26C · Homewood, IL
Flood risk 1/10 · Minimal
- FEMA flood zone
- X (unshaded)
- Chance of flooding over 30 yrs
- 0.0%
- Est. flood insurance / yr
- $507 – $1,088
Fire risk 1/10 · Minimal
- Est. fire insurance / yr
- $804 – $1,492
Heat risk 3/10 · Minor
- Hot days now (above 101°F)
- 7 days/yr
- Hot days in 30 yrs
- 14 days/yr
Wind risk 2/10 · Minimal
- Chance of severe wind over 30 yrs
- —
Air-quality risk 2/10 · Minimal
- Unhealthy air days now
- 2 days/yr
- Unhealthy air days in 30 yrs
- 2 days/yr
Risk factors via First Street. Map © Google.
Why this score? — see what drove the D+ grade
The composite is a weighted blend of 9 inputs, each scored 0–100. Each bar is that input's sub-score; the figure is the points it added to the 100-point composite (weight × sub-score).
- Cash flow +15.6/30.0
- 1% rule +8.4/10.0
- ARV discount +7.5/15.0
- DSCR +4.8/10.0
- Livability +4.0/5.0
- Rent growth +2.5/5.0
- Condition / age +2.5/5.0
- Schools +2.4/10.0
- Appreciation +0.0/10.0
$116,000
🖨 Deal sheet 📄 Offer letter ✓ Due diligence
Listing remarks MLS
Two bedroom, third floor unit. With view of woods. Flexicore makes it quiet and fireproof. New window and patio door. Decorative fireplace in living room, dining room area. Laundry on each floor, plus exercise room and storage unit. Great price, low taxes! Don't wait, call today. 55 and older adult community.
Key facts
- Private balcony
- New flooring
- Convenient access
Tags
Property features AI
Finance
- Other: 108 total units in the building; Living area per assessor; Parcel number available; Directions: Halsted to Holbrook, west to the property
- Financial info: Special service area: No; Tax exemptions noted for Homeowner, Senior, and Senior Freeze
- HOA & community: Monthly association fee of $318; Association fee covers water, insurance, exercise facilities, exterior maintenance, lawn care, scavenger (trash), and snow removal; Association amenities include patio, picnic area, school bus service, screened porch, security lighting, trails, and wheelchair-oriented features; On-site manager; Pets not allowed
Exterior
- Parking: One parking space (total); Asphalt parking; Off-street and off-alley parking; Unassigned and guest parking; Basement parking (owned)
- Security: On-site manager; Security lighting
- Utilities: Lake Michigan and public water; Public sewer; Cable available
- Home design: Attached single condo; Condo ownership; Entry level: 2nd floor; Accessible / disability equipped; Built approximately 51–60 years ago; Commuter bus and interstate access nearby; Adult community
- Construction: Brick construction; Concrete perimeter foundation; Built before 1978
- Exterior features: Balcony; Patio; Picnic area; Screened porch; Security lighting; Trails; Wheelchair oriented access
Interior
- Kitchen: Range; Refrigerator; Kitchen and dining combined
- Bedrooms: Master bedroom on main level (12 x 16); Second bedroom on main level (10 x 16); Two additional bedrooms
- Flooring: Vinyl flooring in living room, kitchen, dining room and bedrooms
- Bathrooms: One full bathroom
- Heating & cooling: Electric heat; Central air conditioning
- Interior features: Five total rooms; Soaking tub
- Laundry & utility: Laundry room; Gas dryer hookup; Common area laundry; Electric water heater
Neighborhood map
What this means for you Summary
Snapshot
- This is a 2-bed/1.0-bath condo listed at $116k.
Deal economics
- At list price, monthly cash flow is $49 ($590/yr) — positive.
- The deal already cash-flows at list — no discount required.
- Meets the 1% rule at list price ($2k rent vs $116k).
- Recommended offer: $102k (12.0% below list) — sets the bar for market timing.
Location & tenants
- Location reads 81/100 on livability (#81 in IL, #1,314 nationally) — a professional / high-income tenant draw. Strengths: commute A+, employment A+, cost of living A+; Watch: amenities F.
- Homewood Flossmoor Chsd 233 (suburban): math 21% / reading 27% proficiency, ranked #272 of 620 in IL (top 44%) — low school quality limits family demand, transient renter base, plan for 1-2y turnover.
- Zoned schools: Homewood-Flossmoor High School (math 21% / reading 27%, grade F, #304 of 693 statewide, top 44%, 2,798 students, 0% FRL).
- Market conditions: 101 active listings in the ZIP; 4 comparable units currently listed for rent nearby; rentals leasing fast (median 5d on market — plan ~1-2 weeks tenant-placement turnaround); 6,272 units permitted in Cook County in 2024 (4,658 in 5+ unit buildings).
Forward outlook
- Local home prices are declining (-3.0%/yr); year-one equity from $802 of loan paydown is wiped out by about $3k of value loss. Plan a longer hold.
Negotiation context
- It's been on market 153 days — a 12% lower offer ($102k) is reasonable based on typical stale-listing flexibility.
- 3 sale attempts since 9y ago with the ask held roughly flat each time — persistent listings suggest the price (not the market) is what's stuck; bring a comps-based counter.
- Current owner paid $38k; list at $116k implies a 205% gain — meaningful room to come down on a strong offer.
Risks & watch-outs
- Watch-outs: HOA is 20% of rent.
Questions for the listing agent
- It's been on market 153 days. Have you received any prior offers? Is the seller open to a 12% concession, seller financing, or rate buy-down credit?
- Built in 1971 — when were the roof, HVAC, electrical panel, plumbing, and water heater last replaced?
- What does the HOA fee cover, when was the last increase, and are there any pending special assessments or reserve-fund shortfalls?
- Any open or pending special assessments — roof, HVAC, plumbing, elevator, façade? What's the per-unit balance and payoff schedule, and is the seller paying it off at close or rolling it to the buyer?
- Why hasn't it sold? Are there any deal-killer items the seller is aware of (foundation, flood, title, zoning, code violations)?
- Is there a deadline driving the sale (1031 exchange, divorce, estate, relocation)? That informs how much negotiation room exists.
- Schools are D-rated, which usually means shorter tenancies and higher turnover. Who's the typical renter profile here, and what's been the actual vacancy rate?
- The area grade is low — what's the realistic commute time and amenity access for the typical tenant pool here? Any planned neighborhood developments (good or bad) we should know about?
- What's the average days-on-market for RENTAL listings here right now (not sales)? A rising rental-DOM trend means longer vacancies and softer asking-rent achievability than the comps imply.
- What's the recent tenant-quality profile in this submarket — average credit score on applications, eviction rate, late-payment / NSF rate, and stable-employment percentage? A property-management company in the area should have these aggregated.
- How much new apartment / multifamily construction is in the pipeline within 1–3 miles? Heavy new supply (>2% of stock underway) typically softens rents 12–24 months out; light construction supports rent growth.
Investment metrics
- 1% rule
- 1.34% ✓
- Cap rate
- 6.80%
- Cash-on-cash
- 1.82%
- DSCR
- 1.08
- GRM
- 6.2
CMA / ARV
No comps found within radius.
Projected returns pro-forma
-3.0% appreciation · 3.0% rent growth · sell at horizon
- IRR
- -13.1%
- Equity multiple
- 0.53×
- Total profit
- $-15,410
- Equity at exit
- $17,296
- IRR
- -3.8%
- Equity multiple
- 0.74×
- Total profit
- $-8,345
- Equity at exit
- $10,030
Cash invested: $32,480 (down + closing). Projections, not guarantees.
Landlord ↔ Tenant lean methodology
- Overall (STATE)
- 43 Moderately Tenant-Leaning
- State Illinois
- 43 Moderately Tenant-Leaning · D+7
- County
- — inherits STATE
- City
- — inherits STATE
ZIP-level market 60430
- Home prices YoY
- -32.1%
- Active inventory
- 101
- Price-to-rent
- 6.2×
Monthly cashflow live
- Estimated rent
- $1,557 medium interval (Pro) →
- Mortgage (P&I)
- −$608
- Tax from tax record
- −$207 /mo · $2,478/yr
- Insurance
- −$48
- HOA
- −$318
- Vacancy / Maint / Mgmt
- −$327
- Net cashflow
- $49
Break-even live
UW: 25.0% down · 7.5% · 30yr · 1.5% tax · 5.0% vac · 8.0% maint · 8.0% mgmt
Financing live
Cash to close
- Down payment
- $29,000
- Closing costs
- $3,480
- Reserves months
- —
- Total cash needed
- —
Loan-product check · same deal, 3 products live
Conventional
25% down · 7.5% · 30yr
- Down + closing
- —
- Monthly P&I
- —
- Monthly cashflow
- —
- DSCR
- —
- Eligible?
- —
Personal DTI + credit; lowest rate.
DSCR
20% down · 8.5% · 30yr
- Down + closing
- —
- Monthly P&I
- —
- Monthly cashflow
- —
- DSCR
- —
- Eligible?
- —
No personal income docs; deal must DSCR.
Hard money
10% down · 12.0% · 12mo
- Down + closing
- —
- Monthly P&I
- —
- Monthly cashflow
- —
- DSCR
- —
- Eligible?
- —
Short-term bridge; refi at stabilization.
Rent comps 4 comps
| Address | Beds | Baths | Sqft | Rent | $/sqft | DOM | Units | Dist |
|---|---|---|---|---|---|---|---|---|
| 44 N Glenwood Ave Glenwood, IL | 1.0 | 1.0 | 700 | $1,900 | $2.71 | 1d | 1 | 1.29mi |
| 531 Wallace St Chicago Heights, IL | 3.0 | 1.0 | 1100 | $2,000 | $1.82 | 5d | 1 | 1.31mi |
| 723 Grant Ave Unit 2F Chicago Heights, IL | 1.0 | 1.0 | 700 | $1,100 | $1.57 | 15d | 1 | 1.48mi |
| 723 Grant Ave Unit 3C Chicago Heights, IL | 1.0 | 1.0 | 700 | $1,100 | $1.57 | 1d | 1 | 1.48mi |
HOA detail condo
- Monthly dues
- $318 · $3,816/yr
- Assessments
- None detected in remarks — confirm with the listing agent.
Listing history 13 events
-
2026-06-18days on market $116,000 Active 153 DOM
-
2026-06-17days on market $116,000 Active 152 DOM
-
2026-06-16days on market $116,000 Active 151 DOM
-
2026-06-15days on market $116,000 Active 150 DOM
-
2026-06-13days on market $116,000 Active 148 DOM
-
2026-06-09days on market $116,000 Active 144 DOM
-
2026-06-08days on market $116,000 Active 143 DOM
-
2026-06-07days on market $116,000 Active 142 DOM
-
2026-06-04days on market $116,000 Active 139 DOM
-
2026-06-03days on market $116,000 Active 138 DOM
-
2026-06-02days on market $116,000 Active 137 DOM
-
2026-06-01days on market $116,000 Active 136 DOM
-
2026-05-31days on market $116,000 Active 135 DOM
ⓘ Source: listings_history table (triggers on properties + properties_extension) + one-shot
backfill from property_details.listing_events for pre-trigger history.
Tax reassessment forecast IL · Partial reset (capped growth)
- Current annual tax
- $2,478 · $207/mo
- Projected year-2 tax
- $2,556 · $213/mo
- Expected delta
- +$77/yr (+$6/mo · 3.1%)
ⓘ Screening estimate from a state-policy table — verify with the county assessor before closing.
Climate risk First Street
- Flood 1/10 Low FEMA zone X (unshaded) · 0% chance over 30 yrs
- Wildfire 1/10 Low
- Heat 3/10 Moderate 7 d/yr ≥101°F today · 14 d/yr by 30 yrs out
- Wind 2/10 Low
- Air quality 2/10 Low 2 unhealthy d/yr today · 2 by 30 yrs out
Nearby sold comps map
Loading sold comps map…
Walkable amenities ~0.75 mi
Loading nearby amenities…
Taxation est. · year 1
- Rental income
- $18,688
- − Mortgage interest
- −$6,498
- − Property taxes
- −$2,478
- − Insurance
- −$580
- − Repairs & maintenance
- −$1,495
- − Management
- −$1,495
- − HOA
- −$3,816
- − Depreciation
- −$3,375
- Taxable loss
- −$1,048
- Est. tax savings @ 24.0%
- +$252
- After-tax cash flow
- $841/yr
For passive investors: Depreciation is non-cash, so a rental often shows a tax loss while cash-flowing — sheltering income. Rental losses are passive: they offset passive income freely, and up to $25,000/yr can offset ordinary (W-2) income if you actively participate and your MAGI is under $100k (phasing out to $0 by $150k); unused losses carry forward. On sale, claimed depreciation is recaptured at up to 25%, and gains may owe capital-gains tax (a 1031 exchange can defer both). Figures are a year-1 estimate at your 24.0% rate — not tax advice; consult a CPA.
Schools (NCES district)
- District
- Homewood Flossmoor Chsd 233
- NCES district ID
- 1719560
- Math proficiency
- 21% ▼ -15.00%
- Reading proficiency
- 27% ▼ -13.00%
- Median HH income
- $83,564
- Composite
- 24.42/100
- National rank
- #7681
- State rank
- #272 of 620 in IL
Livability — Homewood
- Score
- 81/100
- State rank
- #81
- US rank
- #1314
Category grades
Schools grade is shown separately in the Schools card above.
Census & demographics
- Census place
- Homewood, IL
- City population
- 19,993
- Population (ZIP)
- 19,993
Population outlook (Cook County) Hauer SSP2
- Today (2025)
- 5,347,519 people
- By 2030
- 5,357,703 · +0.2%
- By 2040
- 5,324,924 · -0.4%
- By 2050
- 5,230,762 · -2.2%
- By 2075
- 4,785,735 · -10.5%
- By 2100
- 4,188,836 · -21.7%
Race, ethnicity, and origin ACS 2023
- Neighborhood character
- Diverse neighborhood (Simpson 0.62)
- Race & ethnicity
- Black 44% White 42% Hispanic / Latino 9% Two or more races 6% Asian 1%
- Hispanic origin (detail)
- Mexican 7%
- Common ancestry
- Romanian 5% Iranian 2% Italian 2%
- Foreign-born
- 6% · Canada, Dominican Republic
- Languages at home
- 91% English-only · Spanish 5% Russian/Polish/Slavic 1% German/W. Germanic 1%
Political lean MEDSL · Cook
- 2024 margin
- Solid D (+42.0) · D 70.4% · R 28.4% · Other 1.2%
- 2008→2024 swing
- -11.4pp toward R · 2008: 53.4pp · 2024: 42.0pp
- All cycles
- 2024: D+42.0 2020: D+50.3 2016: D+53.0 2012: D+49.4 2008: D+53.4
Not yet ingested
- Civics
- —
Market trends
- HPI YoY
- ▼ -105.00%
- Current HPI
- 222.2923
- Rent YoY
- —
- Metro
- —
- State GDP YoY
- ▲ 1.59%
- F500 in state
- 60
Industry mix (Fortune 500 HQ in IL)
| Industry | F500 HQs | Revenue |
|---|---|---|
| Insurance | 4 | $201B |
|
||
| Consumer Goods | 4 | $87B |
|
||
| Industrial Machinery | 3 | $64B |
|
||
| Healthcare | 2 | $55B |
|
||
| Retail / Pharmacy | 1 | $148B |
|
||
| Agriculture / Food | 1 | $86B |
|
||
Price history
+82.0% since first listed10 events — show timeline
- 2026-05-29 Relisted — MRED as Distributed by MLS Grid
- 2026-05-15 Listing Removed — MRED as Distributed by MLS Grid
- 2026-04-30 Price Changed $116,500 MRED as Distributed by MLS Grid
- 2026-03-27 Price Changed $118,000 MRED as Distributed by MLS Grid
- 2025-01-02 Listed $120,000 MRED as Distributed by MLS Grid
- 2017-09-06 Sold (Public Records) $38,000 Public Records
- 2017-08-30 Sold (MLS) $38,000 MRED as Distributed by MLS Grid
- 2017-07-01 Pending — MRED as Distributed by MLS Grid
- 2017-04-11 Listed $43,000 MRED as Distributed by MLS Grid
- 1995-09-29 Sold (Public Records) $64,000 Public Records
Property tax history
+6.1%/yrLatest (2018): $2,478 · +837.3% YoY. Source: county tax records.
Cash-flow waterfall
monthlySold comps — $/sqft
last 12 mo · ≤1 miLoading sold comps…