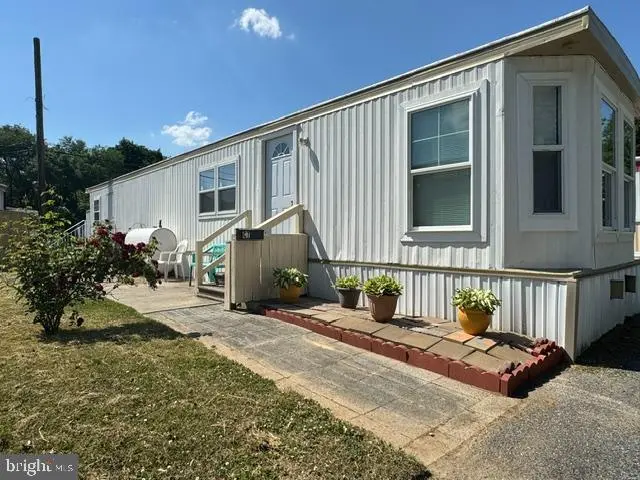
151 Roosevelt Ave Unit C7 · Dover, DE
Flood risk 1/10 · Minimal
- FEMA flood zone
- X (unshaded)
- Chance of flooding over 30 yrs
- 0.0%
- Est. flood insurance / yr
- $507 – $1,088
Fire risk 1/10 · Minimal
- Est. fire insurance / yr
- $476 – $884
Heat risk 8/10 · Major
- Hot days now (above 100°F)
- 7 days/yr
- Hot days in 30 yrs
- 15 days/yr
Wind risk 7/10 · Major
- Chance of severe wind over 30 yrs
- 78.0%
Air-quality risk 2/10 · Minimal
- Unhealthy air days now
- 1 days/yr
- Unhealthy air days in 30 yrs
- 2 days/yr
Risk factors via First Street. Map © Google.
Why this score? — see what drove the B- grade
The composite is a weighted blend of 9 inputs, each scored 0–100. Each bar is that input's sub-score; the figure is the points it added to the 100-point composite (weight × sub-score).
- Cash flow +30.0/30.0
- 1% rule +10.0/10.0
- DSCR +10.0/10.0
- ARV discount +7.5/15.0
- Livability +3.4/5.0
- Rent growth +3.0/5.0
- Condition / age +2.5/5.0
- Schools +2.0/10.0
- Appreciation +0.0/10.0
$55,000
🖨 Deal sheet 📄 Offer letter ✓ Due diligence
Listing remarks
Thoughtfully remodeled and refreshed, this 1973 mobile home offers a low maintenance living in a 55+ land-lease community. The main living area flows nicely into the updated kitchen, which features ample cabinet space, brand-new appliances, and a dining area providing a comfortable place to gather and enjoy meals. The home includes two bedrooms, offering flexibility for a variety of uses. The second bedroom can easily function as a guest room, office, or computer space depending on your needs. The bathroom has been tastefully updated with a clean, modern look. Additional conveniences include an in-unit washer and dryer, helping simplify daily routines. Each home also includes a designated p
Key facts
- Updated kitchen
- Ample cabinet space
- Brand-new appliances
Tags
Property features AI
Finance
- Financial info: Annual ground rent listed as an income/expense item
- HOA & community: Land lease: $594 monthly; Land lease years remaining: 127
Exterior
- Parking: On-street parking
- Utilities: Public water; Public sewer; Electric hot water
- Home design: Single-wide mobile home (Majestic model); Mobile home built prior to 1976; Estimated year built; Located in a senior community (55+)
- Construction: Modular/Manufactured construction; Above-grade and below-grade structures noted
- Exterior features: Shed; Ground rent exists (paid annually)
Interior
- Kitchen: Stainless steel appliances; Refrigerator; Electric oven/range
- Bedrooms: 2 bedrooms on the main level
- Bathrooms: 1 full bathroom on the main level
- Heating & cooling: Forced air heating; Oil-fired heating
- Interior features: Open floor plan; Combination kitchen and dining area; Walk-in shower; Window treatments
- Laundry & utility: Washer; Electric dryer; Electric water heater
Neighborhood map
What this means for you Summary
Snapshot
- This is a 2-bed/1.0-bath manufactured listed at $55k.
Deal economics
- At list price, monthly cash flow is $900 ($11k/yr) — positive.
- The deal already cash-flows at list — no discount required.
- Meets the 1% rule at list price ($2k rent vs $55k).
- Recommended offer: $54k (1.5% below list) — sets the bar for market timing.
- Cap rate 25.9% vs local median 5.2% in Dover — top-decile yield for the area; either an underpriced asset or a hidden risk that comps aren't pricing in. Stress-test before assuming the spread holds.
Location & tenants
- Location reads 67/100 on livability (#38 in DE) — a middle-class / working-renter tenant base. Strengths: amenities A+, cost of living A+, housing A+; Watch: schools C-, crime F, commute F.
- Capital School District (urban): math 14% / reading 31% proficiency, ranked #24 of 26 in DE (top 92%) — low school quality limits family demand, transient renter base, plan for 1-2y turnover.
- Market conditions: Rents rising (+2.0%/yr); 184 active listings in the ZIP; 8 comparable units currently listed for rent nearby; rentals lingering (median 44d on market — plan ~5-8 weeks vacancy on turnover, expect pricing pressure); 100% of comp listings sitting > 30 days — soft ceiling on asking rent; 1,201 units permitted in Kent County in 2024 (116 in 5+ unit buildings).
Forward outlook
- Local home prices are declining (-3.0%/yr); year-one equity from $380 of loan paydown is wiped out by about $2k of value loss. Plan a longer hold.
- Kent County population projected at +22% by 2050 — long-run rental-demand tailwind backs the buy-and-hold thesis.
- At projected returns (-3.0% appreciation + 2.0% rent growth), your $15k cash investment doubles in ~2 years — after that, you're playing with house money.
Negotiation context
- It's been on market 30 days — a 2% lower offer ($54k) is reasonable based on typical stale-listing flexibility.
Risks & watch-outs
- Climate carrying-cost: major wind risk, 78% chance of damaging wind over 30y; extreme-heat days projected 7→15/yr by 2055 (HVAC capex compounding) — expect insurance premiums to compound above CPI over the hold.
Questions for the listing agent
- Built in 1973 — when were the roof, HVAC, electrical panel, plumbing, and water heater last replaced?
- Is there a deadline driving the sale (1031 exchange, divorce, estate, relocation)? That informs how much negotiation room exists.
- Crime grade is F in this area — have there been break-ins, vandalism, or insurance claims at this property in the last 3 years? What carrier currently insures it and at what premium?
- What's the average days-on-market for RENTAL listings here right now (not sales)? A rising rental-DOM trend means longer vacancies and softer asking-rent achievability than the comps imply.
- What's the recent tenant-quality profile in this submarket — average credit score on applications, eviction rate, late-payment / NSF rate, and stable-employment percentage? A property-management company in the area should have these aggregated.
- How much new for-sale + rental construction is in the pipeline within 1–3 miles? Heavy new supply typically softens prices + rents 12–24 months out; constrained supply supports both.
Investment metrics
- 1% rule
- 2.95% ✓
- Cap rate
- 25.93%
- Cash-on-cash
- 70.14%
- DSCR
- 4.12
- GRM
- 2.8
CMA / ARV
- ARV (on-the-fly)
- $33,792
- Comps found
- 2
Show comp detail 2 sales within ~0.75 mi
| Address | Dist | Beds/Ba | Sqft | Sold | Price | $/sf | Match |
|---|---|---|---|---|---|---|---|
| 151 Roosevelt Ave Unit C6 | 0.00mi | 2/1.5 | 720 (-6%) | 6mo | $32,000 | $44 | 83 |
| 151 Roosevelt Ave #31 | 0.01mi | 1/1.0 (-1) | 720 (-6%) | 10mo | $27,900 | $39 | 76 |
Match score weights: distance 35% · size 25% · config 20% · recency 20%. Top-matched comps best support the ARV.
Projected returns pro-forma
-3.0% appreciation · 2.03% rent growth · sell at horizon
- IRR
- 68.6%
- Equity multiple
- 4.04×
- Total profit
- $46,878
- Equity at exit
- $8,201
- IRR
- 72.4%
- Equity multiple
- 8.04×
- Total profit
- $108,441
- Equity at exit
- $4,755
Cash invested: $15,400 (down + closing). Projections, not guarantees.
Landlord ↔ Tenant lean methodology
- Overall (STATE)
- 70 Landlord-Friendly
- State Delaware
- 70 Landlord-Friendly · D+7
- County
- — inherits STATE
- City
- — inherits STATE
ZIP-level market 19901
- Rents YoY
- 2.0%
- Active inventory
- 184
- Price-to-rent
- 2.8×
Monthly cashflow live
- Estimated rent
- $1,621 high interval (Pro) →
- Mortgage (P&I)
- −$288
- Tax est. 1.5%
- −$69 /mo · $825/yr
- Insurance
- −$23
- HOA
- −$0
- Vacancy / Maint / Mgmt
- −$340
- Net cashflow
- $900
Break-even live
UW: 25.0% down · 7.5% · 30yr · 1.5% tax · 5.0% vac · 8.0% maint · 8.0% mgmt
Financing live
Cash to close
- Down payment
- $13,750
- Closing costs
- $1,650
- Reserves months
- —
- Total cash needed
- —
Loan-product check · same deal, 3 products live
Conventional
25% down · 7.5% · 30yr
- Down + closing
- —
- Monthly P&I
- —
- Monthly cashflow
- —
- DSCR
- —
- Eligible?
- —
Personal DTI + credit; lowest rate.
DSCR
20% down · 8.5% · 30yr
- Down + closing
- —
- Monthly P&I
- —
- Monthly cashflow
- —
- DSCR
- —
- Eligible?
- —
No personal income docs; deal must DSCR.
Hard money
10% down · 12.0% · 12mo
- Down + closing
- —
- Monthly P&I
- —
- Monthly cashflow
- —
- DSCR
- —
- Eligible?
- —
Short-term bridge; refi at stabilization.
Rent comps 8 comps
| Address | Beds | Baths | Sqft | Rent | $/sqft | DOM | Units | Dist |
|---|---|---|---|---|---|---|---|---|
| 814 New Castle Ave Dover, DE | 3.0 | 1.0 | 950 | $1,650 | $1.74 | 43d | 1 | 0.64mi |
| 480 Country Dr Dover, DE | 3.0 | 1.0–2.0 | 715 | $1,653 | $2.31 | 43d | 22 | 1.10mi |
| 51 Webbs Ln Dover, DE | 2.0 | 1.0–1.5 | 787 | $1,525 | $1.94 | 43d | 11 | 1.17mi |
| 4 Carolee Dr Dover, DE | 3.0 | 1.0 | 1008 | $2,100 | $2.08 | 43d | 1 | 1.25mi |
| 12 S State St Unit 2 Dover, DE | 1.0 | 1.0 | 800 | $1,195 | $1.49 | 43d | 1 | 1.35mi |
| 5 S State St Dover, DE | 1.0 | 1.5 | 1100 | $1,200 | $1.09 | 43d | 1 | 1.36mi |
| 16 S New St #1 Dover, DE | 3.0 | 1.0 | 1000 | $1,950 | $1.95 | 43d | 1 | 1.40mi |
| 46 Lincoln St Dover, DE | 2.0 | 2.0 | 1073 | $1,700 | $1.58 | 43d | 1 | 1.49mi |
Listing history 16 events
-
2026-06-19days on market $55,000 Active 30 DOM
-
2026-06-18days on market $55,000 Active 29 DOM
-
2026-06-17days on market $55,000 Active 28 DOM
-
2026-06-16days on market $55,000 Active 27 DOM
-
2026-06-15days on market $55,000 Active 26 DOM
-
2026-06-14days on market $55,000 Active 24 DOM
-
2026-06-13days on market $55,000 Active 23 DOM
-
2026-06-10days on market $55,000 Active 21 DOM
-
2026-06-09days on market $55,000 Active 20 DOM
-
2026-06-08days on market $55,000 Active 19 DOM
-
2026-06-07days on market $55,000 Active 18 DOM
-
2026-06-02days on market $55,000 Active 13 DOM
-
2026-06-01days on market $55,000 Active 12 DOM
-
2026-05-31days on market $55,000 Active 11 DOM
-
2026-05-30days on market $55,000 Active 10 DOM
-
2026-05-21$55,000 Active
ⓘ Source: listings_history table (triggers on properties + properties_extension) + one-shot
backfill from property_details.listing_events for pre-trigger history.
Climate risk First Street
- Flood 1/10 Low FEMA zone X (unshaded) · 0% chance over 30 yrs
- Wildfire 1/10 Low
- Heat 8/10 Severe 7 d/yr ≥100°F today · 15 d/yr by 30 yrs out
- Wind 7/10 Severe 78% chance of damaging wind over 30 yrs
- Air quality 2/10 Low 1 unhealthy d/yr today · 2 by 30 yrs out
Nearby sold comps map
Loading sold comps map…
Walkable amenities ~0.75 mi
Loading nearby amenities…
Taxation est. · year 1
- Rental income
- $19,447
- − Mortgage interest
- −$3,081
- − Property taxes
- −$825
- − Insurance
- −$275
- − Repairs & maintenance
- −$1,556
- − Management
- −$1,556
- − Depreciation
- −$1,600
- Taxable income
- $10,555
- Est. tax owed @ 24.0%
- −$2,533
- After-tax cash flow
- $8,269/yr
For passive investors: Depreciation is non-cash, so a rental often shows a tax loss while cash-flowing — sheltering income. Rental losses are passive: they offset passive income freely, and up to $25,000/yr can offset ordinary (W-2) income if you actively participate and your MAGI is under $100k (phasing out to $0 by $150k); unused losses carry forward. On sale, claimed depreciation is recaptured at up to 25%, and gains may owe capital-gains tax (a 1031 exchange can defer both). Figures are a year-1 estimate at your 24.0% rate — not tax advice; consult a CPA.
Schools (NCES district)
- District
- Capital School District
- NCES district ID
- 1000190
- Math proficiency
- 14% ▼ -17.00%
- Reading proficiency
- 31% ▼ -12.00%
- Median HH income
- $48,499
- Composite
- 19.78/100
- National rank
- #8703
- State rank
- #24 of 26 in DE
Livability — Dover
- Score
- 67/100
- State rank
- #38
- US rank
- #10574
Category grades
Schools grade is shown separately in the Schools card above.
Census & demographics
- Census place
- Dover, DE
- County
- Kent County · 82,184 people
- City population
- 76,581
- Metro
- Dover, DE
- Population (ZIP)
- 37,763
- Household income
- $66,388
- Rent vs Own
- Severe rent burden
- 1320.0
Population outlook (Kent County) Hauer SSP2
- Today (2025)
- 194,477 people
- By 2030
- 204,351 · +5.1%
- By 2040
- 222,135 · +14.2%
- By 2050
- 236,483 · +21.6%
- By 2075
- 266,327 · +36.9%
- By 2100
- 275,335 · +41.6%
Race, ethnicity, and origin ACS 2023
- Neighborhood character
- Diverse neighborhood (Simpson 0.68)
- Race & ethnicity
- White 44% Black 34% Hispanic / Latino 13% Two or more races 11% Asian 2%
- Hispanic origin (detail)
- Mexican 3% Puerto Rican 6%
- Common ancestry
- Romanian 2% Hispanic 1% Lithuanian 1%
- Foreign-born
- 7% · Canada, South Korea
- Languages at home
- 88% English-only · Spanish 7% French/Haitian/Cajun 1% Other Asian/Pacific 1%
Political lean MEDSL · Kent
- 2024 margin
- Toss-up / Even · D 50.2% · R 48.2% · Other 1.7%
- 2008→2024 swing
- -7.8pp toward R · 2008: 9.8pp · 2024: 2.0pp
- All cycles
- 2024: D+2.0 2020: D+4.1 2016: R+4.9 2012: D+4.9 2008: D+9.8
Not yet ingested
- Civics
- —
Market trends
- HPI YoY
- ▼ -113.29%
- Current HPI
- 199.5132
- Rent YoY
- ▲ 2.03%
- Metro
- Dover, DE
- State GDP YoY
- —
- F500 in state
- 0
Price history
1 event — show timeline
- 2026-05-21 Listed $55,000 BRIGHT MLS
Property tax history
+2.5%/yrLatest (2022): $106 · +4.3% YoY. Source: county tax records.
Cash-flow waterfall
monthlySold comps — $/sqft
last 12 mo · ≤1 miLoading sold comps…