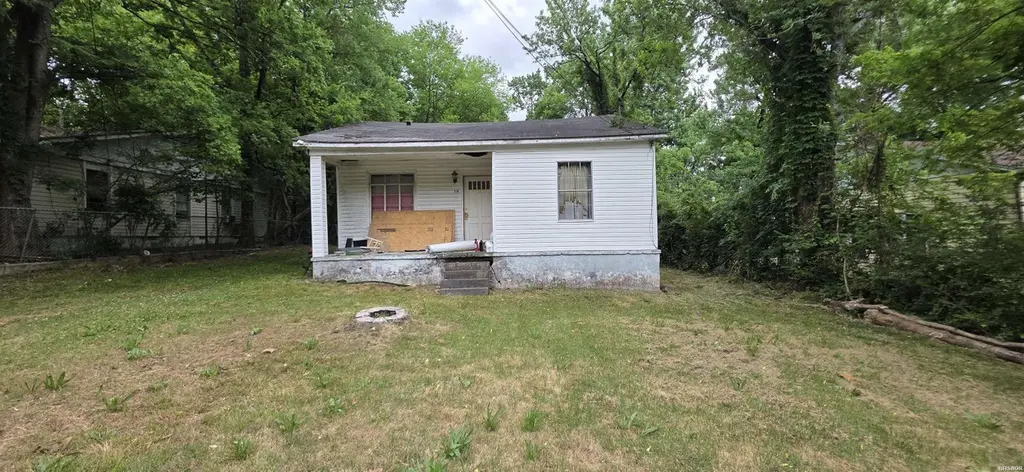
330 Mason St · Hot Springs, AR
Flood risk 1/10 · Minimal
- FEMA flood zone
- X (unshaded)
- Chance of flooding over 30 yrs
- 0.0%
- Est. flood insurance / yr
- $507 – $1,088
Fire risk 3/10 · Minor
- Est. fire insurance / yr
- $1,499 – $2,785
Heat risk 6/10 · Moderate
- Hot days now (above 111°F)
- 7 days/yr
- Hot days in 30 yrs
- 19 days/yr
Wind risk 4/10 · Minor
- Chance of severe wind over 30 yrs
- 9.0%
Air-quality risk 1/10 · Minimal
- Unhealthy air days now
- 0 days/yr
- Unhealthy air days in 30 yrs
- 0 days/yr
Risk factors via First Street. Map © Google.
Why this score? — see what drove the B- grade
The composite is a weighted blend of 9 inputs, each scored 0–100. Each bar is that input's sub-score; the figure is the points it added to the 100-point composite (weight × sub-score).
- Cash flow +30.0/30.0
- 1% rule +10.0/10.0
- DSCR +10.0/10.0
- ARV discount +7.5/15.0
- Rent growth +4.1/5.0
- Livability +3.2/5.0
- Condition / age +2.5/5.0
- Schools +2.0/10.0
- Appreciation +0.0/10.0
$35,000
🖨 Deal sheet 📄 Offer letter ✓ Due diligence
Listing remarks MLS
All offers must be submitted by buyers agent into Sellers offer management platform PropOffers. com, agents please READ the agent confidential remarks section for additional information on offer submission. No interior access, subfloors are caving in and entry is unsafe, seller not allowing inferior access for showings. Property sold as-is, no utilities, no disclosures or warranties. All offers must be accompanied by proof of funds, earnest money will be required with accepted offer.
Key facts
- Close to shopping
- Conveniently located
- Close to downtown
Tags
Property features AI
Finance
- Financial info: Annual taxes approximately $600
Exterior
- Utilities: Public water; Public sewer
- Home design: Single-family residential home; Single story
- Exterior features: Located on Mason Street; directions: From Albert Pike go north on Mason, house on the right
Interior
- Bathrooms: 2 full bathrooms
- Interior features: 1-story interior layout
Neighborhood map
What this means for you Summary
Snapshot
- This is a 2-bed/2.0-bath single-family listed at $35k.
Deal economics
- At list price, monthly cash flow is $577 ($7k/yr) — positive.
- The deal already cash-flows at list — no discount required.
- Meets the 1% rule at list price ($1k rent vs $35k).
- Recommended offer: $34k (1.5% below list) — sets the bar for market timing.
- Cap rate 26.1% vs local median 2.8% in Hot Springs — top-decile yield for the area; either an underpriced asset or a hidden risk that comps aren't pricing in. Stress-test before assuming the spread holds.
Location & tenants
- Location reads 65/100 on livability (#140 in AR) — a middle-class / working-renter tenant base. Strengths: cost of living A+, housing A+, health & safety A-; Watch: schools D, crime F, amenities F.
- Hot Springs School District (urban): math 24% / reading 25% proficiency, ranked #195 of 238 in AR (top 82%) — low school quality limits family demand, transient renter base, plan for 1-2y turnover; 72% free/reduced lunch — lower-income household profile, screen leases tightly.
- Market conditions: Rents rising fast (+6.4%/yr); 986 active listings in the ZIP; 6 comparable units currently listed for rent nearby; rentals lingering (median 44d on market — plan ~5-8 weeks vacancy on turnover, expect pricing pressure); 83% of comp listings sitting > 30 days — soft ceiling on asking rent; 117 units permitted in Garland County in 2024 (24 in 5+ unit buildings).
Forward outlook
- Local home prices are declining (-3.0%/yr); year-one equity from $242 of loan paydown is wiped out by about $1k of value loss. Plan a longer hold.
- Garland County population projected at +7% by 2050 — modest demand growth; plan on rents tracking national, not racing it.
- At projected returns (-3.0% appreciation + 6.4% rent growth), your $10k cash investment doubles in ~2 years — after that, you're playing with house money.
Negotiation context
- It's been on market 27 days — a 2% lower offer ($34k) is reasonable based on typical stale-listing flexibility.
- 3 sale attempts since 2y ago with the ask held roughly flat each time — persistent listings suggest the price (not the market) is what's stuck; bring a comps-based counter.
- Current owner paid $25k; 39% above their basis — modest negotiation headroom, anchor on the comps not their cost.
Risks & watch-outs
- Watch-outs: built in 1955 — expect roof / HVAC / electrical / plumbing capex.
- Climate carrying-cost: extreme-heat days projected 7→19/yr by 2055 (HVAC capex compounding) — expect insurance premiums to compound above CPI over the hold.
Questions for the listing agent
- Built in 1955 — when were the roof, HVAC, electrical panel, plumbing, and water heater last replaced?
- Is there a deadline driving the sale (1031 exchange, divorce, estate, relocation)? That informs how much negotiation room exists.
- Schools are D-rated, which usually means shorter tenancies and higher turnover. Who's the typical renter profile here, and what's been the actual vacancy rate?
- Crime grade is F in this area — have there been break-ins, vandalism, or insurance claims at this property in the last 3 years? What carrier currently insures it and at what premium?
- What's the average days-on-market for RENTAL listings here right now (not sales)? A rising rental-DOM trend means longer vacancies and softer asking-rent achievability than the comps imply.
- What's the recent tenant-quality profile in this submarket — average credit score on applications, eviction rate, late-payment / NSF rate, and stable-employment percentage? A property-management company in the area should have these aggregated.
- How much new for-sale + rental construction is in the pipeline within 1–3 miles? Heavy new supply typically softens prices + rents 12–24 months out; constrained supply supports both.
Investment metrics
- 1% rule
- 2.98% ✓
- Cap rate
- 26.06%
- Cash-on-cash
- 70.61%
- DSCR
- 4.14
- GRM
- 2.8
CMA / ARV
- ARV (on-the-fly)
- $132,980
- Comps found
- 12
Show comp detail 12 sales within ~0.75 mi
| Address | Dist | Beds/Ba | Sqft | Sold | Price | $/sf | Match |
|---|---|---|---|---|---|---|---|
| 160 Cooper St Unit 17B | 0.20mi | 2/2.0 | 1,268 (+4%) | 1mo | $138,500 | $109 | 83 |
| 210 Jeffries St | 0.37mi | 3/1.0 (+1) | 1,224 (+0%) | 3mo | $129,000 | $105 | 71 |
| 100 Wisteria Pl | 0.45mi | 2/1.5 | 1,190 (-2%) | 5mo | $100,000 | $84 | 68 |
| 335 Mason St | 0.04mi | 2/2.0 | 1,065 (-13%) | 10mo | $80,000 | $75 | 68 |
| 111 Dahlia St | 0.32mi | 2/1.5 | 1,314 (+8%) | 9mo | $177,500 | $135 | 63 |
| 135 Mountain Vw | 0.26mi | 2/1.0 | 1,344 (+10%) | 8mo | $115,000 | $86 | 60 |
| 110 Marigold | 0.55mi | 2/1.5 | 1,288 (+6%) | 5mo | $199,500 | $155 | 58 |
| 144 Centerview St | 0.72mi | 3/2.0 (+1) | 1,196 (-2%) | 0mo | $151,000 | $126 | 58 |
| 140 Cooper St Unit 2-D | 0.25mi | 2/1.0 | 1,045 (-14%) | 4mo | $121,000 | $116 | 57 |
| 1230 Garland Ave | 0.54mi | 2/1.0 | 1,084 (-11%) | 2mo | $70,000 | $65 | 51 |
| 503 Beard St | 0.59mi | 3/1.0 (+1) | 1,120 (-8%) | 2mo | $126,000 | $113 | 48 |
| 209 N Patterson St | 0.64mi | 3/2.0 (+1) | 1,330 (+9%) | 6mo | $77,000 | $58 | 45 |
Match score weights: distance 35% · size 25% · config 20% · recency 20%. Top-matched comps best support the ARV.
Projected returns pro-forma
-3.0% appreciation · 6.43% rent growth · sell at horizon
- IRR
- 74.1%
- Equity multiple
- 4.55×
- Total profit
- $34,803
- Equity at exit
- $5,219
- IRR
- 78.8%
- Equity multiple
- 10.60×
- Total profit
- $94,092
- Equity at exit
- $3,026
Cash invested: $9,800 (down + closing). Projections, not guarantees.
Landlord ↔ Tenant lean methodology
- Overall (STATE)
- 92 Strongly Landlord-Friendly
- State Arkansas
- 92 Strongly Landlord-Friendly · R+14
- County
- — inherits STATE
- City
- — inherits STATE
ZIP-level market 71913
- Home prices YoY
- -33.9%
- Rents YoY
- 6.4%
- Active inventory
- 986
- Price-to-rent
- 2.8×
Monthly cashflow live
- Estimated rent
- $1,044 high interval (Pro) →
- Mortgage (P&I)
- −$184
- Tax from tax record
- −$50 /mo · $600/yr
- Insurance
- −$15
- HOA
- −$0
- Vacancy / Maint / Mgmt
- −$219
- Net cashflow
- $577
Break-even live
UW: 25.0% down · 7.5% · 30yr · 1.5% tax · 5.0% vac · 8.0% maint · 8.0% mgmt
Financing live
Cash to close
- Down payment
- $8,750
- Closing costs
- $1,050
- Reserves months
- —
- Total cash needed
- —
Loan-product check · same deal, 3 products live
Conventional
25% down · 7.5% · 30yr
- Down + closing
- —
- Monthly P&I
- —
- Monthly cashflow
- —
- DSCR
- —
- Eligible?
- —
Personal DTI + credit; lowest rate.
DSCR
20% down · 8.5% · 30yr
- Down + closing
- —
- Monthly P&I
- —
- Monthly cashflow
- —
- DSCR
- —
- Eligible?
- —
No personal income docs; deal must DSCR.
Hard money
10% down · 12.0% · 12mo
- Down + closing
- —
- Monthly P&I
- —
- Monthly cashflow
- —
- DSCR
- —
- Eligible?
- —
Short-term bridge; refi at stabilization.
Rent comps 6 comps
| Address | Beds | Baths | Sqft | Rent | $/sqft | DOM | Units | Dist |
|---|---|---|---|---|---|---|---|---|
| 150 Sun St Hot Springs National Park, AR | 3.0 | 1.0 | 1120 | $1,150 | $1.03 | 43d | 1 | 0.68mi |
| 1036 Garland Ave Hot Springs National Park, AR | 2.0 | 1.0 | 1200 | $1,150 | $0.96 | 43d | 1 | 0.71mi |
| 951 Whittington Ave Hot Springs National Park, AR | 2.0 | 1.0 | 950 | $850 | $0.89 | 43d | 1 | 1.14mi |
| 948 Whittington Ave Hot Springs, AR | 1.0–2.0 | 1.0–1.5 | 800 | $950 | $1.19 | 23d | 6 | 1.17mi |
| 410 Oakwood Ave Hot Springs, AR | 2.0–3.0 | 2.0 | 1000 | $999 | $1.00 | 43d | 6 | 1.22mi |
| 627 Quapaw Ave Unit 2 Hot Springs, AR | 1.0 | 1.0 | 775 | $950 | $1.23 | 43d | 1 | 1.44mi |
Listing history 22 events
-
2026-06-15status $35,000 Pending 27 DOM
-
2026-06-15days on market $35,000 Active 27 DOM
-
2026-06-14days on market $35,000 Active 25 DOM
-
2026-06-13days on market $35,000 Active 24 DOM
-
2026-06-10days on market $35,000 Active 22 DOM
-
2026-06-09days on market $35,000 Active 21 DOM
-
2026-06-08days on market $35,000 Active 20 DOM
-
2026-06-07days on market $35,000 Active 19 DOM
-
2026-06-05days on market $35,000 Active 16 DOM
-
2026-06-02days on market $35,000 Active 14 DOM
-
2026-06-01days on market $35,000 Active 13 DOM
-
2026-05-31days on market $35,000 Active 12 DOM
-
2026-05-30days on market $35,000 Active 11 DOM
-
2026-05-19$35,000 Active
-
2025-05-19soldstatus $25,200
-
2025-05-16soldstatus $25,200 Sold 488-char remark
Show marketing remark (488 chars)
All offers must be submitted by buyers agent into Sellers offer management platform PropOffers. com, agents please READ the agent confidential remarks section for additional information on offer submission. No interior access, subfloors are caving in and entry is unsafe, seller not allowing inferior access for showings. Property sold as-is, no utilities, no disclosures or warranties. All offers must be accompanied by proof of funds, earnest money will be required with accepted offer.
-
2025-05-07status Under Contract 488-char remark
Show marketing remark (488 chars)
All offers must be submitted by buyers agent into Sellers offer management platform PropOffers. com, agents please READ the agent confidential remarks section for additional information on offer submission. No interior access, subfloors are caving in and entry is unsafe, seller not allowing inferior access for showings. Property sold as-is, no utilities, no disclosures or warranties. All offers must be accompanied by proof of funds, earnest money will be required with accepted offer.
-
2025-05-07status Take Backups 488-char remark
Show marketing remark (488 chars)
All offers must be submitted by buyers agent into Sellers offer management platform PropOffers. com, agents please READ the agent confidential remarks section for additional information on offer submission. No interior access, subfloors are caving in and entry is unsafe, seller not allowing inferior access for showings. Property sold as-is, no utilities, no disclosures or warranties. All offers must be accompanied by proof of funds, earnest money will be required with accepted offer.
-
2024-10-14status Under Contract 488-char remark
Show marketing remark (488 chars)
All offers must be submitted by buyers agent into Sellers offer management platform PropOffers. com, agents please READ the agent confidential remarks section for additional information on offer submission. No interior access, subfloors are caving in and entry is unsafe, seller not allowing inferior access for showings. Property sold as-is, no utilities, no disclosures or warranties. All offers must be accompanied by proof of funds, earnest money will be required with accepted offer.
-
2024-10-14historical 488-char remark
Show marketing remark (488 chars)
All offers must be submitted by buyers agent into Sellers offer management platform PropOffers. com, agents please READ the agent confidential remarks section for additional information on offer submission. No interior access, subfloors are caving in and entry is unsafe, seller not allowing inferior access for showings. Property sold as-is, no utilities, no disclosures or warranties. All offers must be accompanied by proof of funds, earnest money will be required with accepted offer.
-
2024-09-25$19,900 New Listing 488-char remark
Show marketing remark (488 chars)
All offers must be submitted by buyers agent into Sellers offer management platform PropOffers. com, agents please READ the agent confidential remarks section for additional information on offer submission. No interior access, subfloors are caving in and entry is unsafe, seller not allowing inferior access for showings. Property sold as-is, no utilities, no disclosures or warranties. All offers must be accompanied by proof of funds, earnest money will be required with accepted offer.
-
2007-02-26soldstatus $37,000
ⓘ Source: listings_history table (triggers on properties + properties_extension) + one-shot
backfill from property_details.listing_events for pre-trigger history.
Tax reassessment forecast AR · Resets to sale price
- Current annual tax
- $600 · $50/mo
- Projected year-2 tax
- $600 · $50/mo
- Expected delta
- $0/yr ($0/mo · 0.0%)
ⓘ Screening estimate from a state-policy table — verify with the county assessor before closing.
Climate risk First Street
- Flood 1/10 Low FEMA zone X (unshaded) · 0% chance over 30 yrs
- Wildfire 3/10 Moderate
- Heat 6/10 Major 7 d/yr ≥111°F today · 19 d/yr by 30 yrs out
- Wind 4/10 Moderate 9% chance of damaging wind over 30 yrs
- Air quality 1/10 Low 0 unhealthy d/yr today · 0 by 30 yrs out
Nearby sold comps map
Loading sold comps map…
Walkable amenities ~0.75 mi
Loading nearby amenities…
Taxation est. · year 1
- Rental income
- $12,529
- − Mortgage interest
- −$1,961
- − Property taxes
- −$600
- − Insurance
- −$175
- − Repairs & maintenance
- −$1,002
- − Management
- −$1,002
- − Depreciation
- −$1,018
- Taxable income
- $6,770
- Est. tax owed @ 24.0%
- −$1,625
- After-tax cash flow
- $5,295/yr
For passive investors: Depreciation is non-cash, so a rental often shows a tax loss while cash-flowing — sheltering income. Rental losses are passive: they offset passive income freely, and up to $25,000/yr can offset ordinary (W-2) income if you actively participate and your MAGI is under $100k (phasing out to $0 by $150k); unused losses carry forward. On sale, claimed depreciation is recaptured at up to 25%, and gains may owe capital-gains tax (a 1031 exchange can defer both). Figures are a year-1 estimate at your 24.0% rate — not tax advice; consult a CPA.
Schools (NCES district)
- District
- Hot Springs School District
- NCES district ID
- 0507890
- Math proficiency
- 24% ▼ -15.00%
- Reading proficiency
- 25% ▼ -12.00%
- Median HH income
- $28,817
- Composite
- 19.62/100
- National rank
- #8746
- State rank
- #195 of 238 in AR
Livability — Hot Springs
- Score
- 65/100
- State rank
- #140
- US rank
- #12498
Category grades
Schools grade is shown separately in the Schools card above.
Census & demographics
- Census place
- Hot Springs, AR
- County
- Garland County · 76,414 people
- City population
- 76,414
- Metro
- Hot Springs, AR
- Population (ZIP)
- 47,477
- Household income
- $56,010
- Rent vs Own
- Severe rent burden
- 1442.0
Population outlook (Garland County) Hauer SSP2
- Today (2025)
- 100,343 people
- By 2030
- 101,880 · +1.5%
- By 2040
- 104,804 · +4.4%
- By 2050
- 107,292 · +6.9%
- By 2075
- 113,182 · +12.8%
- By 2100
- 112,247 · +11.9%
Race, ethnicity, and origin ACS 2023
- Neighborhood character
- Predominantly White (79%)
- Race & ethnicity
- White 79% Hispanic / Latino 8% Black 8% Two or more races 6% Asian 1%
- Hispanic origin (detail)
- Mexican 6%
- Common ancestry
- Italian 3% Lithuanian 2% Slovak 2%
- Foreign-born
- 5% · Canada
- Languages at home
- 91% English-only · Spanish 7% Other Indo-European 1%
Political lean MEDSL · Garland
- 2024 margin
- Solid R (+36.2) · D 30.8% · R 67.0% · Other 2.2%
- 2008→2024 swing
- -11.3pp toward R · 2008: -25.0pp · 2024: -36.2pp
- All cycles
- 2024: R+36.2 2020: R+34.0 2016: R+34.1 2012: R+29.9 2008: R+25.0
Not yet ingested
- Civics
- —
Market trends
- HPI YoY
- ▼ -137.67%
- Current HPI
- 268.5228
- Rent YoY
- ▲ 6.43%
- Metro
- Hot Springs, AR
- State GDP YoY
- ▲ 3.80%
- F500 in state
- 10
Industry mix (Fortune 500 HQ in AR)
| Industry | F500 HQs | Revenue |
|---|---|---|
| Retail | 1 | $681B |
|
||
| Food / Agriculture | 1 | $53B |
|
||
| Retail / Energy | 1 | $22B |
|
||
| Transportation / Logistics | 1 | $12B |
|
||
| Energy | 1 | $4B |
|
||
Price history
-5.4% since first listed9 events — show timeline
- 2026-05-19 Listed $35,000 HSBOR
- 2025-05-19 Sold (MLS) $25,200 HSBOR
- 2025-05-16 Sold (MLS) $25,200 CARMLS
- 2025-05-07 Pending — CARMLS
- 2025-05-07 Relisted — CARMLS
- 2024-10-14 Pending — CARMLS
- 2024-10-14 Listing Removed — CARMLS
- 2024-09-25 Listed $19,900 CARMLS
- 2007-02-26 Sold (Public Records) $37,000 Public Records
Property tax history
+47.2%/yrLatest (2025): $600 · +36.3% YoY. Source: county tax records.
Cash-flow waterfall
monthlySold comps — $/sqft
last 12 mo · ≤1 miLoading sold comps…