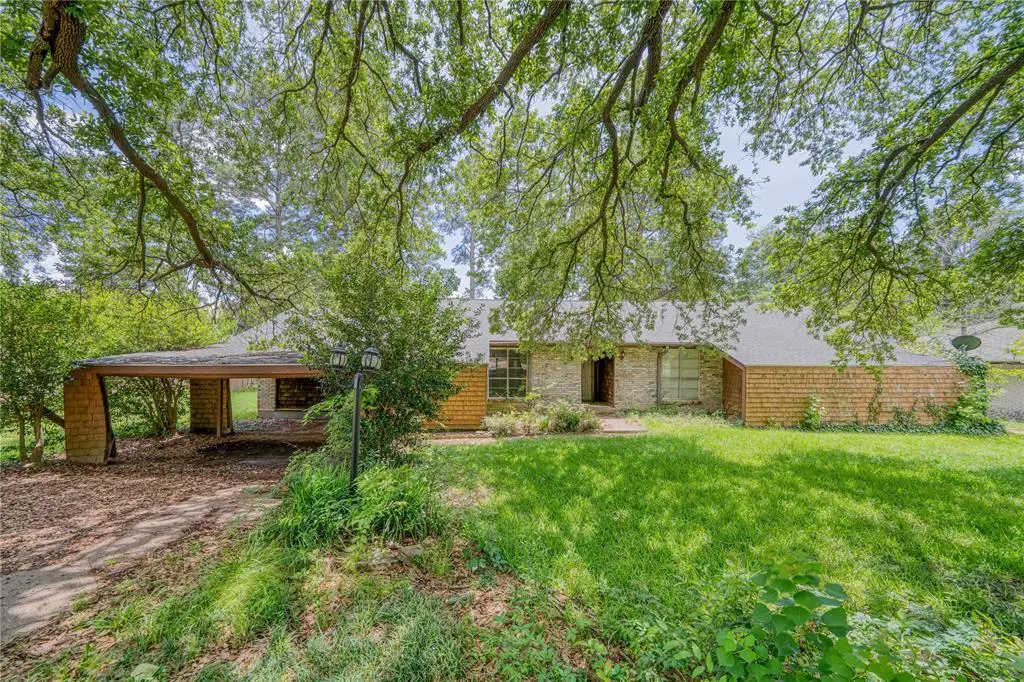
1006 Rikkity Ln · Mount Pleasant, TX
Flood risk 1/10 · Minimal
- FEMA flood zone
- X (unshaded)
- Chance of flooding over 30 yrs
- 0.0%
- Est. flood insurance / yr
- $507 – $1,088
Fire risk 5/10 · Moderate
- Est. fire insurance / yr
- $1,222 – $2,270
Heat risk 7/10 · Major
- Hot days now (above 112°F)
- 7 days/yr
- Hot days in 30 yrs
- 23 days/yr
Wind risk 6/10 · Moderate
- Chance of severe wind over 30 yrs
- 27.0%
Air-quality risk 2/10 · Minimal
- Unhealthy air days now
- 0 days/yr
- Unhealthy air days in 30 yrs
- 1 days/yr
Risk factors via First Street. Map © Google.
Why this score? — see what drove the C grade
The composite is a weighted blend of 9 inputs, each scored 0–100. Each bar is that input's sub-score; the figure is the points it added to the 100-point composite (weight × sub-score).
- Cash flow +18.3/30.0
- ARV discount +15.0/15.0
- 1% rule +5.8/10.0
- DSCR +5.8/10.0
- Livability +3.9/5.0
- Schools +3.7/10.0
- Rent growth +2.5/5.0
- Condition / age +2.5/5.0
- Appreciation +0.0/10.0
$200,000
🖨 Deal sheet 📄 Offer letter ✓ Due diligence
Listing remarks MLS
Beautiful 3 bedroom 2 bathroom home in Mt. Pleasant. Enjoy the spacious open floor plan. This home features granite counter tops, wine fridge, convection microwave, hard wood floors, and french doors looking out to your deck and trees in back yard. Additional room could be used as 4th bedroom, game room, or office. Call to schedule your showing.
Key facts
- Open floor plan
- French doors
- Convection microwave
Tags
Property features AI
Finance
- Other: Municipal utility district: No
- Financial info: Loan type: Treat as clear; No second mortgage listed
- HOA & community: No association
Exterior
- Parking: Covered parking (2 spaces); 1 carport space; Garage present
- Security: No security features listed
- Utilities: Cable available; City sewer
- Home design: Single-family residence; One story; Property attached: Yes
- Construction: Built in 1976
- Exterior features: Lot under half an acre (approximately 0.344 acre); Subdivision: Woodland Village Add; Directions: From Mt. Pleasant, take Hwy 49 East towards Daingerfield. Turn left on Woodland, then right on Rikkity. Property is the 3rd house on the right.
Interior
- Kitchen: Appliances: Other
- Bedrooms: 4 bedrooms (all on the main level)
- Flooring: No flooring details provided
- Bathrooms: 2 full bathrooms
- Heating & cooling: No heating or cooling details provided
- Interior features: Cable TV available; One living area; One dining area; 5 total rooms
- Laundry & utility: No specific laundry details provided
Neighborhood map
What this means for you Summary
Snapshot
- This is a 4-bed/2.0-bath single-family listed at $200k.
Deal economics
- At list price, monthly cash flow is $184 ($2k/yr) — positive.
- The deal already cash-flows at list — no discount required.
- Meets the 1% rule at list price ($2k rent vs $200k).
- Recommended offer: $197k (1.5% below list) — sets the bar for market timing.
- Cap rate 7.4% vs local median 3.5% in Mount Pleasant — top-decile yield for the area; either an underpriced asset or a hidden risk that comps aren't pricing in. Stress-test before assuming the spread holds.
Location & tenants
- Location reads 77/100 on livability (#81 in TX, #2,808 nationally) — a middle-class / working-renter tenant base. Strengths: cost of living A+, housing A+, health & safety A+; Watch: employment C-, amenities D-, commute F.
- Mount Pleasant ISD (town): math 45% / reading 44% proficiency, ranked #291 of 826 in TX (top 35%) — families likely to look elsewhere, expect single-tenant / working-renter base with shorter leases; 74% free/reduced lunch — lower-income household profile, screen leases tightly.
- Zoned schools: E C Brice El (math 47% / reading 52%, grade D, #865 of 4,322 statewide, top 21%, 460 students, 80% FRL).
- Market conditions: 382 active listings in the ZIP; 3 comparable units currently listed for rent nearby; rentals at typical pace (median 21d on market — plan ~3-4 weeks tenant-placement turnaround); 47 units permitted in Titus County in 2024 (10 in 5+ unit buildings).
- At $2,157/mo this rent would consume 46% of the median local household income ($56k/yr) (locally 758% of renters already pay >50% of income on rent) — very limited rent-growth headroom before tenants either downsize or default.
Forward outlook
- Local home prices are declining (-3.0%/yr); year-one equity from $1k of loan paydown is wiped out by about $6k of value loss. Plan a longer hold.
Negotiation context
- It's been on market 23 days — a 2% lower offer ($197k) is reasonable based on typical stale-listing flexibility.
- 6 sale attempts since 10y ago with the ask held roughly flat each time — persistent listings suggest the price (not the market) is what's stuck; bring a comps-based counter.
Risks & watch-outs
- Climate carrying-cost: major wind risk, 27% chance of damaging wind over 30y; moderate wildfire risk; extreme-heat days projected 7→23/yr by 2055 (HVAC capex compounding) — expect insurance premiums to compound above CPI over the hold.
Questions for the listing agent
- Built in 1976 — when were the roof, HVAC, electrical panel, plumbing, and water heater last replaced?
- Is there a deadline driving the sale (1031 exchange, divorce, estate, relocation)? That informs how much negotiation room exists.
- Schools are D-rated, which usually means shorter tenancies and higher turnover. Who's the typical renter profile here, and what's been the actual vacancy rate?
- What's the average days-on-market for RENTAL listings here right now (not sales)? A rising rental-DOM trend means longer vacancies and softer asking-rent achievability than the comps imply.
- What's the recent tenant-quality profile in this submarket — average credit score on applications, eviction rate, late-payment / NSF rate, and stable-employment percentage? A property-management company in the area should have these aggregated.
- How much new for-sale + rental construction is in the pipeline within 1–3 miles? Heavy new supply typically softens prices + rents 12–24 months out; constrained supply supports both.
Investment metrics
- 1% rule
- 1.08% ✓
- Cap rate
- 7.40%
- Cash-on-cash
- 3.94%
- DSCR
- 1.18
- GRM
- 7.7
CMA / ARV
- ARV (on-the-fly)
- $316,470
- Comps found
- 6
Show comp detail 6 sales within ~0.75 mi
| Address | Dist | Beds/Ba | Sqft | Sold | Price | $/sf | Match |
|---|---|---|---|---|---|---|---|
| 1106 S Williams Ave | 0.29mi | 3/2.0 (-1) | 2,212 (-4%) | 1mo | $299,900 | $136 | 74 |
| 909 Holly Hl | 0.22mi | 4/3.0 | 2,615 (+13%) | 10mo | $460,000 | $176 | 56 |
| 804 Fleming Dr | 0.39mi | 4/3.0 | 2,554 (+11%) | 11mo | $319,000 | $125 | 51 |
| 1210 E 3rd St | 0.68mi | 5/3.5 (+1) | 2,284 (-1%) | 10mo | $268,900 | $118 | 47 |
| 1108 S Williams Ave | 0.31mi | 3/3.0 (-1) | 2,511 (+9%) | 20mo | $344,000 | $137 | 45 |
| 810 Alexander Rd | 0.67mi | 4/2.0 | 1,997 (-14%) | 6mo | $329,000 | $165 | 41 |
Match score weights: distance 35% · size 25% · config 20% · recency 20%. Top-matched comps best support the ARV.
Projected returns pro-forma
-3.0% appreciation · 3.0% rent growth · sell at horizon
- IRR
- -10.1%
- Equity multiple
- 0.63×
- Total profit
- $-20,583
- Equity at exit
- $29,821
- IRR
- -0.6%
- Equity multiple
- 0.96×
- Total profit
- $-2,372
- Equity at exit
- $17,292
Cash invested: $56,000 (down + closing). Projections, not guarantees.
Landlord ↔ Tenant lean methodology
- Overall (STATE)
- 87 Strongly Landlord-Friendly
- State Texas
- 87 Strongly Landlord-Friendly · R+5
- County
- — inherits STATE
- City
- — inherits STATE
ZIP-level market 75455
- Home prices YoY
- -27.0%
- Active inventory
- 382
- Price-to-rent
- 7.7×
Monthly cashflow live
- Estimated rent
- $2,157 medium interval (Pro) →
- Mortgage (P&I)
- −$1,049
- Tax from tax record
- −$388 /mo · $4,653/yr
- Insurance
- −$83
- HOA
- −$0
- Vacancy / Maint / Mgmt
- −$453
- Net cashflow
- $184
Break-even live
UW: 25.0% down · 7.5% · 30yr · 1.5% tax · 5.0% vac · 8.0% maint · 8.0% mgmt
Financing live
Cash to close
- Down payment
- $50,000
- Closing costs
- $6,000
- Reserves months
- —
- Total cash needed
- —
Loan-product check · same deal, 3 products live
Conventional
25% down · 7.5% · 30yr
- Down + closing
- —
- Monthly P&I
- —
- Monthly cashflow
- —
- DSCR
- —
- Eligible?
- —
Personal DTI + credit; lowest rate.
DSCR
20% down · 8.5% · 30yr
- Down + closing
- —
- Monthly P&I
- —
- Monthly cashflow
- —
- DSCR
- —
- Eligible?
- —
No personal income docs; deal must DSCR.
Hard money
10% down · 12.0% · 12mo
- Down + closing
- —
- Monthly P&I
- —
- Monthly cashflow
- —
- DSCR
- —
- Eligible?
- —
Short-term bridge; refi at stabilization.
Rent comps 3 comps
| Address | Beds | Baths | Sqft | Rent | $/sqft | DOM | Units | Dist |
|---|---|---|---|---|---|---|---|---|
| 410 E 4th St Mt Pleasant, TX | 3.0 | 2.5 | 2953 | $2,250 | $0.76 | 20d | 1 | 0.93mi |
| 111 W Holland St Mount Pleasant, TX | 3.0 | 1.0 | 1608 | $1,800 | $1.12 | 20d | 1 | 0.96mi |
| 2304 Deanna Ave Mount Pleasant, TX | 4.0 | 3.0 | 2830 | $2,450 | $0.87 | 43d | 1 | 1.15mi |
Listing history 30 events
-
2026-06-19days on market $200,000 Active 23 DOM
-
2026-06-18days on market $200,000 Active 22 DOM
-
2026-06-17days on market $200,000 Active 21 DOM
-
2026-06-16days on market $200,000 Active 20 DOM
-
2026-06-15days on market $200,000 Active 19 DOM
-
2026-06-14days on market $200,000 Active 17 DOM
-
2026-06-12days on market $200,000 Active 16 DOM
-
2026-06-09days on market $200,000 Active 13 DOM
-
2026-06-08days on market $200,000 Active 12 DOM
-
2026-06-07days on market $200,000 Active 11 DOM
-
2026-06-07days on market $200,000 Active 10 DOM
-
2026-06-03days on market $200,000 Active 7 DOM
-
2026-06-02days on market $200,000 Active 6 DOM
-
2026-06-01days on market $200,000 Active 5 DOM
-
2026-05-31days on market $200,000 Active 4 DOM
-
2026-05-30days on market $200,000 Active 3 DOM
-
2026-05-27$200,000 Active
-
2026-04-09historical
-
2026-03-11price $225,000
-
2026-02-24status Active
-
2026-02-18$249,999 Active
-
2020-09-01soldstatus
-
2020-08-31soldstatus 347-char remark
Show marketing remark (347 chars)
Beautiful 3 bedroom 2 bathroom home in Mt. Pleasant. Enjoy the spacious open floor plan. This home features granite counter tops, wine fridge, convection microwave, hard wood floors, and french doors looking out to your deck and trees in back yard. Additional room could be used as 4th bedroom, game room, or office. Call to schedule your showing.
-
2020-08-31soldstatus
Show marketing remark (347 chars)
Beautiful 3 bedroom 2 bathroom home in Mt. Pleasant. Enjoy the spacious open floor plan. This home features granite counter tops, wine fridge, convection microwave, hard wood floors, and french doors looking out to your deck and trees in back yard. Additional room could be used as 4th bedroom, game room, or office. Call to schedule your showing.
-
2020-07-15$172,000 347-char remark
Show marketing remark (347 chars)
Beautiful 3 bedroom 2 bathroom home in Mt. Pleasant. Enjoy the spacious open floor plan. This home features granite counter tops, wine fridge, convection microwave, hard wood floors, and french doors looking out to your deck and trees in back yard. Additional room could be used as 4th bedroom, game room, or office. Call to schedule your showing.
-
2020-06-30$172,000
-
2016-07-14soldstatus
-
2016-07-13soldstatus
-
2016-06-07$139,900
-
2008-08-20soldstatus
ⓘ Source: listings_history table (triggers on properties + properties_extension) + one-shot
backfill from property_details.listing_events for pre-trigger history.
Tax reassessment forecast TX · Resets to sale price
- Current annual tax
- $4,653 · $388/mo
- Projected year-2 tax
- $4,653 · $388/mo
- Expected delta
- $0/yr ($0/mo · 0.0%)
ⓘ Screening estimate from a state-policy table — verify with the county assessor before closing.
Climate risk First Street
- Flood 1/10 Low FEMA zone X (unshaded) · 0% chance over 30 yrs
- Wildfire 5/10 Major
- Heat 7/10 Severe 7 d/yr ≥112°F today · 23 d/yr by 30 yrs out
- Wind 6/10 Major 27% chance of damaging wind over 30 yrs
- Air quality 2/10 Low 0 unhealthy d/yr today · 1 by 30 yrs out
Nearby sold comps map
Loading sold comps map…
Walkable amenities ~0.75 mi
Loading nearby amenities…
Taxation est. · year 1
- Rental income
- $25,879
- − Mortgage interest
- −$11,203
- − Property taxes
- −$4,653
- − Insurance
- −$1,000
- − Repairs & maintenance
- −$2,070
- − Management
- −$2,070
- − Depreciation
- −$5,818
- Taxable loss
- −$936
- Est. tax savings @ 24.0%
- +$225
- After-tax cash flow
- $2,430/yr
For passive investors: Depreciation is non-cash, so a rental often shows a tax loss while cash-flowing — sheltering income. Rental losses are passive: they offset passive income freely, and up to $25,000/yr can offset ordinary (W-2) income if you actively participate and your MAGI is under $100k (phasing out to $0 by $150k); unused losses carry forward. On sale, claimed depreciation is recaptured at up to 25%, and gains may owe capital-gains tax (a 1031 exchange can defer both). Figures are a year-1 estimate at your 24.0% rate — not tax advice; consult a CPA.
Schools (NCES district)
- District
- Mount Pleasant ISD
- NCES district ID
- 4831760
- Math proficiency
- 45% ▼ -7.00%
- Reading proficiency
- 44% ▲ 2.00%
- Median HH income
- $40,642
- Composite
- 37.35/100
- National rank
- #4437
- State rank
- #291 of 826 in TX
Livability — Mount Pleasant
- Score
- 77/100
- State rank
- #81
- US rank
- #2808
Category grades
Schools grade is shown separately in the Schools card above.
Census & demographics
- Census place
- Mount Pleasant, TX
- County
- Titus County · 26,903 people
- City population
- 26,903
- Metro
- Mount Pleasant, TX
- Population (ZIP)
- 26,903
- Household income
- $56,163
- Rent vs Own
- Severe rent burden
- 758.0
Population outlook (Titus County) Hauer SSP2
- Today (2025)
- 33,205 people
- By 2030
- 33,187 · -0.1%
- By 2040
- 32,931 · -0.8%
- By 2050
- 32,231 · -2.9%
- By 2075
- 29,507 · -11.1%
- By 2100
- 25,369 · -23.6%
Race, ethnicity, and origin ACS 2023
- Neighborhood character
- Diverse neighborhood (Simpson 0.61)
- Race & ethnicity
- Hispanic / Latino 45% White 42% Two or more races 15% Black 10% Asian 1%
- Hispanic origin (detail)
- Mexican 42%
- Common ancestry
- Lithuanian 1% Slovak 1% Italian 1%
- Foreign-born
- 18% · Canada, Vietnam
- Languages at home
- 61% English-only · Spanish 37% Vietnamese 1%
Political lean MEDSL · Titus
- 2024 margin
- Solid R (+54.7) · D 22.3% · R 77.0%
- 2008→2024 swing
- -23.5pp toward R · 2008: -31.2pp · 2024: -54.7pp
- All cycles
- 2024: R+54.7 2020: R+44.7 2016: R+42.1 2012: R+39.0 2008: R+31.2
Not yet ingested
- Civics
- —
Market trends
- HPI YoY
- ▼ -79.66%
- Current HPI
- 215.4205
- Rent YoY
- —
- Metro
- Mount Pleasant, TX
- State GDP YoY
- ▲ 3.95%
- F500 in state
- 110
Industry mix (Fortune 500 HQ in TX)
| Industry | F500 HQs | Revenue |
|---|---|---|
| Energy | 16 | $1,198B |
|
||
| Technology | 5 | $198B |
|
||
| Engineering / Construction | 4 | $72B |
|
||
| Energy Services | 3 | $60B |
|
||
| Utilities | 3 | $41B |
|
||
| Healthcare | 2 | $330B |
|
||
Price history
+43.0% since first listed14 events — show timeline
- 2026-05-27 Listed $200,000 NTREIS
- 2026-04-09 Listing Removed — NTREIS
- 2026-03-11 Price Changed $225,000 NTREIS
- 2026-02-24 Relisted — NTREIS
- 2026-02-18 Listed $249,999 NTREIS
- 2020-09-01 Sold (Public Records) — Public Records
- 2020-08-31 Sold (MLS) — LAAR
- 2020-08-31 Sold (MLS) — GTAR
- 2020-07-15 Listed $172,000 GTAR
- 2020-06-30 Listed $172,000 LAAR
- 2016-07-14 Sold (Public Records) — Public Records
- 2016-07-13 Sold (MLS) — GTAR
- 2016-06-07 Listed $139,900 GTAR
- 2008-08-20 Sold (Public Records) — Public Records
Property tax history
+5.3%/yrLatest (2025): $4,653 · +8.0% YoY. Source: county tax records.
Cash-flow waterfall
monthlySold comps — $/sqft
last 12 mo · ≤1 miLoading sold comps…