26890 Cross Lake Rd · Mission Creek, MN
Flood risk 1/10 · Minimal
- FEMA flood zone
- X (unshaded)
- Chance of flooding over 30 yrs
- 0.0%
- Est. flood insurance / yr
- $507 – $1,088
Fire risk 4/10 · Minor
- Est. fire insurance / yr
- $888 – $1,650
Heat risk 1/10 · Minimal
- Hot days now (above 97°F)
- 7 days/yr
- Hot days in 30 yrs
- 13 days/yr
Wind risk 1/10 · Minimal
- Chance of severe wind over 30 yrs
- —
Air-quality risk 2/10 · Minimal
- Unhealthy air days now
- 1 days/yr
- Unhealthy air days in 30 yrs
- 1 days/yr
Risk factors via First Street. Map © Google.
Why this score? — see what drove the D- grade
The composite is a weighted blend of 9 inputs, each scored 0–100. Each bar is that input's sub-score; the figure is the points it added to the 100-point composite (weight × sub-score).
- Appreciation +10.0/10.0
- Cash flow +7.6/30.0
- ARV discount +7.5/15.0
- Schools +3.5/10.0
- Rent growth +2.5/5.0
- Livability +2.5/5.0
- Condition / age +2.5/5.0
- DSCR +1.8/10.0
- 1% rule +1.6/10.0
$189,000
🖨 Deal sheet 📄 Offer letter ✓ Due diligence
Listing remarks
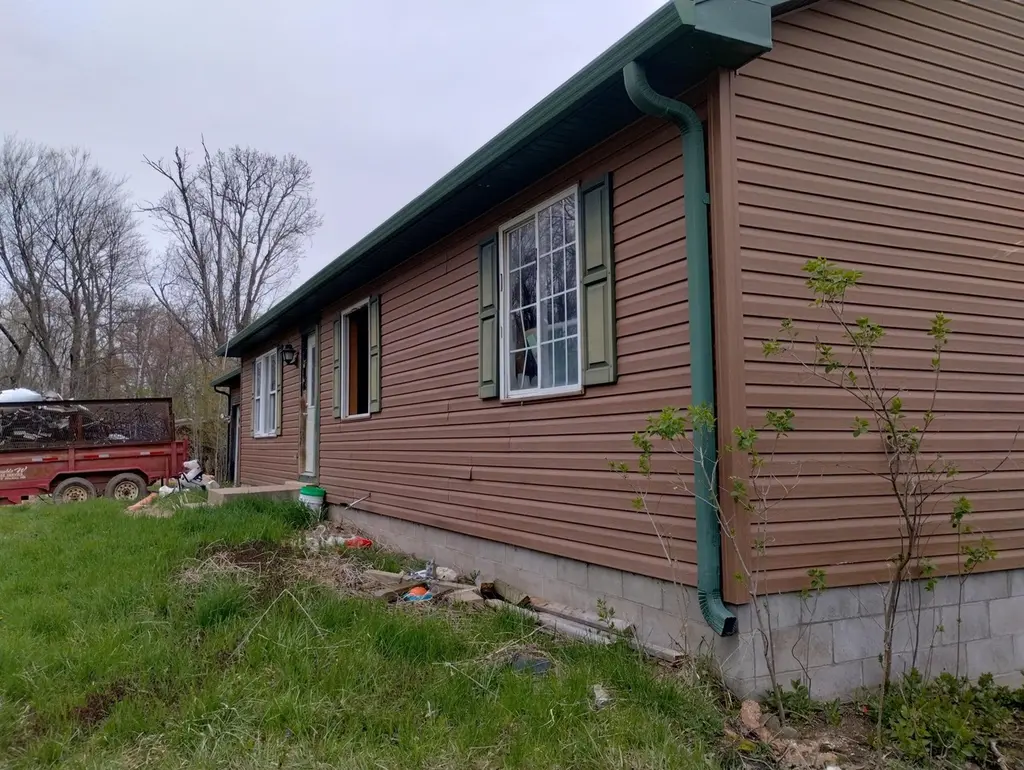
Set back on an expansive, private acreage parcel, this peaceful single-level home offers relaxed rural living in a quiet, friendly neighborhood. Wide natural views and mature trees create a serene backdrop perfect for morning coffee on the porch or evening walks. Inside, the layout is designed for easy, comfortable daily living with a private master suite featuring its own bath and an additional full bath for guests. Thoughtful finishes, central comfort systems, and durable exterior materials make maintenance simple so you can spend time enjoying the land and fresh air. This is a calm, restorative property where slow weekends, outdoor hobbies, and peaceful privacy feel effortless.
Key facts
- Wide natural views
- Private master suite
- Thoughtful finishes
Tags
Property features AI
Exterior
- Parking: Attached 2-car garage
- Utilities: Well water; Septic system (not compliant); Propane
- Home design: Residential property; One-level design; Entry and living spaces on main level
- Construction: Brick/mortar foundation; Built area includes 1,300 sq ft main level with a total building area of 2,600 sq ft
- Exterior features: Vinyl exterior; Lot of about 10 acres (dimensions approximately 333 x 1314)
Interior
- Kitchen: Kitchen on main level
- Bedrooms: 3 bedrooms (all on main level)
- Bathrooms: 2 full bathrooms (main level)
- Heating & cooling: Forced air heating; No central air cooling
- Interior features: Full basement
- Laundry & utility: Well water; Propane fuel
Neighborhood map
What this means for you Summary
Snapshot
- This is a 3-bed/2.0-bath single-family listed at $189k.
Deal economics
- At list price, monthly cash flow is $-223 ($-3k/yr) — negative.
- To cash-flow at today's rent, offer at most $150k (20.8% below list).
- To meet the 1% rule (rent ≥ 1% of price), the offer needs to be $125k (34.0% below list).
- Recommended offer: $125k (34.0% below list) — sets the bar for 1% rule.
Location & tenants
- Location reads: area grade D — affects rentability + tenant quality, not the cash-flow math above.
- Pine City Public School District (town): math 34% / reading 47% proficiency, ranked #222 of 301 in MN (top 74%) — families likely to look elsewhere, expect single-tenant / working-renter base with shorter leases.
- Market conditions: 51 active listings in the ZIP; 116 units permitted in Pine County in 2024 (0 in 5+ unit buildings).
Forward outlook
- In year one you build about $20k of equity ($1k loan paydown + $19k appreciation (10.0% local appreciation)).
- Pine County population projected at -24% by 2050 — secular population decline; favor cash flow + early exit over multi-decade hold.
- By year 2, paydown + projected appreciation supports a ~$32k cash-out refi (75% LTV) — recoverable capital for the next deal without selling this one.
Negotiation context
- Only 6 days on market — expect competitive offers; lowballing is unlikely to land.
- Current owner paid $19k; list at $189k implies a 895% gain — meaningful room to come down on a strong offer.
Questions for the listing agent
- What do current leases actually rent for vs. the listed asking? Can we see a recent rent roll and the last 12 months of T-12 income?
- Is there a deadline driving the sale (1031 exchange, divorce, estate, relocation)? That informs how much negotiation room exists.
- The area grade is low — what's the realistic commute time and amenity access for the typical tenant pool here? Any planned neighborhood developments (good or bad) we should know about?
- What's the average days-on-market for RENTAL listings here right now (not sales)? A rising rental-DOM trend means longer vacancies and softer asking-rent achievability than the comps imply.
- What's the recent tenant-quality profile in this submarket — average credit score on applications, eviction rate, late-payment / NSF rate, and stable-employment percentage? A property-management company in the area should have these aggregated.
- How much new for-sale + rental construction is in the pipeline within 1–3 miles? Heavy new supply typically softens prices + rents 12–24 months out; constrained supply supports both.
Investment metrics
- 1% rule
- 0.66% ✗
- Cap rate
- 4.88%
- Cash-on-cash
- -5.06%
- DSCR
- 0.78
- GRM
- 12.6
CMA / ARV
No comps found within radius.
Projected returns pro-forma
10.0% appreciation · 3.0% rent growth · sell at horizon
- IRR
- 20.7%
- Equity multiple
- 2.68×
- Total profit
- $88,691
- Equity at exit
- $170,266
- IRR
- 18.8%
- Equity multiple
- 6.14×
- Total profit
- $272,267
- Equity at exit
- $367,185
Cash invested: $52,920 (down + closing). Projections, not guarantees.
Landlord ↔ Tenant lean methodology
- Overall (STATE)
- 46 Balanced
- State Minnesota
- 46 Balanced · D+2
- County
- — inherits STATE
- City
- — inherits STATE
ZIP-level market 55037
- Home prices YoY
- 12.4%
- Active inventory
- 51
- Price-to-rent
- 12.6×
Monthly cashflow live
- Estimated rent
- $1,247 medium interval (Pro) →
- Mortgage (P&I)
- −$991
- Tax from tax record
- −$138 /mo · $1,656/yr
- Insurance
- −$79
- HOA
- −$0
- Vacancy / Maint / Mgmt
- −$262
- Net cashflow
- $-223
Break-even live
UW: 25.0% down · 7.5% · 30yr · 1.5% tax · 5.0% vac · 8.0% maint · 8.0% mgmt
Financing live
Cash to close
- Down payment
- $47,250
- Closing costs
- $5,670
- Reserves months
- —
- Total cash needed
- —
Loan-product check · same deal, 3 products live
Conventional
25% down · 7.5% · 30yr
- Down + closing
- —
- Monthly P&I
- —
- Monthly cashflow
- —
- DSCR
- —
- Eligible?
- —
Personal DTI + credit; lowest rate.
DSCR
20% down · 8.5% · 30yr
- Down + closing
- —
- Monthly P&I
- —
- Monthly cashflow
- —
- DSCR
- —
- Eligible?
- —
No personal income docs; deal must DSCR.
Hard money
10% down · 12.0% · 12mo
- Down + closing
- —
- Monthly P&I
- —
- Monthly cashflow
- —
- DSCR
- —
- Eligible?
- —
Short-term bridge; refi at stabilization.
Listing history 5 events
-
2026-05-31days on market $189,000 Active 6 DOM
-
2026-05-31days on market $189,000 Active 5 DOM
-
2026-05-25$189,000 Active
-
1999-09-15soldstatus $19,000
-
1999-08-15soldstatus $19,000
ⓘ Source: listings_history table (triggers on properties + properties_extension) + one-shot
backfill from property_details.listing_events for pre-trigger history.
Tax reassessment forecast MN · Partial reset (capped growth)
- Current annual tax
- $1,656 · $138/mo
- Projected year-2 tax
- $1,886 · $157/mo
- Expected delta
- +$230/yr (+$19/mo · 13.9%)
ⓘ Screening estimate from a state-policy table — verify with the county assessor before closing.
Climate risk First Street
- Flood 1/10 Low FEMA zone X (unshaded) · 0% chance over 30 yrs
- Wildfire 4/10 Moderate
- Heat 1/10 Low 7 d/yr ≥97°F today · 13 d/yr by 30 yrs out
- Wind 1/10 Low
- Air quality 2/10 Low 1 unhealthy d/yr today · 1 by 30 yrs out
Nearby sold comps map
Loading sold comps map…
Walkable amenities ~0.75 mi
Loading nearby amenities…
Taxation est. · year 1
- Rental income
- $14,961
- − Mortgage interest
- −$10,587
- − Property taxes
- −$1,656
- − Insurance
- −$945
- − Repairs & maintenance
- −$1,197
- − Management
- −$1,197
- − Depreciation
- −$5,498
- Taxable loss
- −$6,119
- Est. tax savings @ 24.0%
- +$1,469
- After-tax cash flow
- $-1,207/yr
For passive investors: Depreciation is non-cash, so a rental often shows a tax loss while cash-flowing — sheltering income. Rental losses are passive: they offset passive income freely, and up to $25,000/yr can offset ordinary (W-2) income if you actively participate and your MAGI is under $100k (phasing out to $0 by $150k); unused losses carry forward. On sale, claimed depreciation is recaptured at up to 25%, and gains may owe capital-gains tax (a 1031 exchange can defer both). Figures are a year-1 estimate at your 24.0% rate — not tax advice; consult a CPA.
Schools (NCES district)
- District
- Pine City Public School District
- NCES district ID
- 2728380
- Math proficiency
- 34% ▼ -15.00%
- Reading proficiency
- 47% ▼ -9.00%
- Median HH income
- $47,606
- Composite
- 34.63/100
- National rank
- #5148
- State rank
- #222 of 301 in MN
Livability — Mission Creek
No livability data for this city. (Only ~50 U.S. cities are tracked.)
Census & demographics
- Population (ZIP)
- 5,077
Population outlook (Pine County) Hauer SSP2
- Today (2025)
- 27,565 people
- By 2030
- 26,567 · -3.6%
- By 2040
- 23,878 · -13.4%
- By 2050
- 20,931 · -24.1%
- By 2075
- 15,372 · -44.2%
- By 2100
- 11,032 · -60.0%
Race, ethnicity, and origin ACS 2023
- Neighborhood character
- Predominantly White (83%)
- Race & ethnicity
- White 83% Two or more races 8% Native American 7% Hispanic / Latino 4%
- Common ancestry
- Portuguese 8% Romanian 4% Lithuanian 2%
- Foreign-born
- 1% · Canada
- Languages at home
- 96% English-only · Spanish 2%
Political lean MEDSL · Pine
- 2024 margin
- Solid R (+35.2) · D 31.6% · R 66.8% · Other 1.6%
- 2008→2024 swing
- -36.7pp toward R · 2008: 1.5pp · 2024: -35.2pp
- All cycles
- 2024: R+35.2 2020: R+30.2 2016: R+26.3 2012: R+0.7 2008: D+1.5
Not yet ingested
- Civics
- —
Market trends
- HPI YoY
- ▲ 27.68%
- Current HPI
- 251.5378
- Rent YoY
- —
- Metro
- —
- State GDP YoY
- ▲ 2.41%
- F500 in state
- 34
Industry mix (Fortune 500 HQ in MN)
| Industry | F500 HQs | Revenue |
|---|---|---|
| Healthcare | 2 | $407B |
|
||
| Retail | 2 | $150B |
|
||
| Consumer Goods | 2 | $32B |
|
||
| Industrial Machinery | 2 | $6B |
|
||
| Agriculture | 1 | $40B |
|
||
| Healthcare / Medical Devices | 1 | $32B |
|
||
Price history
+894.7% since first listed3 events — show timeline
- 2026-05-25 Listed $189,000 NORTHSTARMLS as Distributed by MLS Grid
- 1999-09-15 Sold (Public Records) $19,000 Public Records
- 1999-08-15 Sold (Public Records) $19,000 Public Records
Property tax history
+1.1%/yrLatest (2025): $1,656 · +3.9% YoY. Source: county tax records.
Cash-flow waterfall
monthlySold comps — $/sqft
last 12 mo · ≤1 miLoading sold comps…