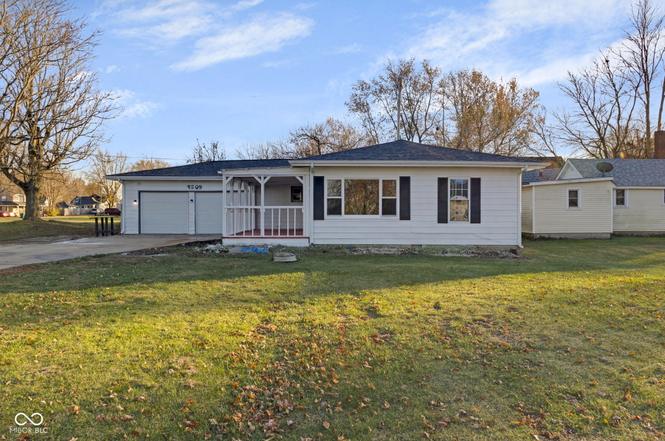
4509 E 400 S · Hemlock, IN
Flood risk 1/10 · Minimal
- FEMA flood zone
- X (unshaded)
- Chance of flooding over 30 yrs
- 0.0%
- Est. flood insurance / yr
- $507 – $1,088
Fire risk 1/10 · Minimal
- Est. fire insurance / yr
- $717 – $1,331
Heat risk 3/10 · Minor
- Hot days now (above 101°F)
- 7 days/yr
- Hot days in 30 yrs
- 17 days/yr
Wind risk 2/10 · Minimal
- Chance of severe wind over 30 yrs
- 1.0%
Air-quality risk 3/10 · Minor
- Unhealthy air days now
- 2 days/yr
- Unhealthy air days in 30 yrs
- 3 days/yr
Risk factors via First Street. Map © Google.
Why this score? — see what drove the D grade
The composite is a weighted blend of 9 inputs, each scored 0–100. Each bar is that input's sub-score; the figure is the points it added to the 100-point composite (weight × sub-score).
- Cash flow +13.9/30.0
- ARV discount +9.8/15.0
- Appreciation +5.0/10.0
- DSCR +4.2/10.0
- 1% rule +2.6/10.0
- Rent growth +2.5/5.0
- Livability +2.5/5.0
- Condition / age +2.5/5.0
- Schools +1.8/10.0
$158,900
🖨 Deal sheet (PDF) 📄 Offer letter ✓ Due diligence
Listing remarks
Don't miss this beautifully updated 3-bedroom, 2-bath home featuring a 2-car garage and upgrades throughout. The entire property has been transformed with new flooring, a brand-new kitchen, new kitchen appliances, updated electrical and plumbing, new garage doors, new roof, and fresh interior and exterior paint. This home offers modern finishes, spacious living areas, and quality craftsmanship from top to bottom. With nothing left to do but move in, this is the perfect opportunity to own a turnkey home that truly stands out.
Key facts
- Updated electrical
- New garage doors
- Updated kitchen
Tags
Property features AI
Exterior
- Parking: Attached 2-car garage with automatic opener
- Utilities: Municipal sewer connected; Private water source
- Home design: Single family residence; One level
- Construction: Vinyl siding; Crawl space foundation
- Exterior features: Storage shed; Lot under 1/4 acre (approximately 0.21 acres)
Interior
- Kitchen: Dishwasher; Microwave; Electric oven; Refrigerator
- Bedrooms: 3 bedrooms on the main level (approx. 11 x 11, 11 x 11, 11 x 12)
- Bathrooms: 2 full bathrooms (both on the main level)
- Heating & cooling: Natural gas heating; Central air conditioning
- Interior features: Eat-in kitchen; Living room (approx. 25 x 23)
- Laundry & utility: Water heater; Owned water softener
Neighborhood map
What this means for you Summary
Snapshot
- This is a 3-bed/1.5-bath single-family listed at $159k.
Deal economics
- At list price, monthly cash flow is $17 ($207/yr) — positive.
- The deal already cash-flows at list — no discount required.
- To meet the 1% rule (rent ≥ 1% of price), the offer needs to be $121k (23.9% below list).
- Recommended offer: $121k (23.9% below list) — sets the bar for 1% rule.
Location & tenants
- Location reads: area grade D — affects rentability + tenant quality, not the cash-flow math above.
- Taylor Community School Corporation (rural): math 17% / reading 23% proficiency, ranked #272 of 301 in IN (top 90%) — low school quality limits family demand, transient renter base, plan for 1-2y turnover.
- Zoned schools: Taylor Elementary School (math 19% / reading 19%, grade F, #829 of 994 statewide, top 84%, 513 students, 78% FRL); Taylor Middle School (math 13% / reading 20%, grade F, #287 of 330 statewide, top 88%, 413 students, 76% FRL); Taylor High School (math 32% / reading 52%, grade F, #197 of 369 statewide, top 57%, 374 students, 67% FRL) — zoned schools average 74% FRL vs 45% district-wide (29 pts higher); higher-poverty schools than district average — tighter screening recommended.
- Market conditions: 2 active listings in the ZIP; 194 units permitted in Howard County in 2024 (0 in 5+ unit buildings).
Forward outlook
- In year one you build about $6k of equity ($1k loan paydown + $5k appreciation (3.0% local appreciation)).
- Howard County population projected at -11% by 2050 — secular population decline; favor cash flow + early exit over multi-decade hold.
- At projected returns (3.0% appreciation + 3.0% rent growth), your $44k cash investment doubles in ~6 years — after that, you're playing with house money.
- By year 6, paydown + projected appreciation supports a ~$31k cash-out refi (75% LTV) — recoverable capital for the next deal without selling this one.
Negotiation context
- It's been on market 183 days — a 12% lower offer ($140k) is reasonable based on typical stale-listing flexibility.
- 3 sale attempts; this cycle's ask has dropped $36k (19%) from the opening price — seller is motivated, your offer sets the floor, not the list.
- Current owner paid $70k; list at $159k implies a 129% gain — meaningful room to come down on a strong offer.
Questions for the listing agent
- It's been on market 183 days. Have you received any prior offers? Is the seller open to a 24% concession, seller financing, or rate buy-down credit?
- Built in 1979 — when were the roof, HVAC, electrical panel, plumbing, and water heater last replaced?
- Why hasn't it sold? Are there any deal-killer items the seller is aware of (foundation, flood, title, zoning, code violations)?
- Is there a deadline driving the sale (1031 exchange, divorce, estate, relocation)? That informs how much negotiation room exists.
- The area grade is low — what's the realistic commute time and amenity access for the typical tenant pool here? Any planned neighborhood developments (good or bad) we should know about?
- What's the average days-on-market for RENTAL listings here right now (not sales)? A rising rental-DOM trend means longer vacancies and softer asking-rent achievability than the comps imply.
- What's the recent tenant-quality profile in this submarket — average credit score on applications, eviction rate, late-payment / NSF rate, and stable-employment percentage? A property-management company in the area should have these aggregated.
- How much new for-sale + rental construction is in the pipeline within 1–3 miles? Heavy new supply typically softens prices + rents 12–24 months out; constrained supply supports both.
Investment metrics
- 1% rule
- 0.76% ✗
- Cap rate
- 6.42%
- Cash-on-cash
- 0.46%
- DSCR
- 1.02
- GRM
- 10.9
CMA / ARV
- ARV (on-the-fly)
- $167,628
- Comps found
- 3
Show comp detail 3 sales within ~0.75 mi
| Address | Dist | Beds/Ba | Sqft | Sold | Price | $/sf | Match |
|---|---|---|---|---|---|---|---|
| 4480 E 400 South | 0.04mi | 3/1.0 | 1,432 (+4%) | 2mo | $175,000 | $122 | 87 |
| 3923 E 400 South | 0.60mi | 3/1.5 | 1,312 (-4%) | 6mo | $225,000 | $171 | 59 |
| 4180 S 450 East | 0.16mi | 4/1.0 (+1) | 1,568 (+14%) | 11mo | $190,000 | $121 | 52 |
Match score weights: distance 35% · size 25% · config 20% · recency 20%. Top-matched comps best support the ARV.
Projected returns pro-forma
3.0% appreciation · 3.0% rent growth · sell at horizon
- IRR
- 7.9%
- Equity multiple
- 1.45×
- Total profit
- $20,158
- Equity at exit
- $71,448
- IRR
- 10.5%
- Equity multiple
- 2.58×
- Total profit
- $70,140
- Equity at exit
- $110,110
Cash invested: $44,492 (down + closing). Projections, not guarantees.
Landlord ↔ Tenant lean methodology
- Overall (STATE)
- 90 Strongly Landlord-Friendly
- State Indiana
- 90 Strongly Landlord-Friendly · R+11
- County
- — inherits STATE
- City
- — inherits STATE
ZIP-level market 46937
- Active inventory
- 2
- Price-to-rent
- 10.9×
Monthly cashflow live
- Estimated rent
- $1,209 medium interval (Pro) →
- Mortgage (P&I)
- −$833
- Tax from tax record
- −$39 /mo · $465/yr
- Insurance
- −$66
- HOA
- −$0
- Vacancy / Maint / Mgmt
- −$254
- Net cashflow
- $17
Break-even live
Sensitivity live
| Price | -10% $107 | -5% $62 | +0% $17 | +5% $-28 | +10% $-73 |
|---|---|---|---|---|---|
| Rent | -10% $-78 | -5% $-31 | +0% $17 | +5% $65 | +10% $113 |
| Rate | -1.0pp $97 | -0.5pp $58 | base $17 | +0.5pp $-24 | +1.0pp $-66 |
UW: 25.0% down · 7.5% · 30yr · 1.5% tax · 5.0% vac · 8.0% maint · 8.0% mgmt
Financing live
Cash to close
- Down payment
- $39,725
- Closing costs
- $4,767
- Reserves months
- —
- Total cash needed
- —
Loan-product check · same deal, 3 products live
Conventional
25% down · 7.5% · 30yr
- Down + closing
- —
- Monthly P&I
- —
- Monthly cashflow
- —
- DSCR
- —
- Eligible?
- —
Personal DTI + credit; lowest rate.
DSCR
20% down · 8.5% · 30yr
- Down + closing
- —
- Monthly P&I
- —
- Monthly cashflow
- —
- DSCR
- —
- Eligible?
- —
No personal income docs; deal must DSCR.
Hard money
10% down · 12.0% · 12mo
- Down + closing
- —
- Monthly P&I
- —
- Monthly cashflow
- —
- DSCR
- —
- Eligible?
- —
Short-term bridge; refi at stabilization.
Listing history 22 events
-
2026-06-14statusdays on market $158,900 Pending 183 DOM
-
2026-06-13pricedays on market $158,900 Active 182 DOM
-
2026-06-10days on market $168,900 Active 180 DOM
-
2026-06-09days on market $168,900 Active 179 DOM
-
2026-06-08days on market $168,900 Active 178 DOM
-
2026-06-07days on market $168,900 Active 177 DOM
-
2026-06-05pricedays on market $168,900 Active 174 DOM
-
2026-06-03days on market $179,999 Active 173 DOM
-
2026-06-02days on market $179,999 Active 172 DOM
-
2026-06-01days on market $179,999 Active 171 DOM
-
2026-05-31days on market $179,999 Active 170 DOM
-
2026-05-30days on market $179,999 Active 169 DOM
-
2026-05-28status Active
-
2026-05-28price $179,999
-
2026-05-14status Active
-
2026-04-17price $175,999
-
2026-04-01price $180,999
-
2026-03-10price $185,999
-
2026-01-15price $190,999
-
2025-12-11price $193,000
-
2025-11-14$195,000 Active
-
2000-11-16soldstatus $69,500
ⓘ Source: listings_history table (triggers on properties + properties_extension) + one-shot
backfill from property_details.listing_events for pre-trigger history.
Tax reassessment forecast IN · Partial reset (capped growth)
- Current annual tax
- $465 · $39/mo
- Projected year-2 tax
- $908 · $76/mo
- Expected delta
- +$443/yr (+$37/mo · 95.1%)
ⓘ Screening estimate from a state-policy table — verify with the county assessor before closing.
Climate risk First Street
- Flood 1/10 Low FEMA zone X (unshaded) · 0% chance over 30 yrs
- Wildfire 1/10 Low
- Heat 3/10 Moderate 7 d/yr ≥101°F today · 17 d/yr by 30 yrs out
- Wind 2/10 Low 100% chance of damaging wind over 30 yrs
- Air quality 3/10 Moderate 2 unhealthy d/yr today · 3 by 30 yrs out
Nearby sold comps map
Loading sold comps map…
Walkable amenities ~0.75 mi
Loading nearby amenities…
Taxation est. · year 1
- Rental income
- $14,514
- − Mortgage interest
- −$8,901
- − Property taxes
- −$465
- − Insurance
- −$794
- − Repairs & maintenance
- −$1,161
- − Management
- −$1,161
- − Depreciation
- −$4,623
- Taxable loss
- −$2,592
- Est. tax savings @ 24.0%
- +$622
- After-tax cash flow
- $829/yr
For passive investors: Depreciation is non-cash, so a rental often shows a tax loss while cash-flowing — sheltering income. Rental losses are passive: they offset passive income freely, and up to $25,000/yr can offset ordinary (W-2) income if you actively participate and your MAGI is under $100k (phasing out to $0 by $150k); unused losses carry forward. On sale, claimed depreciation is recaptured at up to 25%, and gains may owe capital-gains tax (a 1031 exchange can defer both). Figures are a year-1 estimate at your 24.0% rate — not tax advice; consult a CPA.
Schools (NCES district)
- District
- Taylor Community School Corporation
- NCES district ID
- 1811250
- Math proficiency
- 17% ▼ -10.00%
- Reading proficiency
- 23% ▼ -9.00%
- Median HH income
- $52,382
- Composite
- 18.12/100
- National rank
- #8969
- State rank
- #272 of 301 in IN
Livability — Hemlock
No livability data for this city. (Only ~50 U.S. cities are tracked.)
Census & demographics
- Census place
- Hemlock, IN
- Population (ZIP)
- 19
Population outlook (Howard County) Hauer SSP2
- Today (2025)
- 81,522 people
- By 2030
- 80,104 · -1.7%
- By 2040
- 76,708 · -5.9%
- By 2050
- 72,880 · -10.6%
- By 2075
- 64,016 · -21.5%
- By 2100
- 51,705 · -36.6%
Race, ethnicity, and origin ACS 2023
- Neighborhood character
- Predominantly Black (100%)
- Race & ethnicity
- Black 100%
Political lean MEDSL · Howard
- 2024 margin
- Solid R (+35.3) · D 31.4% · R 66.7% · Other 1.8%
- 2008→2024 swing
- -29.1pp toward R · 2008: -6.2pp · 2024: -35.3pp
- All cycles
- 2024: R+35.3 2020: R+32.4 2016: R+33.9 2012: R+14.3 2008: R+6.2
Not yet ingested
- Civics
- —
Market trends
- HPI YoY
- —
- Current HPI
- —
- Rent YoY
- —
- Metro
- —
- State GDP YoY
- ▲ 2.90%
- F500 in state
- 18
Industry mix (Fortune 500 HQ in IN)
| Industry | F500 HQs | Revenue |
|---|---|---|
| Industrial Machinery | 2 | $37B |
|
||
| Healthcare | 1 | $177B |
|
||
| Pharmaceuticals | 1 | $45B |
|
||
| Metals / Steel | 1 | $18B |
|
||
| Agriculture | 1 | $17B |
|
||
| Packaging | 1 | $12B |
|
||
Price history
+159.0% since first listed10 events — show timeline
- 2026-05-28 Relisted — MIBOR as Distributed by MLS Grid
- 2026-05-28 Price Changed $179,999 MIBOR as Distributed by MLS Grid
- 2026-05-14 Relisted — MIBOR as Distributed by MLS Grid
- 2026-04-17 Price Changed $175,999 MIBOR as Distributed by MLS Grid
- 2026-04-01 Price Changed $180,999 MIBOR as Distributed by MLS Grid
- 2026-03-10 Price Changed $185,999 MIBOR as Distributed by MLS Grid
- 2026-01-15 Price Changed $190,999 MIBOR as Distributed by MLS Grid
- 2025-12-11 Price Changed $193,000 MIBOR as Distributed by MLS Grid
- 2025-11-14 Listed $195,000 MIBOR as Distributed by MLS Grid
- 2000-11-16 Sold (Public Records) $69,500 Public Records
Property tax history
+7.5%/yrLatest (2024): $465 · +5.0% YoY. Source: county tax records.
Cash-flow waterfall
monthlySold comps — $/sqft
last 12 mo · ≤1 miLoading sold comps…