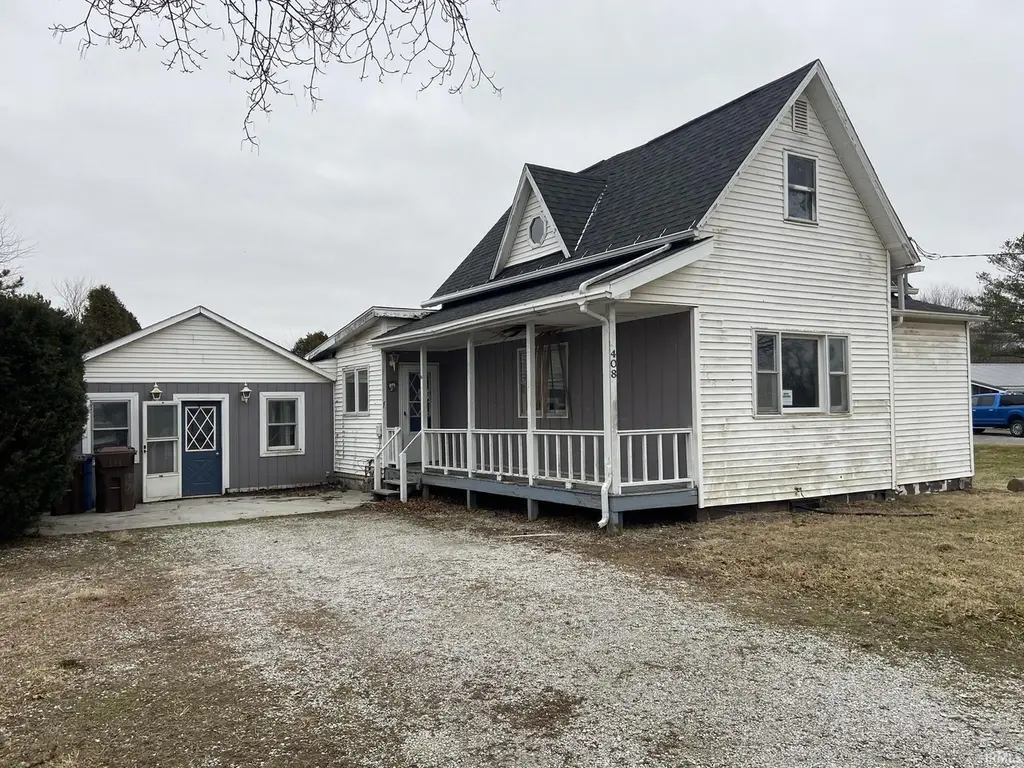
408 W Hobart St · Ashley, IN
Flood risk 1/10 · Minimal
- FEMA flood zone
- X (unshaded)
- Chance of flooding over 30 yrs
- 0.0%
- Est. flood insurance / yr
- $473 – $860
Fire risk 1/10 · Minimal
- Est. fire insurance / yr
- $717 – $1,331
Heat risk 2/10 · Minimal
- Hot days now (above 100°F)
- 7 days/yr
- Hot days in 30 yrs
- 16 days/yr
Wind risk 2/10 · Minimal
- Chance of severe wind over 30 yrs
- —
Air-quality risk 2/10 · Minimal
- Unhealthy air days now
- 1 days/yr
- Unhealthy air days in 30 yrs
- 2 days/yr
Risk factors via First Street. Map © Google.
Why this score? — see what drove the B- grade
The composite is a weighted blend of 9 inputs, each scored 0–100. Each bar is that input's sub-score; the figure is the points it added to the 100-point composite (weight × sub-score).
- Cash flow +30.0/30.0
- DSCR +10.0/10.0
- 1% rule +9.2/10.0
- ARV discount +7.5/15.0
- Schools +3.9/10.0
- Livability +3.2/5.0
- Rent growth +2.5/5.0
- Condition / age +2.5/5.0
- Appreciation +0.0/10.0
$87,000
🖨 Deal sheet 📄 Offer letter ✓ Due diligence
Listing remarks MLS
Take a look at this 4 bedroom 2 bath home with over 1800 sf of living space on large lot. Sold As-is.
Key facts
- 7,492 sq ft lot
- Built 1960
- Listed 2 days
Neighborhood map
What this means for you Summary
Snapshot
- This is a 4-bed/2.0-bath single-family listed at $87k.
Deal economics
- At list price, monthly cash flow is $382 ($5k/yr) — positive.
- The deal already cash-flows at list — no discount required.
- Meets the 1% rule at list price ($1k rent vs $87k).
Location & tenants
- Location reads 65/100 on livability (#320 in IN) — a middle-class / working-renter tenant base. Strengths: crime A+, cost of living A+, housing A+; Watch: employment C-, schools D, amenities F.
- Dekalb County Ctl United School District (town): math 42% / reading 50% proficiency, ranked #91 of 301 in IN (top 30%) — families likely to look elsewhere, expect single-tenant / working-renter base with shorter leases.
- Market conditions: 9 active listings in the ZIP; 116 units permitted in DeKalb County in 2024 (0 in 5+ unit buildings).
Forward outlook
- Local home prices are declining (-3.0%/yr); year-one equity from $601 of loan paydown is wiped out by about $3k of value loss. Plan a longer hold.
- DeKalb County population projected to shrink 9% by 2050 — rents likely to lag national; underwrite the cash flow, not the appreciation.
- At projected returns (-3.0% appreciation + 3.0% rent growth), your $24k cash investment doubles in ~7 years — after that, you're playing with house money.
Negotiation context
- Only 2 days on market — expect competitive offers; lowballing is unlikely to land.
- 5 sale attempts since 11y ago with the ask held roughly flat each time — persistent listings suggest the price (not the market) is what's stuck; bring a comps-based counter.
Questions for the listing agent
- Built in 1960 — when were the roof, HVAC, electrical panel, plumbing, and water heater last replaced?
- Is there a deadline driving the sale (1031 exchange, divorce, estate, relocation)? That informs how much negotiation room exists.
- Schools are D-rated, which usually means shorter tenancies and higher turnover. Who's the typical renter profile here, and what's been the actual vacancy rate?
- What's the average days-on-market for RENTAL listings here right now (not sales)? A rising rental-DOM trend means longer vacancies and softer asking-rent achievability than the comps imply.
- What's the recent tenant-quality profile in this submarket — average credit score on applications, eviction rate, late-payment / NSF rate, and stable-employment percentage? A property-management company in the area should have these aggregated.
- How much new for-sale + rental construction is in the pipeline within 1–3 miles? Heavy new supply typically softens prices + rents 12–24 months out; constrained supply supports both.
Investment metrics
- 1% rule
- 1.42% ✓
- Cap rate
- 11.57%
- Cash-on-cash
- 18.83%
- DSCR
- 1.84
- GRM
- 5.9
CMA / ARV
- ARV (median comp)
- $179,476
- List price
- $87,000
- Delta
- -51.53%
- Verdict
- UNDERPRICED
- Comps
- 20 within 1.0 mi
Show comp detail 12 sales within ~0.75 mi
| Address | Dist | Beds/Ba | Sqft | Sold | Price | $/sf | Match |
|---|---|---|---|---|---|---|---|
| 408 W Hobart St | 0.00mi | 4/2.0 | 1,801 (0%) | 1mo | $47,000 | $26 | 99 |
| 406 W Lincoln St | 0.15mi | 3/2.0 (-1) | 1,792 (-0%) | 1mo | $197,000 | $110 | 86 |
| 103 N Grand Ave | 0.31mi | 3/1.0 (-1) | 1,762 (-2%) | 1mo | $190,000 | $108 | 72 |
| 109 S Gonser Ave | 0.35mi | 3/2.0 (-1) | 1,680 (-7%) | 0mo | $219,900 | $131 | 67 |
| 404 W State St | 0.07mi | 3/2.0 (-1) | 1,608 (-11%) | 14mo | $192,500 | $120 | 62 |
| 305 E Wabash St | 0.50mi | 3/1.0 (-1) | 1,680 (-7%) | 2mo | $183,000 | $109 | 55 |
| 107 E Ashton St | 0.38mi | 3/2.0 (-1) | 1,676 (-7%) | 15mo | $281,000 | $168 | 53 |
| 201 N Garrison St | 0.55mi | 3/2.0 (-1) | 1,611 (-10%) | 1mo | $206,500 | $128 | 51 |
| 201 N Gonser Ave | 0.38mi | 3/2.0 (-1) | 1,618 (-10%) | 12mo | $195,000 | $121 | 50 |
| 304 E Lincoln St | 0.46mi | 3/1.0 (-1) | 1,598 (-11%) | 7mo | $160,000 | $100 | 45 |
| 211 E Hobart St | 0.48mi | 3/1.0 (-1) | 1,629 (-10%) | 10mo | $215,000 | $132 | 44 |
| 307 E Lincoln St | 0.49mi | 3/1.5 (-1) | 1,572 (-13%) | 15mo | $124,900 | $79 | 36 |
Match score weights: distance 35% · size 25% · config 20% · recency 20%. Top-matched comps best support the ARV.
Projected returns pro-forma
-3.0% appreciation · 3.0% rent growth · sell at horizon
- IRR
- 10.7%
- Equity multiple
- 1.42×
- Total profit
- $10,266
- Equity at exit
- $12,972
- IRR
- 19.7%
- Equity multiple
- 2.66×
- Total profit
- $40,353
- Equity at exit
- $7,522
Cash invested: $24,360 (down + closing). Projections, not guarantees.
Landlord ↔ Tenant lean methodology
- Overall (STATE)
- 90 Strongly Landlord-Friendly
- State Indiana
- 90 Strongly Landlord-Friendly · R+11
- County
- — inherits STATE
- City
- — inherits STATE
ZIP-level market 46705
- Home prices YoY
- -5.2%
- Active inventory
- 9
- Price-to-rent
- 5.9×
Monthly cashflow live
- Estimated rent
- $1,237 medium interval (Pro) →
- Mortgage (P&I)
- −$456
- Tax from tax record
- −$103 /mo · $1,233/yr
- Insurance
- −$36
- HOA
- −$0
- Vacancy / Maint / Mgmt
- −$260
- Net cashflow
- $382
Break-even live
UW: 25.0% down · 7.5% · 30yr · 1.5% tax · 5.0% vac · 8.0% maint · 8.0% mgmt
Financing live
Cash to close
- Down payment
- $21,750
- Closing costs
- $2,610
- Reserves months
- —
- Total cash needed
- —
Loan-product check · same deal, 3 products live
Conventional
25% down · 7.5% · 30yr
- Down + closing
- —
- Monthly P&I
- —
- Monthly cashflow
- —
- DSCR
- —
- Eligible?
- —
Personal DTI + credit; lowest rate.
DSCR
20% down · 8.5% · 30yr
- Down + closing
- —
- Monthly P&I
- —
- Monthly cashflow
- —
- DSCR
- —
- Eligible?
- —
No personal income docs; deal must DSCR.
Hard money
10% down · 12.0% · 12mo
- Down + closing
- —
- Monthly P&I
- —
- Monthly cashflow
- —
- DSCR
- —
- Eligible?
- —
Short-term bridge; refi at stabilization.
Listing history 10 events
-
2026-05-12status Pending 101-char remark
Show marketing remark (101 chars)
Take a look at this 4 bedroom 2 bath home with over 1800 sf of living space on large lot. Sold As-is.
-
2026-05-08$87,000 Active 101-char remark
Show marketing remark (101 chars)
Take a look at this 4 bedroom 2 bath home with over 1800 sf of living space on large lot. Sold As-is.
-
2026-04-07price $87,000
-
2026-03-20price $92,000
-
2026-02-20$97,000 Active
-
2018-09-14soldstatus $92,000
-
2018-06-28$89,000
-
2016-07-11$59,800
-
2015-07-17soldstatus $62,000
-
2015-06-08$63,900
ⓘ Source: listings_history table (triggers on properties + properties_extension) + one-shot
backfill from property_details.listing_events for pre-trigger history.
Tax reassessment forecast IN · Partial reset (capped growth)
- Current annual tax
- $1,233 · $103/mo
- Projected year-2 tax
- $1,233 · $103/mo
- Expected delta
- $0/yr ($0/mo · 0.0%)
ⓘ Screening estimate from a state-policy table — verify with the county assessor before closing.
Climate risk First Street
- Flood 1/10 Low FEMA zone X (unshaded) · 0% chance over 30 yrs
- Wildfire 1/10 Low
- Heat 2/10 Low 7 d/yr ≥100°F today · 16 d/yr by 30 yrs out
- Wind 2/10 Low
- Air quality 2/10 Low 1 unhealthy d/yr today · 2 by 30 yrs out
Nearby sold comps map
Loading sold comps map…
Walkable amenities ~0.75 mi
Loading nearby amenities…
Taxation est. · year 1
- Rental income
- $14,848
- − Mortgage interest
- −$4,873
- − Property taxes
- −$1,233
- − Insurance
- −$435
- − Repairs & maintenance
- −$1,188
- − Management
- −$1,188
- − Depreciation
- −$2,531
- Taxable income
- $3,401
- Est. tax owed @ 24.0%
- −$816
- After-tax cash flow
- $3,771/yr
For passive investors: Depreciation is non-cash, so a rental often shows a tax loss while cash-flowing — sheltering income. Rental losses are passive: they offset passive income freely, and up to $25,000/yr can offset ordinary (W-2) income if you actively participate and your MAGI is under $100k (phasing out to $0 by $150k); unused losses carry forward. On sale, claimed depreciation is recaptured at up to 25%, and gains may owe capital-gains tax (a 1031 exchange can defer both). Figures are a year-1 estimate at your 24.0% rate — not tax advice; consult a CPA.
Schools (NCES district)
- District
- Dekalb County Ctl United School District
- NCES district ID
- 1801590
- Math proficiency
- 42% ▼ -7.00%
- Reading proficiency
- 50% ▼ -7.00%
- Median HH income
- $48,100
- Composite
- 39.26/100
- National rank
- #4000
- State rank
- #91 of 301 in IN
Livability — Ashley
- Score
- 65/100
- State rank
- #320
- US rank
- #12601
Category grades
Schools grade is shown separately in the Schools card above.
Census & demographics
- Census place
- Ashley, IN
- City population
- 1,988
- Population (ZIP)
- 1,988
Population outlook (DeKalb County) Hauer SSP2
- Today (2025)
- 42,875 people
- By 2030
- 42,678 · -0.5%
- By 2040
- 41,494 · -3.2%
- By 2050
- 38,939 · -9.2%
- By 2075
- 31,457 · -26.6%
- By 2100
- 20,780 · -51.5%
Race, ethnicity, and origin ACS 2023
- Neighborhood character
- Predominantly White (87%)
- Race & ethnicity
- White 87% Two or more races 11% Hispanic / Latino 6%
- Hispanic origin (detail)
- Mexican 5%
- Common ancestry
- Lithuanian 4% Romanian 2% Slovak 2%
- Foreign-born
- 1% · South Korea
Political lean MEDSL · DeKalb
- 2024 margin
- Solid R (+47.1) · D 25.6% · R 72.7% · Other 1.7%
- 2008→2024 swing
- -31.9pp toward R · 2008: -15.2pp · 2024: -47.1pp
- All cycles
- 2024: R+47.1 2020: R+47.2 2016: R+48.2 2012: R+31.7 2008: R+15.2
Not yet ingested
- Civics
- —
Market trends
- HPI YoY
- ▼ -12.36%
- Current HPI
- 226.0674
- Rent YoY
- —
- Metro
- —
- State GDP YoY
- ▲ 2.90%
- F500 in state
- 18
Industry mix (Fortune 500 HQ in IN)
| Industry | F500 HQs | Revenue |
|---|---|---|
| Industrial Machinery | 2 | $37B |
|
||
| Healthcare | 1 | $177B |
|
||
| Pharmaceuticals | 1 | $45B |
|
||
| Metals / Steel | 1 | $18B |
|
||
| Agriculture | 1 | $17B |
|
||
| Packaging | 1 | $12B |
|
||
Price history
+36.2% since first listed10 events — show timeline
- 2026-05-12 Pending — IRMLS
- 2026-05-08 Listed $87,000 IRMLS
- 2026-04-07 Price Changed $87,000 IRMLS
- 2026-03-20 Price Changed $92,000 IRMLS
- 2026-02-20 Listed $97,000 IRMLS
- 2018-09-14 Sold (MLS) $92,000 IRMLS
- 2018-06-28 Listed $89,000 IRMLS
- 2016-07-11 Listed $59,800 IRMLS
- 2015-07-17 Sold (MLS) $62,000 IRMLS
- 2015-06-08 Listed $63,900 IRMLS
Property tax history
-1.0%/yrLatest (2024): $1,233 · -4.8% YoY. Source: county tax records.
Cash-flow waterfall
monthlySold comps — $/sqft
last 12 mo · ≤1 miLoading sold comps…