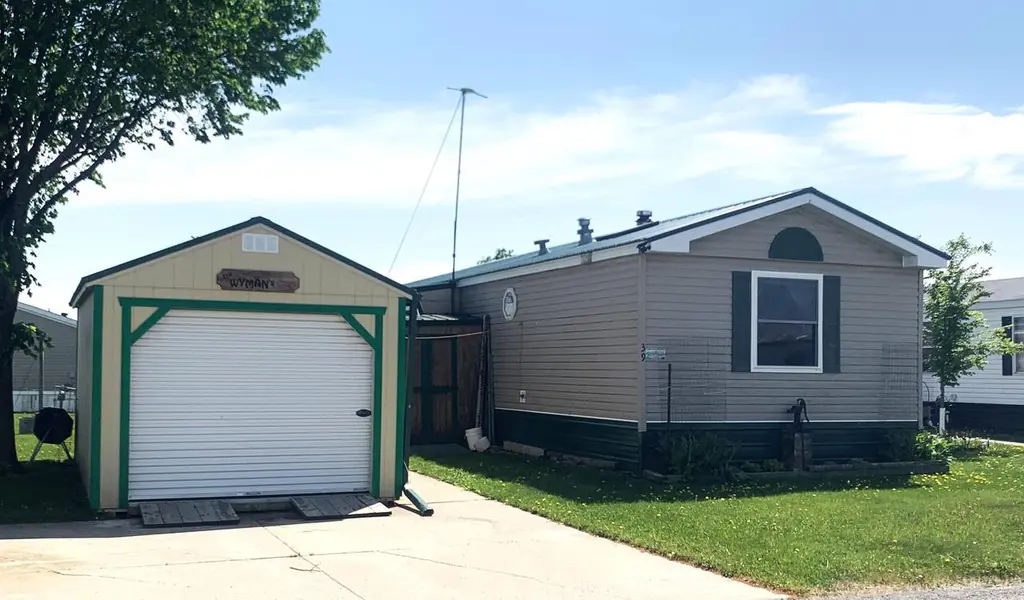
39 Douglas St · Westby, WI
Flood risk No data
- FEMA flood zone
- —
- Chance of flooding over 30 yrs
- —
- Est. flood insurance / yr
- —
Fire risk No data
- Est. fire insurance / yr
- —
Heat risk No data
- Hot days now (above threshold)
- —
- Hot days in 30 yrs
- —
Wind risk No data
- Chance of severe wind over 30 yrs
- —
Air-quality risk No data
- Unhealthy air days now
- —
- Unhealthy air days in 30 yrs
- —
Risk factors via First Street. Map © Google.
Why this score? — see what drove the B grade
The composite is a weighted blend of 9 inputs, each scored 0–100. Each bar is that input's sub-score; the figure is the points it added to the 100-point composite (weight × sub-score).
- Cash flow +30.0/30.0
- 1% rule +10.0/10.0
- DSCR +10.0/10.0
- ARV discount +7.5/15.0
- Condition / age +3.8/5.0
- Livability +3.5/5.0
- Schools +3.4/10.0
- Rent growth +2.5/5.0
- Appreciation +0.0/10.0
$75,000
🖨 Deal sheet 📄 Offer letter ✓ Due diligence
Listing remarks MLS
Come and see a wonderfully maintained 1-owner mobile home, located in Westby's Cedar Meadows North mobile home park. Built in 2000, this home features a spacious and modern kitchen, living room with a wood stove, 3 bedrooms and 2 full bathrooms which have been recently remodeled. Windows have been recently upgraded too! Enjoy the added convenience of a 1-car garage, all nestled in a quiet and friendly neighborhood. Perfect for those seeking a peaceful, low-maintenance lifestyle. Don't wait! --Schedule your showing today and make this dream home yours. All buyers must be approved by the park prior to purchase. PERSOANAL PROPERTY SALE-No approved forms-please see www. scwmls.com/pdf/mh. pdf. Application availabl
Key facts
- Wood stove
- Upgraded windows
- Modern kitchen
Tags
Neighborhood map
What this means for you Summary
Snapshot
- This is a 3-bed/2.0-bath single-family listed at $75k. Condition is rated good.
Deal economics
- At list price, monthly cash flow is $707 ($8k/yr) — positive.
- The deal already cash-flows at list — no discount required.
- Meets the 1% rule at list price ($2k rent vs $75k).
- Recommended offer: $70k (6.0% below list) — sets the bar for market timing.
Location & tenants
- Location reads 69/100 on livability (#330 in WI) — a middle-class / working-renter tenant base. Strengths: crime A+, cost of living A+, housing A+; Watch: schools C-, health & safety D, amenities F.
- Westby Area School District (rural): math 38% / reading 40% proficiency, ranked #165 of 342 in WI (top 48%) — families likely to look elsewhere, expect single-tenant / working-renter base with shorter leases.
- Market conditions: 28 active listings in the ZIP; 117 units permitted in Vernon County in 2024 (0 in 5+ unit buildings).
Forward outlook
- Local home prices are declining (-3.0%/yr); year-one equity from $519 of loan paydown is wiped out by about $2k of value loss. Plan a longer hold.
- Vernon County population projected to shrink 9% by 2050 — rents likely to lag national; underwrite the cash flow, not the appreciation.
- At projected returns (-3.0% appreciation + 3.0% rent growth), your $21k cash investment doubles in ~3 years — after that, you're playing with house money.
Negotiation context
- It's been on market 84 days — a 6% lower offer ($70k) is reasonable based on typical stale-listing flexibility.
Questions for the listing agent
- It's been on market 84 days. Have you received any prior offers? Is the seller open to a 6% concession, seller financing, or rate buy-down credit?
- Why hasn't it sold? Are there any deal-killer items the seller is aware of (foundation, flood, title, zoning, code violations)?
- Is there a deadline driving the sale (1031 exchange, divorce, estate, relocation)? That informs how much negotiation room exists.
- What's the average days-on-market for RENTAL listings here right now (not sales)? A rising rental-DOM trend means longer vacancies and softer asking-rent achievability than the comps imply.
- What's the recent tenant-quality profile in this submarket — average credit score on applications, eviction rate, late-payment / NSF rate, and stable-employment percentage? A property-management company in the area should have these aggregated.
- How much new for-sale + rental construction is in the pipeline within 1–3 miles? Heavy new supply typically softens prices + rents 12–24 months out; constrained supply supports both.
Investment metrics
- 1% rule
- 2.07% ✓
- Cap rate
- 17.60%
- Cash-on-cash
- 40.39%
- DSCR
- 2.80
- GRM
- 4.0
CMA / ARV
- ARV (median comp)
- $207,291
- List price
- $75,000
- Delta
- -63.82%
- Verdict
- UNDERPRICED
- Comps
- 18 within 1.0 mi
Show comp detail 2 sales within ~0.75 mi
| Address | Dist | Beds/Ba | Sqft | Sold | Price | $/sf | Match |
|---|---|---|---|---|---|---|---|
| 301 E Park St | 0.73mi | 2/1.0 (-1) | 1,100 (-14%) | 3mo | $200,000 | $182 | 31 |
| 413 Ramsland St | 0.70mi | 4/2.0 (+1) | 1,425 (+11%) | 20mo | $197,000 | $138 | 27 |
Match score weights: distance 35% · size 25% · config 20% · recency 20%. Top-matched comps best support the ARV.
Projected returns pro-forma
-3.0% appreciation · 3.0% rent growth · sell at horizon
- IRR
- 36.8%
- Equity multiple
- 2.57×
- Total profit
- $32,893
- Equity at exit
- $11,183
- IRR
- 43.5%
- Equity multiple
- 5.13×
- Total profit
- $86,711
- Equity at exit
- $6,485
Cash invested: $21,000 (down + closing). Projections, not guarantees.
Landlord ↔ Tenant lean methodology
- Overall (STATE)
- 73 Landlord-Friendly
- State Wisconsin
- 73 Landlord-Friendly · R+2
- County
- — inherits STATE
- City
- — inherits STATE
ZIP-level market 54667
- Active inventory
- 28
- Price-to-rent
- 4.0×
Monthly cashflow live
- Estimated rent
- $1,551 medium interval (Pro) →
- Mortgage (P&I)
- −$393
- Tax est. 1.5%
- −$94 /mo · $1,125/yr
- Insurance
- −$31
- HOA
- −$0
- Vacancy / Maint / Mgmt
- −$326
- Net cashflow
- $707
Break-even live
UW: 25.0% down · 7.5% · 30yr · 1.5% tax · 5.0% vac · 8.0% maint · 8.0% mgmt
Financing live
Cash to close
- Down payment
- $18,750
- Closing costs
- $2,250
- Reserves months
- —
- Total cash needed
- —
Loan-product check · same deal, 3 products live
Conventional
25% down · 7.5% · 30yr
- Down + closing
- —
- Monthly P&I
- —
- Monthly cashflow
- —
- DSCR
- —
- Eligible?
- —
Personal DTI + credit; lowest rate.
DSCR
20% down · 8.5% · 30yr
- Down + closing
- —
- Monthly P&I
- —
- Monthly cashflow
- —
- DSCR
- —
- Eligible?
- —
No personal income docs; deal must DSCR.
Hard money
10% down · 12.0% · 12mo
- Down + closing
- —
- Monthly P&I
- —
- Monthly cashflow
- —
- DSCR
- —
- Eligible?
- —
Short-term bridge; refi at stabilization.
Listing history 16 events
-
2026-06-18days on market $75,000 Active 84 DOM
-
2026-06-17days on market $75,000 Active 83 DOM
-
2026-06-16days on market $75,000 Active 82 DOM
-
2026-06-15days on market $75,000 Active 81 DOM
-
2026-06-15days on market $75,000 Active 80 DOM
-
2026-06-13days on market $75,000 Active 79 DOM
-
2026-06-09days on market $75,000 Active 75 DOM
-
2026-06-08days on market $75,000 Active 74 DOM
-
2026-06-08days on market $75,000 Active 73 DOM
-
2026-06-05days on market $75,000 Active 71 DOM
-
2026-06-04days on market $75,000 Active 70 DOM
-
2026-06-03days on market $75,000 Active 69 DOM
-
2026-06-02days on market $75,000 Active 68 DOM
-
2026-06-01days on market $75,000 Active 67 DOM
-
2026-05-31days on market $75,000 Active 66 DOM
-
2026-03-26$75,000 Active 719-char remark
Show marketing remark (719 chars)
Come and see a wonderfully maintained 1-owner mobile home, located in Westby's Cedar Meadows North mobile home park. Built in 2000, this home features a spacious and modern kitchen, living room with a wood stove, 3 bedrooms and 2 full bathrooms which have been recently remodeled. Windows have been recently upgraded too! Enjoy the added convenience of a 1-car garage, all nestled in a quiet and friendly neighborhood. Perfect for those seeking a peaceful, low-maintenance lifestyle. Don't wait! --Schedule your showing today and make this dream home yours. All buyers must be approved by the park prior to purchase. PERSOANAL PROPERTY SALE-No approved forms-please see www. scwmls.com/pdf/mh. pdf. Application availabl
ⓘ Source: listings_history table (triggers on properties + properties_extension) + one-shot
backfill from property_details.listing_events for pre-trigger history.
Nearby sold comps map
Loading sold comps map…
Walkable amenities ~0.75 mi
Loading nearby amenities…
Taxation est. · year 1
- Rental income
- $18,611
- − Mortgage interest
- −$4,201
- − Property taxes
- −$1,125
- − Insurance
- −$375
- − Repairs & maintenance
- −$1,489
- − Management
- −$1,489
- − Depreciation
- −$2,182
- Taxable income
- $7,750
- Est. tax owed @ 24.0%
- −$1,860
- After-tax cash flow
- $6,623/yr
For passive investors: Depreciation is non-cash, so a rental often shows a tax loss while cash-flowing — sheltering income. Rental losses are passive: they offset passive income freely, and up to $25,000/yr can offset ordinary (W-2) income if you actively participate and your MAGI is under $100k (phasing out to $0 by $150k); unused losses carry forward. On sale, claimed depreciation is recaptured at up to 25%, and gains may owe capital-gains tax (a 1031 exchange can defer both). Figures are a year-1 estimate at your 24.0% rate — not tax advice; consult a CPA.
Condition & rehab AI · 12 photos
A well-maintained single-family mobile home with good condition and potential for cosmetic updates to enhance its resale and rental value.
Repairs flagged
- Minor kitchen cabinets — dated and could be replaced
- Minor bathroom fixtures — standard and could be updated
Value-add opportunities
- Both paint interior walls — enhances curb appeal and interior aesthetics
- Both replace carpet — improves comfort and reduces maintenance
- Resale update kitchen cabinets — modernizes the space and adds value
- Resale update bathroom fixtures — modernizes the space and adds value
Renovation cost estimate screening
| Repair item | Severity | Est. cost |
|---|---|---|
| kitchen cabinets · dated and could be replaced | Minor | $500–3,000 |
| bathroom fixtures · standard and could be updated | Minor | $500–3,000 |
| Total estimated repair cost · 2 items | $1,000–6,000 |
Value-add ROI direction
- Both paint interior walls — enhances curb appeal and interior aesthetics ↑
- Both replace carpet — improves comfort and reduces maintenance ↑
- Resale update kitchen cabinets — modernizes the space and adds value ↑
- Resale update bathroom fixtures — modernizes the space and adds value ↑
ⓘ Cost ranges are severity-bucket heuristics (US national rule-of-thumb). Get contractor quotes + a written scope before underwriting a rehab budget.
Schools (NCES district)
- District
- Westby Area School District
- NCES district ID
- 5516410
- Math proficiency
- 38% ▼ -5.00%
- Reading proficiency
- 40% ▼ -3.00%
- Median HH income
- $53,216
- Composite
- 33.97/100
- National rank
- #5327
- State rank
- #165 of 342 in WI
Livability — Westby
- Score
- 69/100
- State rank
- #330
- US rank
- #8524
Category grades
Schools grade is shown separately in the Schools card above.
Census & demographics
- Census place
- Westby, WI
- Population (ZIP)
- 5,013
Population outlook (Vernon County) Hauer SSP2
- Today (2025)
- 30,605 people
- By 2030
- 30,461 · -0.5%
- By 2040
- 29,595 · -3.3%
- By 2050
- 27,730 · -9.4%
- By 2075
- 22,308 · -27.1%
- By 2100
- 14,855 · -51.5%
Race, ethnicity, and origin ACS 2023
- Neighborhood character
- Predominantly White (96%)
- Race & ethnicity
- White 96% Two or more races 2% Hispanic / Latino 1%
- Common ancestry
- Portuguese 38% Polish 10% Romanian 2%
- Foreign-born
- 1% · Canada
- Languages at home
- 87% English-only · German/W. Germanic 11% Spanish 1%
Political lean MEDSL · Vernon
- 2024 margin
- Lean R (+7.8) · D 45.3% · R 53.1% · Other 1.6%
- 2008→2024 swing
- -29.8pp toward R · 2008: 22.0pp · 2024: -7.8pp
- All cycles
- 2024: R+7.8 2020: R+4.8 2016: R+4.5 2012: D+14.8 2008: D+22.0
Not yet ingested
- Civics
- —
Market trends
- HPI YoY
- ▼ -125.45%
- Current HPI
- 226.0642
- Rent YoY
- —
- Metro
- —
- State GDP YoY
- ▲ 2.10%
- F500 in state
- 20
Industry mix (Fortune 500 HQ in WI)
| Industry | F500 HQs | Revenue |
|---|---|---|
| Industrial Machinery | 4 | $23B |
|
||
| Industrial Technology | 2 | $36B |
|
||
| Insurance | 1 | $36B |
|
||
| Professional Services | 1 | $19B |
|
||
| Utilities | 1 | $9B |
|
||
| Consumer Goods | 1 | $3B |
|
||
Price history
1 event — show timeline
- 2026-03-26 Listed $75,000 SCWMLS
Cash-flow waterfall
monthlySold comps — $/sqft
last 12 mo · ≤1 miLoading sold comps…