105 W Herndon Ave #3 · Fresno, CA
Flood risk 1/10 · Minimal
- FEMA flood zone
- X (unshaded)
- Chance of flooding over 30 yrs
- 0.0%
- Est. flood insurance / yr
- $507 – $1,088
Fire risk 2/10 · Minimal
- Est. fire insurance / yr
- $659 – $1,223
Heat risk 8/10 · Major
- Hot days now (above 105°F)
- 7 days/yr
- Hot days in 30 yrs
- 17 days/yr
Wind risk 1/10 · Minimal
- Chance of severe wind over 30 yrs
- —
Air-quality risk 10/10 · Severe
- Unhealthy air days now
- 48 days/yr
- Unhealthy air days in 30 yrs
- 50 days/yr
Risk factors via First Street. Map © Google.
Why this score? — see what drove the B grade
The composite is a weighted blend of 9 inputs, each scored 0–100. Each bar is that input's sub-score; the figure is the points it added to the 100-point composite (weight × sub-score).
- Cash flow +28.1/30.0
- DSCR +10.0/10.0
- Appreciation +10.0/10.0
- ARV discount +7.5/15.0
- 1% rule +6.4/10.0
- Livability +3.1/5.0
- Schools +2.7/10.0
- Rent growth +2.5/5.0
- Condition / age +2.5/5.0
$180,000
🖨 Deal sheet 📄 Offer letter ✓ Due diligence
Listing remarks MLS
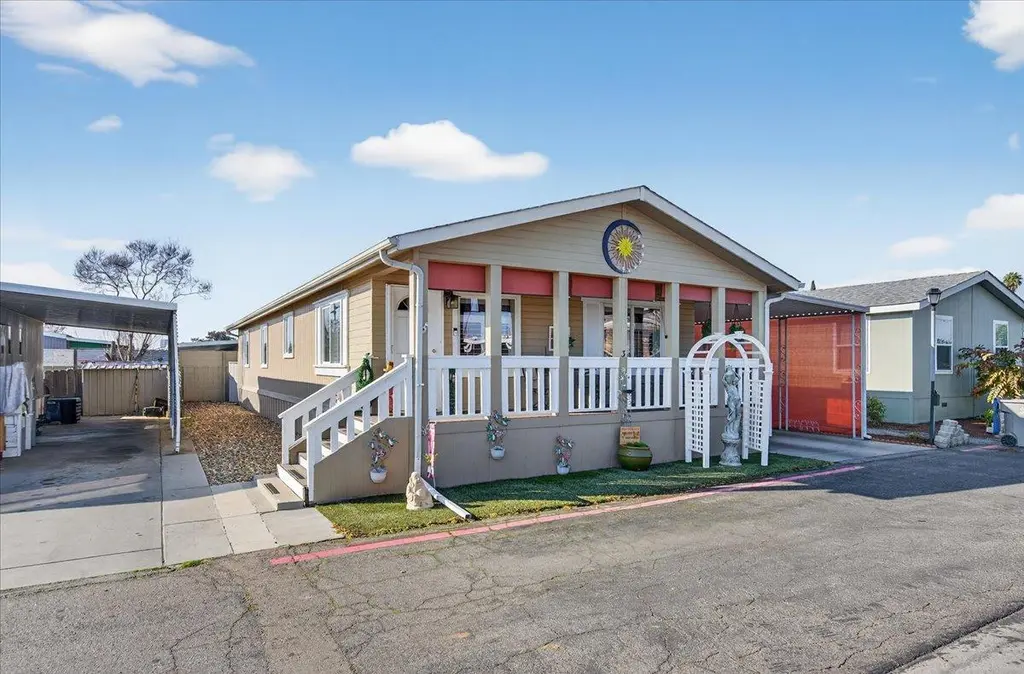
This 2003, 2-bed, 2-bath, 1,584 sq ft manufactured home is ridiculously charmingand refreshingly spacious in all the right ways. A big, window-filled living room, an oversized primary bedroom, and a proper primary bath with a large walk-in closet mean nothing here feels undersized or improvised.The covered front porch sets the toneperfect for porch chairs, plants, and peaceful evenings. Built with 2x6 exterior walls, the home offers added substance where it counts, plus a large carport, a bonus secondary deck, and a shed for the things that don't belong in your living space.It's comfortable, cheerful, and effortlessly livablethe kind of home that feels good the moment you walk in.And when you're ready to venture out of your cozy bubble, River Park shopping and dining are just minutes away, putting convenience right where you want it.
Key facts
- Covered front porch
- Shed
- Large carport
Tags
Neighborhood map
What this means for you Summary
Snapshot
- This is a 3-bed/2.0-bath manufactured listed at $180k.
Deal economics
- At list price, monthly cash flow is $563 ($7k/yr) — positive.
- The deal already cash-flows at list — no discount required.
- Meets the 1% rule at list price ($2k rent vs $180k).
- Recommended offer: $158k (12.0% below list) — sets the bar for market timing.
- Cap rate 10.0% vs local median 3.7% in Fresno — top-decile yield for the area; either an underpriced asset or a hidden risk that comps aren't pricing in. Stress-test before assuming the spread holds.
Location & tenants
- Location reads 62/100 on livability (#469 in CA) — a middle-class / working-renter tenant base. Strengths: commute A+, housing A+; Watch: amenities D+, employment D+, schools D.
- Fresno Unified (urban): math 18% / reading 47% proficiency, ranked #327 of 517 in CA (top 63%) — families likely to look elsewhere, expect single-tenant / working-renter base with shorter leases; 77% free/reduced lunch — lower-income household profile, screen leases tightly.
- Market conditions: 18 active listings in the ZIP; 17 comparable units currently listed for rent nearby; rentals at typical pace (median 16d on market — plan ~3-4 weeks tenant-placement turnaround); 2,426 units permitted in Fresno County in 2024 (296 in 5+ unit buildings).
Forward outlook
- In year one you build about $19k of equity ($1k loan paydown + $18k appreciation (10.0% local appreciation)).
- Fresno County population projected at +11% by 2050 — modest demand growth; plan on rents tracking national, not racing it.
- At projected returns (10.0% appreciation + 3.0% rent growth), your $50k cash investment doubles in ~2 years — after that, you're playing with house money.
- By year 2, paydown + projected appreciation supports a ~$31k cash-out refi (75% LTV) — recoverable capital for the next deal without selling this one.
Negotiation context
- It's been on market 154 days — a 12% lower offer ($158k) is reasonable based on typical stale-listing flexibility.
Risks & watch-outs
- Climate carrying-cost: extreme-heat days projected 7→17/yr by 2055 (HVAC capex compounding) — expect insurance premiums to compound above CPI over the hold.
Questions for the listing agent
- It's been on market 154 days. Have you received any prior offers? Is the seller open to a 12% concession, seller financing, or rate buy-down credit?
- Why hasn't it sold? Are there any deal-killer items the seller is aware of (foundation, flood, title, zoning, code violations)?
- Is there a deadline driving the sale (1031 exchange, divorce, estate, relocation)? That informs how much negotiation room exists.
- Schools are D-rated, which usually means shorter tenancies and higher turnover. Who's the typical renter profile here, and what's been the actual vacancy rate?
- Crime grade is F in this area — have there been break-ins, vandalism, or insurance claims at this property in the last 3 years? What carrier currently insures it and at what premium?
- What's the average days-on-market for RENTAL listings here right now (not sales)? A rising rental-DOM trend means longer vacancies and softer asking-rent achievability than the comps imply.
- What's the recent tenant-quality profile in this submarket — average credit score on applications, eviction rate, late-payment / NSF rate, and stable-employment percentage? A property-management company in the area should have these aggregated.
- How much new for-sale + rental construction is in the pipeline within 1–3 miles? Heavy new supply typically softens prices + rents 12–24 months out; constrained supply supports both.
Investment metrics
- 1% rule
- 1.14% ✓
- Cap rate
- 10.05%
- Cash-on-cash
- 13.40%
- DSCR
- 1.60
- GRM
- 7.3
CMA / ARV
- ARV (median comp)
- $118,225
- List price
- $180,000
- Delta
- 52.25%
- Verdict
- OVERPRICED
- Comps
- 15 within 1.0 mi
Show comp detail 12 sales within ~0.75 mi
| Address | Dist | Beds/Ba | Sqft | Sold | Price | $/sf | Match |
|---|---|---|---|---|---|---|---|
| 221 W Herndon Ave #165 | 0.14mi | 3/2.0 | 1,560 (-2%) | 14mo | $162,500 | $104 | 79 |
| 221 W Herndon Ave #80 | 0.14mi | 3/2.0 | 1,620 (+2%) | 14mo | $173,000 | $107 | 78 |
| 221 W Herndon Ave #8 | 0.14mi | 2/2.0 (-1) | 1,440 (-9%) | 1mo | $95,000 | $66 | 72 |
| 221 W Herndon Ave #9 | 0.20mi | 2/2.0 (-1) | 1,440 (-9%) | 1mo | $53,000 | $37 | 70 |
| 221 W Herndon Ave #87 | 0.14mi | 2/2.0 (-1) | 1,440 (-9%) | 4mo | $119,000 | $83 | 70 |
| 221 W Herndon #66 | 0.16mi | 2/1.8 (-1) | 1,488 (-6%) | 8mo | $139,900 | $94 | 70 |
| 221 W Herndon #37 | 0.20mi | 2/2.0 (-1) | 1,440 (-9%) | 7mo | $120,000 | $83 | 65 |
| 221 W Herndon Ave #118 | 0.17mi | 2/2.0 (-1) | 1,440 (-9%) | 9mo | $139,500 | $97 | 64 |
| 221 W Herndon Ave #71 | 0.17mi | 2/1.8 (-1) | 1,440 (-9%) | 8mo | $143,000 | $99 | 64 |
| 221 W Herndon Ave #195 | 0.14mi | 2/2.0 (-1) | 1,440 (-9%) | 16mo | $115,000 | $80 | 60 |
| 221 W Herndon Ave Spc 91 | 0.20mi | 3/2.0 | 1,390 (-12%) | 15mo | $120,000 | $86 | 58 |
| 221 W Herndon Ave Unit SP 46 | 0.14mi | 2/2.0 (-1) | 1,440 (-9%) | 20mo | $100,000 | $69 | 56 |
Match score weights: distance 35% · size 25% · config 20% · recency 20%. Top-matched comps best support the ARV.
Projected returns pro-forma
10.0% appreciation · 3.0% rent growth · sell at horizon
- IRR
- 34.1%
- Equity multiple
- 3.65×
- Total profit
- $133,803
- Equity at exit
- $162,158
- IRR
- 29.4%
- Equity multiple
- 8.26×
- Total profit
- $365,672
- Equity at exit
- $349,700
Cash invested: $50,400 (down + closing). Projections, not guarantees.
Landlord ↔ Tenant lean methodology
- Overall (STATE)
- 18 Strongly Tenant-Friendly
- State California
- 18 Strongly Tenant-Friendly · D+13
- County
- — inherits STATE
- City
- — inherits STATE
ZIP-level market 93650
- Home prices YoY
- 2.5%
- Active inventory
- 18
- Price-to-rent
- 7.3×
Monthly cashflow live
- Estimated rent
- $2,055 high interval (Pro) →
- Mortgage (P&I)
- −$944
- Tax from tax record
- −$42 /mo · $500/yr
- Insurance
- −$75
- HOA
- −$0
- Vacancy / Maint / Mgmt
- −$432
- Net cashflow
- $563
Break-even live
UW: 25.0% down · 7.5% · 30yr · 1.5% tax · 5.0% vac · 8.0% maint · 8.0% mgmt
Financing live
Cash to close
- Down payment
- $45,000
- Closing costs
- $5,400
- Reserves months
- —
- Total cash needed
- —
Loan-product check · same deal, 3 products live
Conventional
25% down · 7.5% · 30yr
- Down + closing
- —
- Monthly P&I
- —
- Monthly cashflow
- —
- DSCR
- —
- Eligible?
- —
Personal DTI + credit; lowest rate.
DSCR
20% down · 8.5% · 30yr
- Down + closing
- —
- Monthly P&I
- —
- Monthly cashflow
- —
- DSCR
- —
- Eligible?
- —
No personal income docs; deal must DSCR.
Hard money
10% down · 12.0% · 12mo
- Down + closing
- —
- Monthly P&I
- —
- Monthly cashflow
- —
- DSCR
- —
- Eligible?
- —
Short-term bridge; refi at stabilization.
Rent comps 17 comps
| Address | Beds | Baths | Sqft | Rent | $/sqft | DOM | Units | Dist |
|---|---|---|---|---|---|---|---|---|
| 91 W Sierra Ave Fresno, CA | 3.0 | 1.5 | 1291 | $2,500 | $1.94 | 16d | 1 | 0.42mi |
| 135 E Stuart Ave Fresno, CA | 3.0 | 1.0 | 1120 | $1,995 | $1.78 | 3d | 1 | 0.80mi |
| 6075 N Poplar Ave Apt E Fresno, CA | 2.0 | 1.0 | 1100 | $1,600 | $1.45 | 3d | 1 | 0.84mi |
| 6052 N College Ave Unit A Fresno, CA | 3.0 | 2.0 | 1200 | $2,100 | $1.75 | 44d | 1 | 0.86mi |
| 6549 N Palm Ave Fresno, CA | 2.0 | 2.0 | 1100 | $1,760 | $1.60 | 2d | 2 | 0.90mi |
| 336 W Bullard Ave Fresno, CA | 2.0 | 2.0 | 1100 | $1,700 | $1.55 | 44d | 1 | 0.91mi |
| 1055 W Fremont Ave Fresno, CA | 3.0 | 2.0 | 2005 | $2,150 | $1.07 | 44d | 1 | 0.93mi |
| 6515 N Orchard St Fresno, CA | 3.0 | 2.0 | 1500 | $2,300 | $1.53 | 16d | 1 | 1.00mi |
| 373 W Nees Ave Fresno, CA | 1.0–2.0 | 1.0–2.0 | 867 | $1,855 | $2.14 | 3d | 1 | 1.05mi |
| 7579 N Angus St Unit 101 Fresno, CA | 2.0 | 2.0 | 1245 | $1,825 | $1.47 | 24d | 1 | 1.08mi |
| 7580 N Angus St Fresno, CA | 2.0 | 2.0 | 1350 | $1,900 | $1.41 | 44d | 1 | 1.11mi |
| 5544 N Poplar Ave Fresno, CA | 3.0 | 3.0 | 1868 | $2,485 | $1.33 | 44d | 1 | 1.22mi |
| 1249 W Spruce Ave Unit 1249 Fresno, CA | 2.0 | 2.0 | 1250 | $1,975 | $1.58 | 10d | 1 | 1.23mi |
| 7511 N First St Fresno, CA | 1.0–3.0 | 1.0–2.5 | 1078 | $2,350 | $2.18 | 2d | 21 | 1.24mi |
| 1271 W Spruce Ave Unit 1271 Fresno, CA | 2.0 | 2.5 | 1250 | $1,850 | $1.48 | 10d | 1 | 1.27mi |
| 7675 N First St Fresno, CA | 1.0–2.0 | 1.0–2.0 | 989 | $1,830 | $1.85 | 44d | 1 | 1.35mi |
| 5721 N Callisch Ave Fresno, CA | 3.0 | 1.5 | 1393 | $1,950 | $1.40 | 3d | 1 | 1.35mi |
Listing history 15 events
-
2026-06-18days on market $180,000 Active 154 DOM
-
2026-06-17days on market $180,000 Active 153 DOM
-
2026-06-16days on market $180,000 Active 152 DOM
-
2026-06-15days on market $180,000 Active 151 DOM
-
2026-06-13days on market $180,000 Active 149 DOM
-
2026-06-10days on market $180,000 Active 146 DOM
-
2026-06-09days on market $180,000 Active 145 DOM
-
2026-06-08days on market $180,000 Active 144 DOM
-
2026-06-07days on market $180,000 Active 143 DOM
-
2026-06-05days on market $180,000 Active 140 DOM
-
2026-06-03days on market $180,000 Active 139 DOM
-
2026-06-02days on market $180,000 Active 138 DOM
-
2026-06-01days on market $180,000 Active 137 DOM
-
2026-05-31days on market $180,000 Active 136 DOM
-
2026-01-15$180,000 Active 845-char remark
Show marketing remark (845 chars)
This 2003, 2-bed, 2-bath, 1,584 sq ft manufactured home is ridiculously charmingand refreshingly spacious in all the right ways. A big, window-filled living room, an oversized primary bedroom, and a proper primary bath with a large walk-in closet mean nothing here feels undersized or improvised.The covered front porch sets the toneperfect for porch chairs, plants, and peaceful evenings. Built with 2x6 exterior walls, the home offers added substance where it counts, plus a large carport, a bonus secondary deck, and a shed for the things that don't belong in your living space.It's comfortable, cheerful, and effortlessly livablethe kind of home that feels good the moment you walk in.And when you're ready to venture out of your cozy bubble, River Park shopping and dining are just minutes away, putting convenience right where you want it.
ⓘ Source: listings_history table (triggers on properties + properties_extension) + one-shot
backfill from property_details.listing_events for pre-trigger history.
Tax reassessment forecast CA · Resets to sale price
- Current annual tax
- $500 · $42/mo
- Projected year-2 tax
- $1,368 · $114/mo
- Expected delta
- +$868/yr (+$72/mo · 173.6%)
ⓘ Screening estimate from a state-policy table — verify with the county assessor before closing.
Climate risk First Street
- Flood 1/10 Low FEMA zone X (unshaded) · 0% chance over 30 yrs
- Wildfire 2/10 Low
- Heat 8/10 Severe 7 d/yr ≥105°F today · 17 d/yr by 30 yrs out
- Wind 1/10 Low
- Air quality 10/10 Extreme 48 unhealthy d/yr today · 50 by 30 yrs out
Nearby sold comps map
Loading sold comps map…
Walkable amenities ~0.75 mi
Loading nearby amenities…
Taxation est. · year 1
- Rental income
- $24,661
- − Mortgage interest
- −$10,083
- − Property taxes
- −$500
- − Insurance
- −$900
- − Repairs & maintenance
- −$1,973
- − Management
- −$1,973
- − Depreciation
- −$5,236
- Taxable income
- $3,996
- Est. tax owed @ 24.0%
- −$959
- After-tax cash flow
- $5,796/yr
For passive investors: Depreciation is non-cash, so a rental often shows a tax loss while cash-flowing — sheltering income. Rental losses are passive: they offset passive income freely, and up to $25,000/yr can offset ordinary (W-2) income if you actively participate and your MAGI is under $100k (phasing out to $0 by $150k); unused losses carry forward. On sale, claimed depreciation is recaptured at up to 25%, and gains may owe capital-gains tax (a 1031 exchange can defer both). Figures are a year-1 estimate at your 24.0% rate — not tax advice; consult a CPA.
Schools (NCES district)
- District
- Fresno Unified
- NCES district ID
- 0614550
- Math proficiency
- 18% ▼ -12.00%
- Reading proficiency
- 47% ▲ 9.00%
- Median HH income
- $36,095
- Composite
- 26.83/100
- National rank
- #7111
- State rank
- #327 of 517 in CA
Livability — Fresno
- Score
- 62/100
- State rank
- #469
- US rank
- #15907
Category grades
Schools grade is shown separately in the Schools card above.
Census & demographics
- Census place
- Fresno, CA
- City population
- 593,114
- Population (ZIP)
- 2,969
Population outlook (Fresno County) Hauer SSP2
- Today (2025)
- 1,042,971 people
- By 2030
- 1,072,198 · +2.8%
- By 2040
- 1,122,408 · +7.6%
- By 2050
- 1,157,251 · +11.0%
- By 2075
- 1,182,575 · +13.4%
- By 2100
- 1,105,899 · +6.0%
Race, ethnicity, and origin ACS 2023
- Neighborhood character
- Predominantly Hispanic (77%)
- Race & ethnicity
- Hispanic / Latino 77% Two or more races 33% White 12% Asian 6% Black 3%
- Hispanic origin (detail)
- Mexican 71%
- Common ancestry
- Slovak 3% Romanian 1%
- Foreign-born
- 15% · Canada
- Languages at home
- 52% English-only · Spanish 41% Other Asian/Pacific 4% Other Indo-European 2%
Political lean MEDSL · Fresno
- 2024 margin
- Toss-up / Even · D 46.5% · R 50.9% · Other 2.6%
- 2008→2024 swing
- -6.5pp toward R · 2008: 2.1pp · 2024: -4.4pp
- All cycles
- 2024: R+4.4 2020: D+7.8 2016: D+3.9 2012: R+2.9 2008: D+2.1
Not yet ingested
- Civics
- —
Market trends
- HPI YoY
- ▲ 13.16%
- Current HPI
- 547.5597
- Rent YoY
- —
- Metro
- —
- State GDP YoY
- ▲ 3.21%
- F500 in state
- 116
Industry mix (Fortune 500 HQ in CA)
| Industry | F500 HQs | Revenue |
|---|---|---|
| Technology | 27 | $1,492B |
|
||
| Financial Services | 3 | $174B |
|
||
| Retail | 3 | $44B |
|
||
| Insurance | 3 | $26B |
|
||
| Media / Entertainment | 2 | $115B |
|
||
| Pharmaceuticals / Biotech | 2 | $62B |
|
||
Price history
1 event — show timeline
- 2026-01-15 Listed $180,000 FRESNOMLS
Cash-flow waterfall
monthlySold comps — $/sqft
last 12 mo · ≤1 miLoading sold comps…