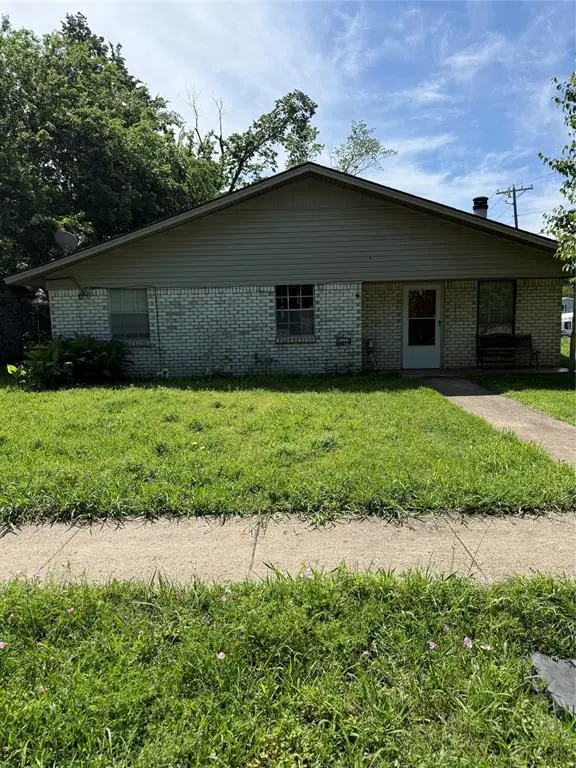
700 Live Oak St · Wilmer, TX
Flood risk 1/10 · Minimal
- FEMA flood zone
- X (unshaded)
- Chance of flooding over 30 yrs
- 0.0%
- Est. flood insurance / yr
- $507 – $1,088
Fire risk 4/10 · Minor
- Est. fire insurance / yr
- $1,222 – $2,270
Heat risk 8/10 · Major
- Hot days now (above 110°F)
- 7 days/yr
- Hot days in 30 yrs
- 24 days/yr
Wind risk 6/10 · Moderate
- Chance of severe wind over 30 yrs
- 27.0%
Air-quality risk 2/10 · Minimal
- Unhealthy air days now
- 1 days/yr
- Unhealthy air days in 30 yrs
- 1 days/yr
Risk factors via First Street. Map © Google.
Why this score? — see what drove the B grade
The composite is a weighted blend of 9 inputs, each scored 0–100. Each bar is that input's sub-score; the figure is the points it added to the 100-point composite (weight × sub-score).
- Cash flow +24.2/30.0
- ARV discount +15.0/15.0
- 1% rule +8.4/10.0
- DSCR +7.8/10.0
- Appreciation +6.9/10.0
- Livability +3.0/5.0
- Schools +2.8/10.0
- Rent growth +2.5/5.0
- Condition / age +2.5/5.0
$149,000
🖨 Deal sheet 📄 Offer letter ✓ Due diligence
Listing remarks MLS
This property is ready for its new owners. It would make a great primary residence with some TLC, or a good investment property. Conveniently located just off I-45, this home offers an easy commute to downtown Dallas and close proximity to shopping, schools, and dining! The property is being sold AS-IS.
Key facts
- 9,583 sq ft lot
- Garage
- Built 1973
Neighborhood map
What this means for you Summary
Snapshot
- This is a 3-bed/2.0-bath single-family listed at $149k.
Deal economics
- At list price, monthly cash flow is $298 ($4k/yr) — positive.
- The deal already cash-flows at list — no discount required.
- Meets the 1% rule at list price ($2k rent vs $149k).
- Recommended offer: $147k (1.5% below list) — sets the bar for market timing.
- Cap rate 8.7% vs local median 4.8% in Wilmer — top-decile yield for the area; either an underpriced asset or a hidden risk that comps aren't pricing in. Stress-test before assuming the spread holds.
Location & tenants
- Location reads 60/100 on livability (#1,054 in TX) — a middle-class / working-renter tenant base. Strengths: cost of living A+, housing A+; Watch: crime C-, schools F, amenities F.
- Dallas ISD (urban): math 31% / reading 36% proficiency, ranked #559 of 826 in TX (top 68%) — families likely to look elsewhere, expect single-tenant / working-renter base with shorter leases; 83% free/reduced lunch — lower-income household profile, screen leases tightly.
- Market conditions: 38 active listings in the ZIP; 12 comparable units currently listed for rent nearby; rentals at typical pace (median 24d on market — plan ~3-4 weeks tenant-placement turnaround); 42% of comp listings sitting > 30 days — soft ceiling on asking rent; 12,577 units permitted in Dallas County in 2024 (6,829 in 5+ unit buildings).
Forward outlook
- In year one you build about $7k of equity ($1k loan paydown + $6k appreciation (3.7% local appreciation)).
- Dallas County population projected at +35% by 2050 — long-run rental-demand tailwind backs the buy-and-hold thesis.
- At projected returns (3.7% appreciation + 3.0% rent growth), your $42k cash investment doubles in ~4 years — after that, you're playing with house money.
- By year 6, paydown + projected appreciation supports a ~$35k cash-out refi (75% LTV) — recoverable capital for the next deal without selling this one.
Negotiation context
- It's been on market 25 days — a 2% lower offer ($147k) is reasonable based on typical stale-listing flexibility.
Risks & watch-outs
- Watch-outs: property tax is 3.5% of price.
- Climate carrying-cost: major wind risk, 27% chance of damaging wind over 30y; extreme-heat days projected 7→24/yr by 2055 (HVAC capex compounding) — expect insurance premiums to compound above CPI over the hold.
Questions for the listing agent
- Built in 1973 — when were the roof, HVAC, electrical panel, plumbing, and water heater last replaced?
- Property tax is high relative to price — has the assessment been appealed recently, and will the sale trigger a re-assessment?
- Is there a deadline driving the sale (1031 exchange, divorce, estate, relocation)? That informs how much negotiation room exists.
- Schools are F-rated, which usually means shorter tenancies and higher turnover. Who's the typical renter profile here, and what's been the actual vacancy rate?
- What's the average days-on-market for RENTAL listings here right now (not sales)? A rising rental-DOM trend means longer vacancies and softer asking-rent achievability than the comps imply.
- What's the recent tenant-quality profile in this submarket — average credit score on applications, eviction rate, late-payment / NSF rate, and stable-employment percentage? A property-management company in the area should have these aggregated.
- How much new for-sale + rental construction is in the pipeline within 1–3 miles? Heavy new supply typically softens prices + rents 12–24 months out; constrained supply supports both.
Investment metrics
- 1% rule
- 1.34% ✓
- Cap rate
- 8.69%
- Cash-on-cash
- 8.56%
- DSCR
- 1.38
- GRM
- 6.2
CMA / ARV
- ARV (median comp)
- $220,522
- List price
- $149,000
- Delta
- -32.43%
- Verdict
- UNDERPRICED
- Comps
- 20 within 1.0 mi
Show comp detail 12 sales within ~0.75 mi
| Address | Dist | Beds/Ba | Sqft | Sold | Price | $/sf | Match |
|---|---|---|---|---|---|---|---|
| 320 Pecan St | 0.10mi | 4/2.0 (+1) | 1,198 (-10%) | 1mo | $269,000 | $225 | 74 |
| 233 Sycamore Pl | 0.59mi | 3/2.0 | 1,266 (-4%) | 2mo | $249,499 | $197 | 63 |
| 213 Sycamore Pl | 0.57mi | 3/2.0 | 1,402 (+6%) | 2mo | $234,149 | $167 | 62 |
| 205 Sycamore Pl | 0.56mi | 3/2.0 | 1,411 (+6%) | 2mo | $239,999 | $170 | 61 |
| 236 Sycamore Pl | 0.62mi | 3/2.0 | 1,402 (+6%) | 2mo | $223,099 | $159 | 60 |
| 1271 Maple St | 0.67mi | 3/2.0 | 1,266 (-4%) | 2mo | $228,349 | $180 | 60 |
| 1267 Maple St | 0.66mi | 3/2.0 | 1,402 (+6%) | 2mo | $238,999 | $170 | 58 |
| 211 Garlock St | 0.72mi | 4/2.0 (+1) | 1,352 (+2%) | 1mo | $290,000 | $214 | 58 |
| 1280 Balsam Rd | 0.67mi | 3/2.0 | 1,411 (+6%) | 1mo | $261,999 | $186 | 57 |
| 1263 Maple St | 0.65mi | 3/2.0 | 1,411 (+6%) | 2mo | $251,349 | $178 | 57 |
| 114 Willow Way | 0.68mi | 3/2.0 | 1,411 (+6%) | 2mo | $252,999 | $179 | 56 |
| 134 Willow Way | 0.71mi | 3/2.0 | 1,411 (+6%) | 1mo | $231,000 | $164 | 55 |
Match score weights: distance 35% · size 25% · config 20% · recency 20%. Top-matched comps best support the ARV.
Projected returns pro-forma
3.73% appreciation · 3.0% rent growth · sell at horizon
- IRR
- 17.3%
- Equity multiple
- 2.03×
- Total profit
- $42,904
- Equity at exit
- $73,182
- IRR
- 18.3%
- Equity multiple
- 3.86×
- Total profit
- $119,456
- Equity at exit
- $117,848
Cash invested: $41,720 (down + closing). Projections, not guarantees.
Landlord ↔ Tenant lean methodology
- Overall (STATE)
- 87 Strongly Landlord-Friendly
- State Texas
- 87 Strongly Landlord-Friendly · R+5
- County
- — inherits STATE
- City
- — inherits STATE
ZIP-level market 75172
- Home prices YoY
- 1.7%
- Active inventory
- 38
- Price-to-rent
- 6.2×
Monthly cashflow live
- Estimated rent
- $1,990 high interval (Pro) →
- Mortgage (P&I)
- −$781
- Tax from tax record
- −$431 /mo · $5,171/yr
- Insurance
- −$62
- HOA
- −$0
- Vacancy / Maint / Mgmt
- −$418
- Net cashflow
- $298
Break-even live
UW: 25.0% down · 7.5% · 30yr · 1.5% tax · 5.0% vac · 8.0% maint · 8.0% mgmt
Financing live
Cash to close
- Down payment
- $37,250
- Closing costs
- $4,470
- Reserves months
- —
- Total cash needed
- —
Loan-product check · same deal, 3 products live
Conventional
25% down · 7.5% · 30yr
- Down + closing
- —
- Monthly P&I
- —
- Monthly cashflow
- —
- DSCR
- —
- Eligible?
- —
Personal DTI + credit; lowest rate.
DSCR
20% down · 8.5% · 30yr
- Down + closing
- —
- Monthly P&I
- —
- Monthly cashflow
- —
- DSCR
- —
- Eligible?
- —
No personal income docs; deal must DSCR.
Hard money
10% down · 12.0% · 12mo
- Down + closing
- —
- Monthly P&I
- —
- Monthly cashflow
- —
- DSCR
- —
- Eligible?
- —
Short-term bridge; refi at stabilization.
Rent comps 12 comps
| Address | Beds | Baths | Sqft | Rent | $/sqft | DOM | Units | Dist |
|---|---|---|---|---|---|---|---|---|
| 314 Rolling Meadow Dr Wilmer, TX | 4.0 | 2.0 | 1496 | $2,399 | $1.60 | 43d | 1 | 0.31mi |
| 531 Sydney St Wilmer, TX | 4.0 | 2.0 | 1696 | $2,100 | $1.24 | 1d | 1 | 0.51mi |
| 5900 S Interstate Highway 45 Wilmer, TX | 1.0–3.0 | 1.0–2.0 | 988 | $1,794 | $1.81 | 1d | 8 | 0.51mi |
| 1223 Maple St Wilmer, TX | 3.0 | 2.0 | 1381 | $1,935 | $1.40 | 43d | 1 | 0.58mi |
| 1235 Maple St Wilmer, TX | 3.0 | 2.0 | 1673 | $1,895 | $1.13 | 24d | 1 | 0.60mi |
| 1239 Maple St Wilmer, TX | 3.0 | 2.0 | 1673 | $1,895 | $1.13 | 24d | 1 | 0.61mi |
| 1255 Maple St Wilmer, TX | 3.0 | 2.0 | 1529 | $1,875 | $1.23 | 43d | 1 | 0.64mi |
| 409 Dewitt St Wilmer, TX | 3.0 | 2.0 | 1320 | $2,000 | $1.52 | 1d | 1 | 0.65mi |
| 110 Willow Way Wilmer, TX | 3.0 | 2.0 | 1647 | $1,875 | $1.14 | 43d | 1 | 0.67mi |
| 6000 S Interstate Highway 45 Wilmer, TX | 1.0–4.0 | 1.0–2.0 | 988 | $1,781 | $1.80 | 1d | 13 | 0.68mi |
| 118 Willow Way Wilmer, TX | 3.0 | 2.0 | 1647 | $1,875 | $1.14 | 43d | 1 | 0.68mi |
| 301 Mars Rd Wilmer, TX | 1.0–3.0 | 1.0–2.0 | 965 | $1,864 | $1.93 | 1d | 24 | 1.07mi |
Listing history 4 events
-
2026-05-15status Pending 304-char remark
Show marketing remark (304 chars)
This property is ready for its new owners. It would make a great primary residence with some TLC, or a good investment property. Conveniently located just off I-45, this home offers an easy commute to downtown Dallas and close proximity to shopping, schools, and dining! The property is being sold AS-IS.
-
2026-04-20$149,000 Active 304-char remark
Show marketing remark (304 chars)
This property is ready for its new owners. It would make a great primary residence with some TLC, or a good investment property. Conveniently located just off I-45, this home offers an easy commute to downtown Dallas and close proximity to shopping, schools, and dining! The property is being sold AS-IS.
-
2026-03-18soldstatus
-
2016-07-28soldstatus
ⓘ Source: listings_history table (triggers on properties + properties_extension) + one-shot
backfill from property_details.listing_events for pre-trigger history.
Tax reassessment forecast TX · Resets to sale price
- Current annual tax
- $5,171 · $431/mo
- Projected year-2 tax
- $5,171 · $431/mo
- Expected delta
- $0/yr ($0/mo · 0.0%)
ⓘ Screening estimate from a state-policy table — verify with the county assessor before closing.
Climate risk First Street
- Flood 1/10 Low FEMA zone X (unshaded) · 0% chance over 30 yrs
- Wildfire 4/10 Moderate
- Heat 8/10 Severe 7 d/yr ≥110°F today · 24 d/yr by 30 yrs out
- Wind 6/10 Major 27% chance of damaging wind over 30 yrs
- Air quality 2/10 Low 1 unhealthy d/yr today · 1 by 30 yrs out
Nearby sold comps map
Loading sold comps map…
Walkable amenities ~0.75 mi
Loading nearby amenities…
Taxation est. · year 1
- Rental income
- $23,879
- − Mortgage interest
- −$8,346
- − Property taxes
- −$5,171
- − Insurance
- −$745
- − Repairs & maintenance
- −$1,910
- − Management
- −$1,910
- − Depreciation
- −$4,335
- Taxable income
- $1,462
- Est. tax owed @ 24.0%
- −$351
- After-tax cash flow
- $3,221/yr
For passive investors: Depreciation is non-cash, so a rental often shows a tax loss while cash-flowing — sheltering income. Rental losses are passive: they offset passive income freely, and up to $25,000/yr can offset ordinary (W-2) income if you actively participate and your MAGI is under $100k (phasing out to $0 by $150k); unused losses carry forward. On sale, claimed depreciation is recaptured at up to 25%, and gains may owe capital-gains tax (a 1031 exchange can defer both). Figures are a year-1 estimate at your 24.0% rate — not tax advice; consult a CPA.
Schools (NCES district)
- District
- Dallas ISD
- NCES district ID
- 4816230
- Math proficiency
- 31% ▼ -16.00%
- Reading proficiency
- 36% ▼ -4.00%
- Median HH income
- $42,881
- Composite
- 28.41/100
- National rank
- #6763
- State rank
- #559 of 826 in TX
Livability — Wilmer
- Score
- 60/100
- State rank
- #1054
- US rank
- #18696
Category grades
Schools grade is shown separately in the Schools card above.
Census & demographics
- Census place
- Wilmer, TX
- City population
- 5,873
- Population (ZIP)
- 5,873
Population outlook (Dallas County) Hauer SSP2
- Today (2025)
- 2,979,839 people
- By 2030
- 3,191,823 · +7.1%
- By 2040
- 3,619,611 · +21.5%
- By 2050
- 4,026,915 · +35.1%
- By 2075
- 4,957,073 · +66.4%
- By 2100
- 5,508,725 · +84.9%
Race, ethnicity, and origin ACS 2023
- Neighborhood character
- Diverse neighborhood (Simpson 0.64)
- Race & ethnicity
- Hispanic / Latino 47% Black 31% White 22% Two or more races 14%
- Hispanic origin (detail)
- Mexican 40%
- Common ancestry
- Lithuanian 1% Iranian 1%
- Foreign-born
- 17% · Canada
- Languages at home
- 54% English-only · Spanish 46%
Political lean MEDSL · Dallas
- 2024 margin
- Strong D (+22.2) · D 60.2% · R 38.0% · Other 1.8%
- 2008→2024 swing
- +6.9pp toward D · 2008: 15.3pp · 2024: 22.2pp
- All cycles
- 2024: D+22.2 2020: D+31.6 2016: D+26.2 2012: D+15.4 2008: D+15.3
Not yet ingested
- Civics
- —
Market trends
- HPI YoY
- ▲ 3.73%
- Current HPI
- 221.1676
- Rent YoY
- —
- Metro
- —
- State GDP YoY
- ▲ 3.95%
- F500 in state
- 110
Industry mix (Fortune 500 HQ in TX)
| Industry | F500 HQs | Revenue |
|---|---|---|
| Energy | 16 | $1,198B |
|
||
| Technology | 5 | $198B |
|
||
| Engineering / Construction | 4 | $72B |
|
||
| Energy Services | 3 | $60B |
|
||
| Utilities | 3 | $41B |
|
||
| Healthcare | 2 | $330B |
|
||
Price history
4 events — show timeline
- 2026-05-15 Pending — NTREIS
- 2026-04-20 Listed $149,000 NTREIS
- 2026-03-18 Sold (Public Records) — Public Records
- 2016-07-28 Sold (Public Records) — Public Records
Property tax history
+8.0%/yrLatest (2025): $5,171 · +22.9% YoY. Source: county tax records.
Cash-flow waterfall
monthlySold comps — $/sqft
last 12 mo · ≤1 miLoading sold comps…