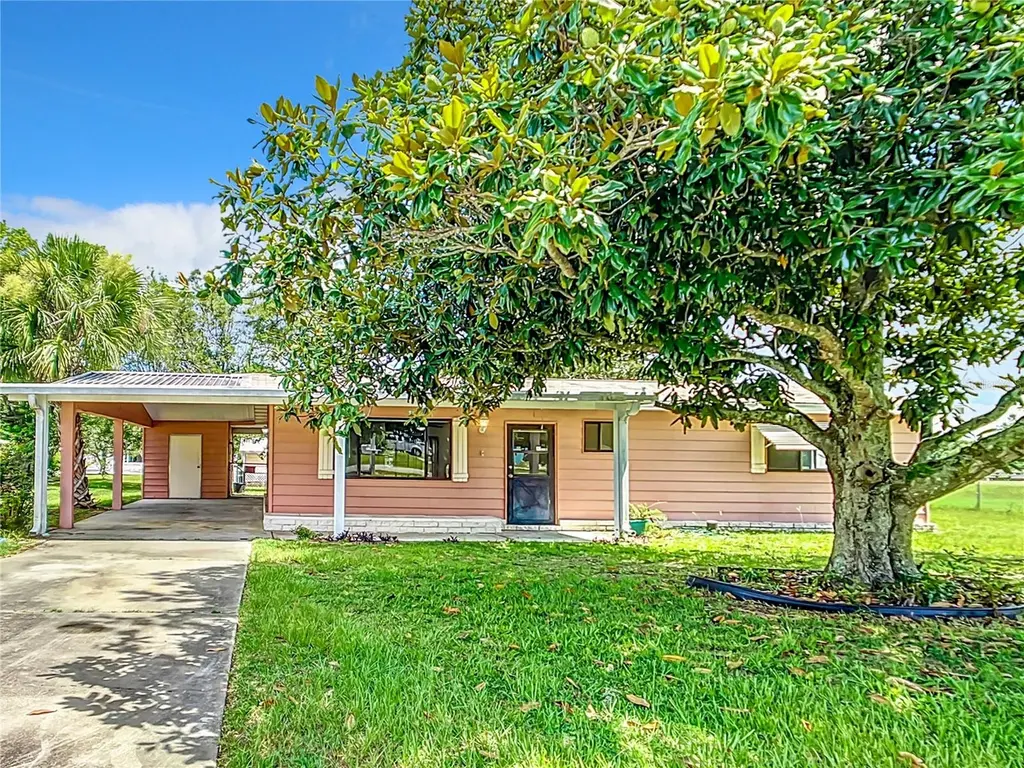
8917 SW 104th Pl · Liberty Triangle, FL
Flood risk 1/10 · Minimal
- FEMA flood zone
- X (unshaded)
- Chance of flooding over 30 yrs
- 0.0%
- Est. flood insurance / yr
- $507 – $1,088
Fire risk 4/10 · Minor
- Est. fire insurance / yr
- $947 – $1,759
Heat risk 8/10 · Major
- Hot days now (above 107°F)
- 7 days/yr
- Hot days in 30 yrs
- 22 days/yr
Wind risk 9/10 · Severe
- Chance of severe wind over 30 yrs
- 99.0%
Air-quality risk 3/10 · Minor
- Unhealthy air days now
- 3 days/yr
- Unhealthy air days in 30 yrs
- 3 days/yr
Risk factors via First Street. Map © Google.
Why this score? — see what drove the D grade
The composite is a weighted blend of 9 inputs, each scored 0–100. Each bar is that input's sub-score; the figure is the points it added to the 100-point composite (weight × sub-score).
- Cash flow +12.5/30.0
- ARV discount +9.8/15.0
- 1% rule +5.1/10.0
- DSCR +3.7/10.0
- Schools +3.6/10.0
- Rent growth +2.5/5.0
- Livability +2.5/5.0
- Condition / age +2.5/5.0
- Appreciation +0.0/10.0
$149,900
🖨 Deal sheet (PDF) 📄 Offer letter ✓ Due diligence
Listing remarks MLS
This charming property features 2 bedrooms and 2 bathrooms, with new luxury vinyl flooring, freshly painted interior, and new tile surrounding the shower and tub in both bathrooms. The kitchen features new stainless appliances. New roof August 2024. The home also includes a spacious sunroom that leads out to the fenced-in backyard, providing a perfect space to enjoy your morning coffee, read a book, or entertain guests. This home has great potential, offering the new owner an excellent opportunity to personalize it to their taste. Located in Pine Rune Estates, a vibrant and exclusive 55+ deed-restricted gated community, residents enjoy access to two clubhouses, two pools with hot tubs, tennis and pickleball courts, shuffleboard, a fitness room, a cozy library, and a variety of engaging activities such as BINGO, line dancing, trivia night, bunco, and karaoke. Conveniently situated near abundant shopping, entertainment, offices, and hospitals, Pine Rune Estates offers the perfect blend of serene living and modern convenience, making it a place you'll be proud to call home.
Key facts
- Two clubhouses
- Spacious sunroom
- Fenced-in backyard
Tags
Neighborhood map
What this means for you Summary
Snapshot
- This is a 2-bed/2.0-bath single-family listed at $150k.
Deal economics
- At list price, monthly cash flow is $-22 ($-259/yr) — negative.
- To cash-flow at today's rent, offer at most $146k (2.5% below list).
- Meets the 1% rule at list price ($2k rent vs $150k).
- Recommended offer: $145k (3.0% below list) — sets the bar for market timing.
- Cap rate 6.1% vs local median 4.5% in Liberty Triangle — top-decile yield for the area; either an underpriced asset or a hidden risk that comps aren't pricing in. Stress-test before assuming the spread holds.
Location & tenants
- Location reads: area grade D — affects rentability + tenant quality, not the cash-flow math above.
- Marion (rural): math 42% / reading 43% proficiency, ranked #61 of 73 in FL (top 84%) — families likely to look elsewhere, expect single-tenant / working-renter base with shorter leases; 61% free/reduced lunch — lower-income household profile, screen leases tightly.
- Zoned schools: Marion Oaks Elementary School (math 38% / reading 39%, grade F, #1,575 of 2,144 statewide, top 74%, 939 students, 65% FRL); Liberty Middle School (math 40% / reading 41%, grade F, #360 of 571 statewide, top 64%, 1,365 students, 54% FRL); West Port High School (math 34% / reading 52%, grade F, #255 of 667 statewide, top 39%, 2,906 students, 52% FRL) — zoned schools at 57% FRL track the district average.
- Market conditions: 1161 active listings in the ZIP; 26 comparable units currently listed for rent nearby; rentals at typical pace (median 23d on market — plan ~3-4 weeks tenant-placement turnaround); 7,071 units permitted in Marion County in 2024 (534 in 5+ unit buildings).
- This rent runs 32% of the median local income ($57k/yr) — at the standard rent-burdened threshold; future hikes will face affordability resistance.
Forward outlook
- Local home prices are declining (-3.0%/yr); year-one equity from $1k of loan paydown is wiped out by about $4k of value loss. Plan a longer hold.
- Marion County population projected at +13% by 2050 — modest demand growth; plan on rents tracking national, not racing it.
Negotiation context
- It's been on market 60 days — a 3% lower offer ($145k) is reasonable based on typical stale-listing flexibility.
- 3 sale attempts since 22y ago with the ask held roughly flat each time — persistent listings suggest the price (not the market) is what's stuck; bring a comps-based counter.
- Current owner paid $56k; list at $150k implies a 168% gain — meaningful room to come down on a strong offer.
Risks & watch-outs
- Climate carrying-cost: severe wind risk, 99% chance of damaging wind over 30y; extreme-heat days projected 7→22/yr by 2055 (HVAC capex compounding) — expect insurance premiums to compound above CPI over the hold.
Questions for the listing agent
- What do current leases actually rent for vs. the listed asking? Can we see a recent rent roll and the last 12 months of T-12 income?
- It's been on market 60 days. Have you received any prior offers? Is the seller open to a 3% concession, seller financing, or rate buy-down credit?
- What does the HOA fee cover, when was the last increase, and are there any pending special assessments or reserve-fund shortfalls?
- Is there a deadline driving the sale (1031 exchange, divorce, estate, relocation)? That informs how much negotiation room exists.
- The area grade is low — what's the realistic commute time and amenity access for the typical tenant pool here? Any planned neighborhood developments (good or bad) we should know about?
- What's the average days-on-market for RENTAL listings here right now (not sales)? A rising rental-DOM trend means longer vacancies and softer asking-rent achievability than the comps imply.
- What's the recent tenant-quality profile in this submarket — average credit score on applications, eviction rate, late-payment / NSF rate, and stable-employment percentage? A property-management company in the area should have these aggregated.
- How much new for-sale + rental construction is in the pipeline within 1–3 miles? Heavy new supply typically softens prices + rents 12–24 months out; constrained supply supports both.
Investment metrics
- 1% rule
- 1.01% ✓
- Cap rate
- 6.12%
- Cash-on-cash
- -0.62%
- DSCR
- 0.97
- GRM
- 8.3
CMA / ARV
- ARV (median comp)
- $158,034
- List price
- $149,900
- Delta
- -5.15%
- Verdict
- FAIR
- Comps
- 20 within 1.0 mi
Show comp detail 12 sales within ~0.75 mi
| Address | Dist | Beds/Ba | Sqft | Sold | Price | $/sf | Match |
|---|---|---|---|---|---|---|---|
| 10061 SW 88th Ter | 0.34mi | 2/2.0 | 1,144 (+10%) | 7mo | $135,500 | $118 | 62 |
| 9200 SW 101st Ln | 0.36mi | 2/2.0 | 1,144 (+10%) | 10mo | $169,900 | $149 | 58 |
| 8329 SW 105th Pl | 0.60mi | 2/2.0 | 960 (-8%) | 2mo | $185,000 | $193 | 58 |
| 8473 SW 106th St | 0.47mi | 2/2.0 | 936 (-10%) | 10mo | $133,000 | $142 | 53 |
| 10060 SW 93rd Ave | 0.53mi | 2/1.5 | 1,095 (+5%) | 15mo | $130,000 | $119 | 52 |
| 8344 SW 107th Pl | 0.65mi | 2/2.0 | 960 (-8%) | 8mo | $143,200 | $149 | 50 |
| 8244 SW 106th Pl | 0.73mi | 2/2.0 | 990 (-5%) | 12mo | $183,000 | $185 | 48 |
| 8343 SW 105th Pl | 0.58mi | 2/2.0 | 936 (-10%) | 11mo | $150,000 | $160 | 47 |
| 8357 SW 106th St | 0.58mi | 2/2.0 | 1,116 (+7%) | 17mo | $195,000 | $175 | 46 |
| 10815 SW 86th Ave | 0.63mi | 2/2.0 | 1,178 (+13%) | 7mo | $243,000 | $206 | 43 |
| 10892 SW 88th Ct | 0.73mi | 2/2.0 | 1,086 (+4%) | 23mo | $170,000 | $157 | 40 |
| 8245 SW 106th St | 0.70mi | 2/2.0 | 1,122 (+8%) | 18mo | $170,000 | $152 | 39 |
Match score weights: distance 35% · size 25% · config 20% · recency 20%. Top-matched comps best support the ARV.
Projected returns pro-forma
-3.0% appreciation · 3.0% rent growth · sell at horizon
- IRR
- -17.2%
- Equity multiple
- 0.39×
- Total profit
- $-25,532
- Equity at exit
- $22,351
- IRR
- -9.0%
- Equity multiple
- 0.44×
- Total profit
- $-23,459
- Equity at exit
- $12,961
Cash invested: $41,972 (down + closing). Projections, not guarantees.
Landlord ↔ Tenant lean methodology
- Overall (STATE)
- 87 Strongly Landlord-Friendly
- State Florida
- 87 Strongly Landlord-Friendly · R+3
- County
- — inherits STATE
- City
- — inherits STATE
ZIP-level market 34481
- Home prices YoY
- -25.2%
- Active inventory
- 1161
- Price-to-rent
- 8.3×
Monthly cashflow live
- Estimated rent
- $1,514 high interval (Pro) →
- Mortgage (P&I)
- −$786
- Tax from tax record
- −$221 /mo · $2,654/yr
- Insurance
- −$62
- HOA
- −$148
- Vacancy / Maint / Mgmt
- −$318
- Net cashflow
- $-22
Break-even live
Sensitivity live
| Price | -10% $63 | -5% $21 | +0% $-22 | +5% $-64 | +10% $-106 |
|---|---|---|---|---|---|
| Rent | -10% $-141 | -5% $-81 | +0% $-22 | +5% $38 | +10% $98 |
| Rate | -1.0pp $54 | -0.5pp $17 | base $-22 | +0.5pp $-60 | +1.0pp $-100 |
UW: 25.0% down · 7.5% · 30yr · 1.5% tax · 5.0% vac · 8.0% maint · 8.0% mgmt
Financing live
Cash to close
- Down payment
- $37,475
- Closing costs
- $4,497
- Reserves months
- —
- Total cash needed
- —
Loan-product check · same deal, 3 products live
Conventional
25% down · 7.5% · 30yr
- Down + closing
- —
- Monthly P&I
- —
- Monthly cashflow
- —
- DSCR
- —
- Eligible?
- —
Personal DTI + credit; lowest rate.
DSCR
20% down · 8.5% · 30yr
- Down + closing
- —
- Monthly P&I
- —
- Monthly cashflow
- —
- DSCR
- —
- Eligible?
- —
No personal income docs; deal must DSCR.
Hard money
10% down · 12.0% · 12mo
- Down + closing
- —
- Monthly P&I
- —
- Monthly cashflow
- —
- DSCR
- —
- Eligible?
- —
Short-term bridge; refi at stabilization.
Rent comps 26 comps
| Address | Beds | Baths | Sqft | Rent | $/sqft | DOM | Units | Dist |
|---|---|---|---|---|---|---|---|---|
| 8935 SW 102nd Pl Ocala, FL | 2.0 | 2.0 | 1144 | $1,500 | $1.31 | 23d | 1 | 0.17mi |
| 9075 SW 102nd Pl Ocala, FL | 2.0 | 2.0 | 1008 | $1,275 | $1.26 | 23d | 1 | 0.25mi |
| 10441 SW 85th Ct Ocala, FL | 2.0 | 2.0 | 1090 | $1,495 | $1.37 | 23d | 1 | 0.29mi |
| 8757 SW 97th Lane Rd Unit C Ocala, FL | 2.0 | 2.0 | 1490 | $1,600 | $1.07 | 15d | 1 | 0.44mi |
| 10211 SW 93rd Ct Ocala, FL | 3.0 | 2.0 | 1456 | $1,495 | $1.03 | 23d | 1 | 0.47mi |
| 8947 SW 108th Pl Ocala, FL | 2.0 | 2.0 | 1096 | $1,500 | $1.37 | 23d | 1 | 0.64mi |
| 8655 SW 98th Street Rd Unit G Ocala, FL | 2.0 | 2.0 | 1424 | $1,500 | $1.05 | 23d | 1 | 0.66mi |
| 10081 SW 95th Ave Ocala, FL | 2.0 | 2.0 | 1040 | $1,395 | $1.34 | 23d | 1 | 0.66mi |
| 9201 SW 108th Pl Ocala, FL | 2.0 | 2.0 | 1170 | $1,475 | $1.26 | 23d | 15 | 0.69mi |
| 8670 SW 97th St Unit A Ocala, FL | 2.0 | 2.0 | 1341 | $1,600 | $1.19 | 23d | 1 | 0.69mi |
| 8671 SW 97th St Unit C Ocala, FL | 2.0 | 2.0 | 1341 | $1,474 | $1.10 | 15d | 1 | 0.72mi |
| 8669 SW 108th Ln Ocala, FL | 2.0 | 1.0 | 1152 | $1,250 | $1.09 | 23d | 1 | 0.74mi |
| 8942 SW 109th Ln Ocala, FL | 2.0 | 2.0 | 960 | $1,450 | $1.51 | 23d | 1 | 0.83mi |
| 10081 SW 97th Ct Ocala, FL | 2.0 | 1.0 | 992 | $1,200 | $1.21 | 15d | 1 | 0.90mi |
| 8680 SW 94th Ln Unit G Ocala, FL | 3.0 | 2.0 | 1409 | $1,550 | $1.10 | 23d | 1 | 0.90mi |
| 9760 SW 101st Ln Ocala, FL | 2.0 | 2.0 | 1360 | $1,500 | $1.10 | 23d | 1 | 0.90mi |
| 10405 SW 99th Ave Ocala, FL | 2.0 | 2.0 | 1040 | $1,450 | $1.39 | 23d | 1 | 0.98mi |
| 8130 SW 108th Street Rd Ocala, FL | 2.0 | 2.0 | 1084 | $1,975 | $1.82 | 23d | 1 | 1.00mi |
| 9748 SW 97th St Ocala, FL | 2.0 | 2.0 | 1105 | $1,500 | $1.36 | 23d | 1 | 1.07mi |
| 9758 SW 96th St Ocala, FL | 2.0 | 2.0 | 1219 | $1,400 | $1.15 | 23d | 1 | 1.10mi |
| 10155 SW 100th Ave Ocala, FL | 2.0 | 2.0 | 1040 | $1,700 | $1.63 | 23d | 1 | 1.12mi |
| 9794 SW 96th St Ocala, FL | 2.0 | 2.0 | 1201 | $1,700 | $1.42 | 23d | 1 | 1.13mi |
| 9013 SW 91st Cir Ocala, FL | 2.0 | 2.0 | 1494 | $1,900 | $1.27 | 15d | 1 | 1.27mi |
| 8430 SW 90th Ln Unit D Ocala, FL | 2.0 | 2.0 | 1454 | $1,600 | $1.10 | 23d | 1 | 1.37mi |
| 8287 SW 116th St Ocala, FL | 2.0 | 2.0 | 1181 | $1,550 | $1.31 | 23d | 1 | 1.37mi |
| 8431 SW 90th Ln Ocala, FL | 2.0 | 2.0 | 1366 | $1,395 | $1.02 | 23d | 1 | 1.40mi |
HOA detail
- Monthly dues
- $148 · $1,776/yr
- Likely covers
- poolsecurity
Listing history 8 events
-
2026-03-25$149,900 Active 1098-char remark
Show marketing remark (1098 chars)
This charming property features 2 bedrooms and 2 bathrooms, with new luxury vinyl flooring, freshly painted interior, and new tile surrounding the shower and tub in both bathrooms. The kitchen features new stainless appliances. New roof August 2024. The home also includes a spacious sunroom that leads out to the fenced-in backyard, providing a perfect space to enjoy your morning coffee, read a book, or entertain guests. This home has great potential, offering the new owner an excellent opportunity to personalize it to their taste. Located in Pine Rune Estates, a vibrant and exclusive 55+ deed-restricted gated community, residents enjoy access to two clubhouses, two pools with hot tubs, tennis and pickleball courts, shuffleboard, a fitness room, a cozy library, and a variety of engaging activities such as BINGO, line dancing, trivia night, bunco, and karaoke. Conveniently situated near abundant shopping, entertainment, offices, and hospitals, Pine Rune Estates offers the perfect blend of serene living and modern convenience, making it a place you'll be proud to call home.
-
2024-12-19historical
-
2024-06-19$169,900 Active
-
2004-08-31soldstatus $55,900
-
2004-08-05soldstatus $55,900
-
2004-05-27$55,900
-
1991-06-01soldstatus $32,000
-
1981-08-01soldstatus $34,900
ⓘ Source: listings_history table (triggers on properties + properties_extension) + one-shot
backfill from property_details.listing_events for pre-trigger history.
Tax reassessment forecast FL · Resets to sale price
- Current annual tax
- $2,654 · $221/mo
- Projected year-2 tax
- $2,654 · $221/mo
- Expected delta
- $0/yr ($0/mo · 0.0%)
ⓘ Screening estimate from a state-policy table — verify with the county assessor before closing.
Climate risk First Street
- Flood 1/10 Low FEMA zone X (unshaded) · 0% chance over 30 yrs
- Wildfire 4/10 Moderate
- Heat 8/10 Severe 7 d/yr ≥107°F today · 22 d/yr by 30 yrs out
- Wind 9/10 Extreme 99% chance of damaging wind over 30 yrs
- Air quality 3/10 Moderate 3 unhealthy d/yr today · 3 by 30 yrs out
Nearby sold comps map
Loading sold comps map…
Walkable amenities ~0.75 mi
Loading nearby amenities…
Taxation est. · year 1
- Rental income
- $18,168
- − Mortgage interest
- −$8,397
- − Property taxes
- −$2,654
- − Insurance
- −$750
- − Repairs & maintenance
- −$1,453
- − Management
- −$1,453
- − HOA
- −$1,776
- − Depreciation
- −$4,361
- Taxable loss
- −$2,675
- Est. tax savings @ 24.0%
- +$642
- After-tax cash flow
- $383/yr
For passive investors: Depreciation is non-cash, so a rental often shows a tax loss while cash-flowing — sheltering income. Rental losses are passive: they offset passive income freely, and up to $25,000/yr can offset ordinary (W-2) income if you actively participate and your MAGI is under $100k (phasing out to $0 by $150k); unused losses carry forward. On sale, claimed depreciation is recaptured at up to 25%, and gains may owe capital-gains tax (a 1031 exchange can defer both). Figures are a year-1 estimate at your 24.0% rate — not tax advice; consult a CPA.
Schools (NCES district)
- District
- Marion
- NCES district ID
- 1201260
- Math proficiency
- 42% ▼ -7.00%
- Reading proficiency
- 43% ▼ -4.00%
- Median HH income
- $40,015
- Composite
- 35.61/100
- National rank
- #4890
- State rank
- #61 of 73 in FL
Livability — Liberty Triangle
No livability data for this city. (Only ~50 U.S. cities are tracked.)
Census & demographics
- County
- Marion County · 315,796 people
- City population
- 26,397
- Metro
- Ocala, FL
- Population (ZIP)
- 26,782
- Household income
- $57,324
- Rent vs Own
- Severe rent burden
- 313.0
Population outlook (Marion County) Hauer SSP2
- Today (2025)
- 365,905 people
- By 2030
- 376,768 · +3.0%
- By 2040
- 396,555 · +8.4%
- By 2050
- 412,723 · +12.8%
- By 2075
- 446,090 · +21.9%
- By 2100
- 436,193 · +19.2%
Race, ethnicity, and origin ACS 2023
- Neighborhood character
- Predominantly White (80%)
- Race & ethnicity
- White 80% Hispanic / Latino 11% Black 7% Two or more races 5%
- Hispanic origin (detail)
- Mexican 4% Puerto Rican 4% Cuban 1%
- Common ancestry
- Romanian 7% Lithuanian 3% Slovak 2%
- Foreign-born
- 8% · Canada, Jamaica
- Languages at home
- 88% English-only · Spanish 9% French/Haitian/Cajun 1% German/W. Germanic 1%
Political lean MEDSL · Marion
- 2024 margin
- Solid R (+31.6) · D 33.8% · R 65.5%
- 2008→2024 swing
- -20.0pp toward R · 2008: -11.6pp · 2024: -31.6pp
- All cycles
- 2024: R+31.6 2020: R+25.9 2016: R+26.2 2012: R+16.2 2008: R+11.6
Not yet ingested
- Civics
- —
Market trends
- HPI YoY
- ▼ -67.48%
- Current HPI
- 199.986
- Rent YoY
- —
- Metro
- Ocala, FL
- State GDP YoY
- ▲ 3.28%
- F500 in state
- 36
Industry mix (Fortune 500 HQ in FL)
| Industry | F500 HQs | Revenue |
|---|---|---|
| Industrial Technology | 2 | $29B |
|
||
| Insurance | 2 | $17B |
|
||
| Retail | 1 | $60B |
|
||
| Technology Distribution | 1 | $58B |
|
||
| Homebuilding | 1 | $35B |
|
||
| Technology Manufacturing | 1 | $35B |
|
||
Price history
+329.5% since first listed8 events — show timeline
- 2026-03-25 Listed $149,900 Stellar MLS as Distributed by MLS Grid
- 2024-12-19 Listing Removed — Stellar MLS as Distributed by MLS Grid
- 2024-06-19 Listed $169,900 Stellar MLS as Distributed by MLS Grid
- 2004-08-31 Sold (Public Records) $55,900 Public Records
- 2004-08-05 Sold (MLS) $55,900 Stellar MLS as Distributed by MLS Grid
- 2004-05-27 Listed $55,900 Stellar MLS as Distributed by MLS Grid
- 1991-06-01 Sold (Public Records) $32,000 Public Records
- 1981-08-01 Sold (Public Records) $34,900 Public Records
Property tax history
+17.5%/yrLatest (2025): $2,654 · +1.4% YoY. Source: county tax records.
Cash-flow waterfall
monthlySold comps — $/sqft
last 12 mo · ≤1 miLoading sold comps…