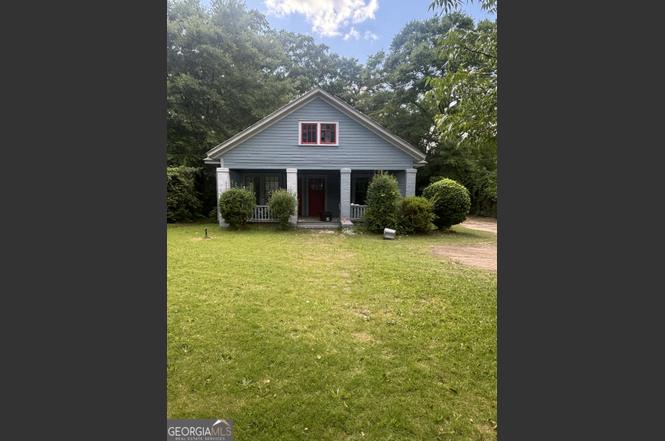
128 Springdale Rd · Elberton, GA
Flood risk 1/10 · Minimal
- FEMA flood zone
- X (unshaded)
- Chance of flooding over 30 yrs
- 0.0%
- Est. flood insurance / yr
- $507 – $1,088
Fire risk 4/10 · Minor
- Est. fire insurance / yr
- $963 – $1,789
Heat risk 6/10 · Moderate
- Hot days now (above 104°F)
- 7 days/yr
- Hot days in 30 yrs
- 17 days/yr
Wind risk 5/10 · Moderate
- Chance of severe wind over 30 yrs
- 26.0%
Air-quality risk 3/10 · Minor
- Unhealthy air days now
- 2 days/yr
- Unhealthy air days in 30 yrs
- 3 days/yr
Risk factors via First Street. Map © Google.
Why this score? — see what drove the B grade
The composite is a weighted blend of 9 inputs, each scored 0–100. Each bar is that input's sub-score; the figure is the points it added to the 100-point composite (weight × sub-score).
- Cash flow +24.6/30.0
- ARV discount +15.0/15.0
- Appreciation +10.0/10.0
- DSCR +7.9/10.0
- 1% rule +6.3/10.0
- Livability +3.0/5.0
- Rent growth +2.5/5.0
- Condition / age +2.5/5.0
- Schools +2.1/10.0
$125,000
🖨 Deal sheet 📄 Offer letter ✓ Due diligence
Listing remarks
Investor Special - Tons of Potential! Bring your vision to this charming Craftsman-style cottage nestled on a spacious, shaded lot. Featuring a welcoming front porch, mature trees, and plenty of curb appeal, this property offers an excellent opportunity for investors, flippers, or buyers looking to create their dream home. With solid character and endless possibilities, this home is ready for renovation and priced accordingly. Don't miss your chance to unlock its full potential. Sold As-Is.
Key facts
- Spacious shaded lot
- Curb appeal
- Mature trees
Tags
Property features AI
Finance
- Other: Property listed as fixer condition; Lot size approximately 0.8 acre
- Financial info: Listing available for cash offers
- HOA & community: No homeowners association; Community features include sidewalks, street lights, and proximity to shopping
Exterior
- Parking: Off-street parking
- Utilities: Public water; Public sewer; Electricity available; Natural gas available; Cable available; High-speed internet available
- Home design: Single-family house; One story; Residential property; Built in 1900
- Construction: Wood siding construction; Composition roof; Crawl space foundation; Originally built in 1900
- Exterior features: Composition roof; Wood siding; City lot; Level lot
Interior
- Kitchen: No appliances included
- Bedrooms: 2 bedrooms (both on main level)
- Flooring: Other flooring
- Bathrooms: 2 full bathrooms (both on main level)
- Heating & cooling: Central heating; Central air conditioning
- Interior features: High ceilings; Crawl space foundation
- Laundry & utility: Laundry closet; Additional utility space
Neighborhood map
What this means for you Summary
Snapshot
- This is a 3-bed/2.0-bath single-family listed at $125k.
Deal economics
- At list price, monthly cash flow is $258 ($3k/yr) — positive.
- The deal already cash-flows at list — no discount required.
- Meets the 1% rule at list price ($1k rent vs $125k).
- Recommended offer: $123k (1.5% below list) — sets the bar for market timing.
- Cap rate 8.8% vs local median 3.6% in Elberton — top-decile yield for the area; either an underpriced asset or a hidden risk that comps aren't pricing in. Stress-test before assuming the spread holds.
Location & tenants
- Location reads 60/100 on livability (#375 in GA) — a middle-class / working-renter tenant base. Strengths: cost of living A+, health & safety A+, housing B; Watch: schools F, crime F, amenities F.
- Elbert County (rural): math 26% / reading 25% proficiency, ranked #124 of 174 in GA (top 71%) — low school quality limits family demand, transient renter base, plan for 1-2y turnover; 61% free/reduced lunch — lower-income household profile, screen leases tightly.
- Market conditions: 183 active listings in the ZIP; 77 units permitted in Elbert County in 2024 (0 in 5+ unit buildings).
Forward outlook
- In year one you build about $13k of equity ($864 loan paydown + $12k appreciation (10.0% local appreciation)).
- Elbert County population projected at -28% by 2050 — secular population decline; favor cash flow + early exit over multi-decade hold.
- At projected returns (10.0% appreciation + 3.0% rent growth), your $35k cash investment doubles in ~3 years — after that, you're playing with house money.
- By year 3, paydown + projected appreciation supports a ~$34k cash-out refi (75% LTV) — recoverable capital for the next deal without selling this one.
Negotiation context
- It's been on market 16 days — a 2% lower offer ($123k) is reasonable based on typical stale-listing flexibility.
Risks & watch-outs
- Watch-outs: built in 1900 — expect roof / HVAC / electrical / plumbing capex.
- Climate carrying-cost: moderate wind risk, 26% chance of damaging wind over 30y; extreme-heat days projected 7→17/yr by 2055 (HVAC capex compounding) — expect insurance premiums to compound above CPI over the hold.
Questions for the listing agent
- Built in 1900 — when were the roof, HVAC, electrical panel, plumbing, and water heater last replaced?
- Is there a deadline driving the sale (1031 exchange, divorce, estate, relocation)? That informs how much negotiation room exists.
- Schools are F-rated, which usually means shorter tenancies and higher turnover. Who's the typical renter profile here, and what's been the actual vacancy rate?
- Crime grade is F in this area — have there been break-ins, vandalism, or insurance claims at this property in the last 3 years? What carrier currently insures it and at what premium?
- What's the average days-on-market for RENTAL listings here right now (not sales)? A rising rental-DOM trend means longer vacancies and softer asking-rent achievability than the comps imply.
- What's the recent tenant-quality profile in this submarket — average credit score on applications, eviction rate, late-payment / NSF rate, and stable-employment percentage? A property-management company in the area should have these aggregated.
- How much new for-sale + rental construction is in the pipeline within 1–3 miles? Heavy new supply typically softens prices + rents 12–24 months out; constrained supply supports both.
Investment metrics
- 1% rule
- 1.13% ✓
- Cap rate
- 8.77%
- Cash-on-cash
- 8.83%
- DSCR
- 1.39
- GRM
- 7.4
CMA / ARV
- ARV (on-the-fly)
- $206,338
- Comps found
- 11
Show comp detail 11 sales within ~0.75 mi
| Address | Dist | Beds/Ba | Sqft | Sold | Price | $/sf | Match |
|---|---|---|---|---|---|---|---|
| 131 S Thomas St | 0.33mi | 2/2.0 (-1) | 1,848 (+1%) | 1mo | $197,000 | $107 | 76 |
| 155 Myrtle St | 0.25mi | 2/2.0 (-1) | 1,867 (+2%) | 5mo | $163,000 | $87 | 76 |
| 141 Wildwood Dr | 0.57mi | 3/2.0 | 1,771 (-3%) | 1mo | $115,000 | $65 | 67 |
| 813 Sherwood Dr | 0.48mi | 3/2.0 | 1,828 (+0%) | 14mo | $250,000 | $137 | 66 |
| 173 Brookside Dr | 0.28mi | 3/2.5 | 2,041 (+12%) | 5mo | $300,000 | $147 | 61 |
| 178 Heard Dr | 0.50mi | 3/2.0 | 1,736 (-5%) | 11mo | $250,000 | $144 | 60 |
| 37 W Church St | 0.64mi | 3/2.0 | 1,679 (-8%) | 2mo | $253,000 | $151 | 55 |
| 151 Wildwood Dr | 0.52mi | 3/2.5 | 2,002 (+10%) | 11mo | $246,350 | $123 | 49 |
| 118 Lake Forest Dr | 0.74mi | 3/2.0 | 1,599 (-12%) | 16mo | $153,000 | $96 | 31 |
| 116 Lake Forest Dr | 0.73mi | 4/2.0 (+1) | 1,707 (-6%) | 24mo | $190,000 | $111 | 30 |
| 112 Lake Forest Dr | 0.70mi | 4/3.0 (+1) | 1,726 (-6%) | 24mo | $195,000 | $113 | 29 |
Match score weights: distance 35% · size 25% · config 20% · recency 20%. Top-matched comps best support the ARV.
Projected returns pro-forma
10.0% appreciation · 3.0% rent growth · sell at horizon
- IRR
- 30.7%
- Equity multiple
- 3.41×
- Total profit
- $84,498
- Equity at exit
- $112,610
- IRR
- 26.6%
- Equity multiple
- 7.74×
- Total profit
- $235,974
- Equity at exit
- $242,848
Cash invested: $35,000 (down + closing). Projections, not guarantees.
Landlord ↔ Tenant lean methodology
- Overall (STATE)
- 90 Strongly Landlord-Friendly
- State Georgia
- 90 Strongly Landlord-Friendly · R+3
- County
- — inherits STATE
- City
- — inherits STATE
ZIP-level market 30635
- Home prices YoY
- 4.1%
- Active inventory
- 183
- Price-to-rent
- 7.4×
Monthly cashflow live
- Estimated rent
- $1,415 medium interval (Pro) →
- Mortgage (P&I)
- −$656
- Tax from tax record
- −$153 /mo · $1,830/yr
- Insurance
- −$52
- HOA
- −$0
- Vacancy / Maint / Mgmt
- −$297
- Net cashflow
- $258
Break-even live
UW: 25.0% down · 7.5% · 30yr · 1.5% tax · 5.0% vac · 8.0% maint · 8.0% mgmt
Financing live
Cash to close
- Down payment
- $31,250
- Closing costs
- $3,750
- Reserves months
- —
- Total cash needed
- —
Loan-product check · same deal, 3 products live
Conventional
25% down · 7.5% · 30yr
- Down + closing
- —
- Monthly P&I
- —
- Monthly cashflow
- —
- DSCR
- —
- Eligible?
- —
Personal DTI + credit; lowest rate.
DSCR
20% down · 8.5% · 30yr
- Down + closing
- —
- Monthly P&I
- —
- Monthly cashflow
- —
- DSCR
- —
- Eligible?
- —
No personal income docs; deal must DSCR.
Hard money
10% down · 12.0% · 12mo
- Down + closing
- —
- Monthly P&I
- —
- Monthly cashflow
- —
- DSCR
- —
- Eligible?
- —
Short-term bridge; refi at stabilization.
Listing history 12 events
-
2026-06-17status $125,000 Under Contract 16 DOM
-
2026-06-17days on market $125,000 Active 16 DOM
-
2026-06-16days on market $125,000 Active 15 DOM
-
2026-06-15statusdays on market $125,000 Active 14 DOM
-
2026-06-14days on market $125,000 New 12 DOM
-
2026-06-13days on market $125,000 New 11 DOM
-
2026-06-10days on market $125,000 New 9 DOM
-
2026-06-09days on market $125,000 New 8 DOM
-
2026-06-08days on market $125,000 New 7 DOM
-
2026-06-07days on market $125,000 New 6 DOM
-
2026-06-02remarks 498-char remark
-
2026-06-02$125,000 New 1 DOM
ⓘ Source: listings_history table (triggers on properties + properties_extension) + one-shot
backfill from property_details.listing_events for pre-trigger history.
Tax reassessment forecast GA · Resets to sale price
- Current annual tax
- $1,830 · $153/mo
- Projected year-2 tax
- $1,830 · $153/mo
- Expected delta
- $0/yr ($0/mo · 0.0%)
ⓘ Screening estimate from a state-policy table — verify with the county assessor before closing.
Climate risk First Street
- Flood 1/10 Low FEMA zone X (unshaded) · 0% chance over 30 yrs
- Wildfire 4/10 Moderate
- Heat 6/10 Major 7 d/yr ≥104°F today · 17 d/yr by 30 yrs out
- Wind 5/10 Major 26% chance of damaging wind over 30 yrs
- Air quality 3/10 Moderate 2 unhealthy d/yr today · 3 by 30 yrs out
Nearby sold comps map
Loading sold comps map…
Walkable amenities ~0.75 mi
Loading nearby amenities…
Taxation est. · year 1
- Rental income
- $16,977
- − Mortgage interest
- −$7,002
- − Property taxes
- −$1,830
- − Insurance
- −$625
- − Repairs & maintenance
- −$1,358
- − Management
- −$1,358
- − Depreciation
- −$3,636
- Taxable income
- $1,167
- Est. tax owed @ 24.0%
- −$280
- After-tax cash flow
- $2,810/yr
For passive investors: Depreciation is non-cash, so a rental often shows a tax loss while cash-flowing — sheltering income. Rental losses are passive: they offset passive income freely, and up to $25,000/yr can offset ordinary (W-2) income if you actively participate and your MAGI is under $100k (phasing out to $0 by $150k); unused losses carry forward. On sale, claimed depreciation is recaptured at up to 25%, and gains may owe capital-gains tax (a 1031 exchange can defer both). Figures are a year-1 estimate at your 24.0% rate — not tax advice; consult a CPA.
Schools (NCES district)
- District
- Elbert County
- NCES district ID
- 1302010
- Math proficiency
- 26% ▼ -3.00%
- Reading proficiency
- 25% ▼ -3.00%
- Median HH income
- $34,498
- Composite
- 21.0/100
- National rank
- #8458
- State rank
- #124 of 174 in GA
Livability — Elberton
- Score
- 60/100
- State rank
- #375
- US rank
- #19001
Category grades
Schools grade is shown separately in the Schools card above.
Census & demographics
- Census place
- Elberton, GA
- Population (ZIP)
- 15,107
Population outlook (Elbert County) Hauer SSP2
- Today (2025)
- 17,648 people
- By 2030
- 16,675 · -5.5%
- By 2040
- 14,631 · -17.1%
- By 2050
- 12,632 · -28.4%
- By 2075
- 8,704 · -50.7%
- By 2100
- 5,958 · -66.2%
Race, ethnicity, and origin ACS 2023
- Neighborhood character
- Diverse neighborhood (Simpson 0.57)
- Race & ethnicity
- White 58% Black 29% Two or more races 7% Hispanic / Latino 6% Asian 1%
- Hispanic origin (detail)
- Mexican 4% Cuban 1%
- Common ancestry
- Lithuanian 2% Slovak 1% Romanian 1%
- Foreign-born
- 5% · Canada, Dominican Republic, China
- Languages at home
- 94% English-only · Spanish 5%
Political lean MEDSL · Elbert
- 2024 margin
- Solid R (+43.4) · D 28.2% · R 71.5%
- 2008→2024 swing
- -25.3pp toward R · 2008: -18.1pp · 2024: -43.4pp
- All cycles
- 2024: R+43.4 2020: R+36.5 2016: R+34.9 2012: R+20.6 2008: R+18.1
Not yet ingested
- Civics
- —
Market trends
- HPI YoY
- ▲ 13.03%
- Current HPI
- 332.46
- Rent YoY
- —
- Metro
- —
- State GDP YoY
- ▲ 2.66%
- F500 in state
- 28
Industry mix (Fortune 500 HQ in GA)
| Industry | F500 HQs | Revenue |
|---|---|---|
| Paper / Packaging | 2 | $29B |
|
||
| Retail | 1 | $160B |
|
||
| Transportation / Logistics | 1 | $91B |
|
||
| Airlines | 1 | $62B |
|
||
| Consumer Goods | 1 | $47B |
|
||
| Utilities | 1 | $25B |
|
||
Price history
1 event — show timeline
- 2026-06-01 Listed $125,000 GAMLS
Property tax history
+5.1%/yrLatest (2025): $1,830 · +6.7% YoY. Source: county tax records.
Cash-flow waterfall
monthlySold comps — $/sqft
last 12 mo · ≤1 miLoading sold comps…