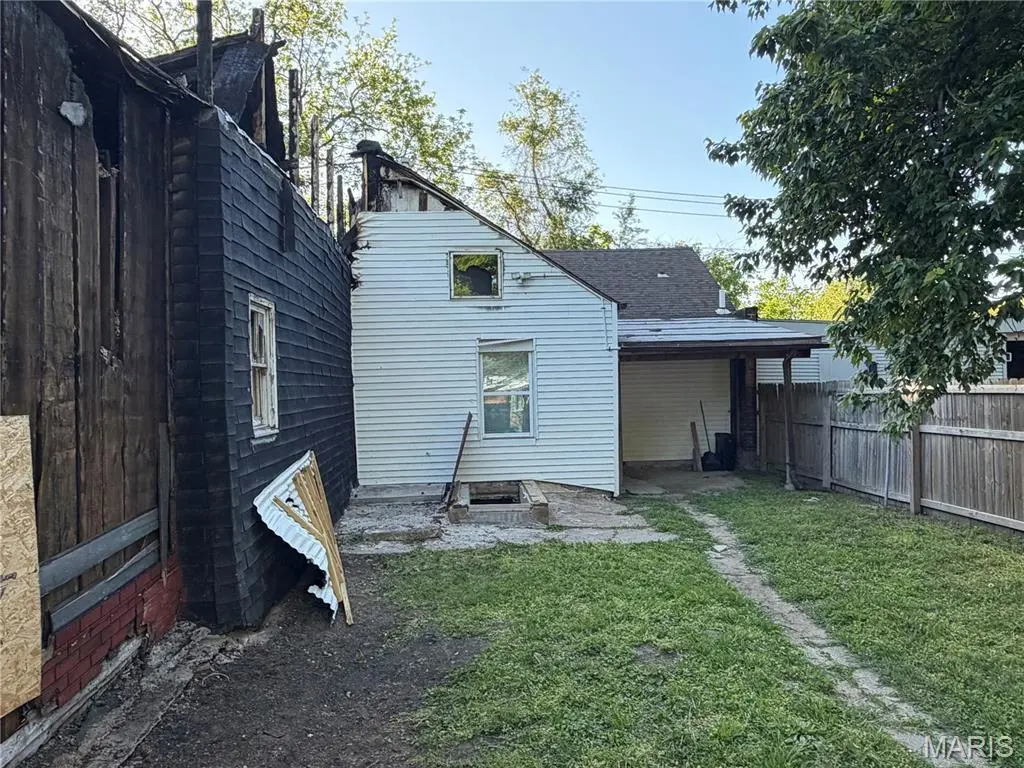
7135 Vermont Ave · St. Louis, MO
Flood risk 1/10 · Minimal
- FEMA flood zone
- X (unshaded)
- Chance of flooding over 30 yrs
- 0.0%
- Est. flood insurance / yr
- $473 – $860
Fire risk 1/10 · Minimal
- Est. fire insurance / yr
- $1,054 – $1,958
Heat risk 5/10 · Moderate
- Hot days now (above 109°F)
- 7 days/yr
- Hot days in 30 yrs
- 21 days/yr
Wind risk 2/10 · Minimal
- Chance of severe wind over 30 yrs
- 1.0%
Air-quality risk 3/10 · Minor
- Unhealthy air days now
- 3 days/yr
- Unhealthy air days in 30 yrs
- 4 days/yr
Risk factors via First Street. Map © Google.
Why this score? — see what drove the B- grade
The composite is a weighted blend of 9 inputs, each scored 0–100. Each bar is that input's sub-score; the figure is the points it added to the 100-point composite (weight × sub-score).
- Cash flow +30.0/30.0
- 1% rule +10.0/10.0
- DSCR +10.0/10.0
- ARV discount +7.5/15.0
- Rent growth +3.3/5.0
- Livability +2.5/5.0
- Condition / age +2.5/5.0
- Schools +1.2/10.0
- Appreciation +0.0/10.0
$20,000
🖨 Deal sheet 📄 Offer letter ✓ Due diligence
Listing remarks MLS
"Welcome to your cozy turnkey home''—your ideal 1-bed, 1-bath home conveniently located near highways, Carondelet Park, shopping, and minutes away from downtown. It's perfect for your starter home or a savvy investor income producing property. This home is move-in ready with new LVP flooring, stainless steel appliances, and modern systems. Spot the red cellar door out front? It leads to the basement, housing all your essential systems. Don't miss out; Investor Special that fits the 1% rule, to be sold AS IS!
Key facts
- 2,874 sq ft lot
- Built 1893
- Listed 56 days
Property features AI
Finance
- Financial info: Seller may consider concessions; Lease not considered
Exterior
- Utilities: Public water; Public sewer; Electric service by Ameren; Cable available; Electricity connected; Sewer connected; Water connected
- Home design: Single family residence; One level
- Construction: Vinyl siding
- Exterior features: City lot; Neighborhood: Carondelet
Interior
- Bedrooms: 1 bedroom (main level)
- Bathrooms: 1 full bathroom (main level)
- Heating & cooling: Electric heating; Central air conditioning
- Interior features: Cellar (basement)
Neighborhood map
What this means for you Summary
Snapshot
- This is a 1-bed/1.0-bath single-family listed at $20k.
Deal economics
- At list price, monthly cash flow is $452 ($5k/yr) — positive.
- The deal already cash-flows at list — no discount required.
- Meets the 1% rule at list price ($800 rent vs $20k).
- Recommended offer: $19k (3.0% below list) — sets the bar for market timing.
- Cap rate 33.4% vs local median 5.0% in St. Louis — top-decile yield for the area; either an underpriced asset or a hidden risk that comps aren't pricing in. Stress-test before assuming the spread holds.
Location & tenants
- Location reads: area grade B — affects rentability + tenant quality, not the cash-flow math above.
- St. Louis City (urban): math 10% / reading 18% proficiency, ranked #312 of 324 in MO (top 96%) — low school quality limits family demand, transient renter base, plan for 1-2y turnover; 80% free/reduced lunch — lower-income household profile, screen leases tightly.
- Zoned schools: Woerner Elem. (math 8% / reading 17%, grade F, #1,007 of 1,115 statewide, top 91%, 362 students, 99% FRL); Roosevelt High (math 2% / reading 8%, grade F, #517 of 521 statewide, top 100%, 460 students, 99% FRL) — zoned schools average 99% FRL vs 80% district-wide (19 pts higher); higher-poverty schools than district average — tighter screening recommended.
- Market conditions: Rents rising (+3.3%/yr); 125 active listings in the ZIP; 28 comparable units currently listed for rent nearby; rentals lingering (median 44d on market — plan ~5-8 weeks vacancy on turnover, expect pricing pressure); 50% of comp listings sitting > 30 days — soft ceiling on asking rent; 294 units permitted in St. Louis city in 2024 (227 in 5+ unit buildings).
Forward outlook
- Local home prices are declining (-3.0%/yr); year-one equity from $138 of loan paydown is wiped out by about $600 of value loss. Plan a longer hold.
- St. Louis County population projected to shrink 6% by 2050 — rents likely to lag national; underwrite the cash flow, not the appreciation.
- At projected returns (-3.0% appreciation + 3.3% rent growth), your $6k cash investment doubles in ~2 years — after that, you're playing with house money.
Negotiation context
- It's been on market 56 days — a 3% lower offer ($19k) is reasonable based on typical stale-listing flexibility.
- 2 sale attempts since 3y ago with the ask held roughly flat each time — persistent listings suggest the price (not the market) is what's stuck; bring a comps-based counter.
Risks & watch-outs
- Watch-outs: property tax is 4.0% of price; built in 1893 — expect roof / HVAC / electrical / plumbing capex.
- Climate carrying-cost: extreme-heat days projected 7→21/yr by 2055 (HVAC capex compounding) — expect insurance premiums to compound above CPI over the hold.
Questions for the listing agent
- It's been on market 56 days. Have you received any prior offers? Is the seller open to a 3% concession, seller financing, or rate buy-down credit?
- Built in 1893 — when were the roof, HVAC, electrical panel, plumbing, and water heater last replaced?
- Property tax is high relative to price — has the assessment been appealed recently, and will the sale trigger a re-assessment?
- Is there a deadline driving the sale (1031 exchange, divorce, estate, relocation)? That informs how much negotiation room exists.
- What's the average days-on-market for RENTAL listings here right now (not sales)? A rising rental-DOM trend means longer vacancies and softer asking-rent achievability than the comps imply.
- What's the recent tenant-quality profile in this submarket — average credit score on applications, eviction rate, late-payment / NSF rate, and stable-employment percentage? A property-management company in the area should have these aggregated.
- How much new for-sale + rental construction is in the pipeline within 1–3 miles? Heavy new supply typically softens prices + rents 12–24 months out; constrained supply supports both.
Investment metrics
- 1% rule
- 4.00% ✓
- Cap rate
- 33.42%
- Cash-on-cash
- 96.89%
- DSCR
- 5.31
- GRM
- 2.1
CMA / ARV
- ARV (median comp)
- $113,620
- List price
- $20,000
- Delta
- -82.40%
- Verdict
- UNDERPRICED
- Comps
- 20 within 1.0 mi
Show comp detail 12 sales within ~0.75 mi
| Address | Dist | Beds/Ba | Sqft | Sold | Price | $/sf | Match |
|---|---|---|---|---|---|---|---|
| 7116 Vermont Ave | 0.05mi | 2/1.0 (+1) | 759 (+8%) | 11mo | $129,900 | $171 | 70 |
| 7413 Pennsylvania Ave | 0.30mi | 1/1.0 | 673 (-4%) | 12mo | $62,000 | $92 | 69 |
| 6107 Alaska Ave | 0.74mi | 1/1.0 | 701 (-0%) | 1mo | $55,000 | $78 | 64 |
| 925 Iron | 0.64mi | 2/1.0 (+1) | 714 (+2%) | 0mo | $130,000 | $182 | 62 |
| 7923 Water St | 0.64mi | 2/1.0 (+1) | 688 (-2%) | 1mo | $99,000 | $144 | 61 |
| 7320 Eugene Ave | 0.50mi | 1/1.0 | 762 (+8%) | 2mo | $135,000 | $177 | 60 |
| 6425 Alabama Ave | 0.45mi | 1/1.0 | 760 (+8%) | 11mo | $75,000 | $99 | 56 |
| 6925 Field Ave | 0.66mi | 1/1.0 | 672 (-4%) | 13mo | $115,000 | $171 | 52 |
| 217 W Schirmer St | 0.39mi | 2/1.0 (+1) | 777 (+11%) | 10mo | $59,900 | $77 | 51 |
| 3624 Steins St | 0.52mi | 2/1.0 (+1) | 780 (+11%) | 8mo | $150,000 | $192 | 46 |
| 3749 Roswell Ave | 0.61mi | 2/1.0 (+1) | 768 (+9%) | 8mo | $147,000 | $191 | 44 |
| 3638 Koeln Ave | 0.50mi | 2/1.0 (+1) | 805 (+15%) | 9mo | $140,000 | $174 | 40 |
Match score weights: distance 35% · size 25% · config 20% · recency 20%. Top-matched comps best support the ARV.
Projected returns pro-forma
-3.0% appreciation · 3.27% rent growth · sell at horizon
- IRR
- 98.2%
- Equity multiple
- 5.61×
- Total profit
- $25,813
- Equity at exit
- $2,982
- IRR
- —
- Equity multiple
- 11.82×
- Total profit
- $60,611
- Equity at exit
- $1,729
Cash invested: $5,600 (down + closing). Projections, not guarantees.
Landlord ↔ Tenant lean methodology
- Overall (STATE)
- 81 Strongly Landlord-Friendly
- State Missouri
- 81 Strongly Landlord-Friendly · R+10
- County
- — inherits STATE
- City
- — inherits STATE
ZIP-level market 63111
- Rents YoY
- 3.3%
- Active inventory
- 125
- Price-to-rent
- 2.1×
Monthly cashflow live
- Estimated rent
- $800 high interval (Pro) →
- Mortgage (P&I)
- −$105
- Tax from tax record
- −$66 /mo · $796/yr
- Insurance
- −$8
- HOA
- −$0
- Vacancy / Maint / Mgmt
- −$168
- Net cashflow
- $452
Break-even live
UW: 25.0% down · 7.5% · 30yr · 1.5% tax · 5.0% vac · 8.0% maint · 8.0% mgmt
Financing live
Cash to close
- Down payment
- $5,000
- Closing costs
- $600
- Reserves months
- —
- Total cash needed
- —
Loan-product check · same deal, 3 products live
Conventional
25% down · 7.5% · 30yr
- Down + closing
- —
- Monthly P&I
- —
- Monthly cashflow
- —
- DSCR
- —
- Eligible?
- —
Personal DTI + credit; lowest rate.
DSCR
20% down · 8.5% · 30yr
- Down + closing
- —
- Monthly P&I
- —
- Monthly cashflow
- —
- DSCR
- —
- Eligible?
- —
No personal income docs; deal must DSCR.
Hard money
10% down · 12.0% · 12mo
- Down + closing
- —
- Monthly P&I
- —
- Monthly cashflow
- —
- DSCR
- —
- Eligible?
- —
Short-term bridge; refi at stabilization.
Rent comps 28 comps
| Address | Beds | Baths | Sqft | Rent | $/sqft | DOM | Units | Dist |
|---|---|---|---|---|---|---|---|---|
| 7320 Vermont Ave Unit 2nd St. Louis, MO | 1.0 | 1.0 | 710 | $750 | $1.06 | 43d | 1 | 0.13mi |
| 7614 Virginia Ave Unit 7614 St. Louis, MO | 2.0 | 1.0 | 750 | $750 | $1.00 | 23d | 1 | 0.36mi |
| 807 W Courtois St Apt B St. Louis, MO | 1.0 | 1.0 | 600 | $735 | $1.23 | 43d | 1 | 0.44mi |
| 7851 Bandero Dr Saint Louis, MO | 1.0–2.0 | 1.0 | 800 | $1,000 | $1.25 | 11d | 1 | 0.58mi |
| 3601 Holly Hills Blvd Apt 19 St. Louis, MO | 2.0 | 1.0 | 700 | $875 | $1.25 | 2d | 1 | 0.61mi |
| 6327 S Grand Blvd Unit 1E St. Louis, MO | 1.0 | 1.0 | 650 | $799 | $1.23 | 43d | 1 | 0.64mi |
| 8125 Michigan Ave St. Louis, MO | 1.0–2.0 | 1.0–2.0 | 797 | $820 | $1.03 | 14d | 1 | 0.68mi |
| 5507 Louisiana 2nd fl St. Louis, MO | 1.0 | 1.0 | 705 | $795 | $1.13 | 43d | 1 | 0.89mi |
| 8511 Idaho Ave Unit 1st Floor St. Louis, MO | 1.0 | 1.0 | 750 | $850 | $1.13 | 12d | 1 | 0.93mi |
| 218-220 Bellerive Blvd Unit 218 St. Louis, MO | 1.0 | 1.0 | 550 | $725 | $1.32 | 11d | 1 | 0.96mi |
| 120 Bellerive Blvd Saint Louis, MO | 1.0 | 1.0 | 700 | $795 | $1.14 | 43d | 1 | 0.98mi |
| 112 Bellerive Blvd Saint Louis, MO | 1.0 | 1.0 | 700 | $795 | $1.14 | 43d | 1 | 0.98mi |
| 5625 S Grand Blvd Unit 2D St. Louis, MO | 1.0 | 1.0 | 650 | $840 | $1.29 | 10d | 1 | 0.99mi |
| 5625 S Grand Blvd Unit 5625 St. Louis, MO | 1.0 | 1.0 | 650 | $840 | $1.29 | 23d | 1 | 0.99mi |
| 5618 S Grand Blvd Unit 10 St. Louis, MO | 1.0 | 1.0 | 600 | $799 | $1.33 | 43d | 1 | 1.00mi |
| 510 Fassen St Unit 510 St. Louis, MO | 1.0 | 1.0 | 700 | $850 | $1.21 | 14d | 1 | 1.05mi |
| 510 Fassen St Unit 512 St. Louis, MO | 1.0 | 1.0 | 700 | $795 | $1.14 | 14d | 1 | 1.05mi |
| 440 Eichelberger St Saint Louis, MO | 2.0 | 1.0 | 750 | $850 | $1.13 | 2d | 1 | 1.16mi |
| 5305 S Compton Ave St. Louis, MO | 2.0 | 1.0 | 750 | $825 | $1.10 | 43d | 1 | 1.17mi |
| 329 Eichelberger St Unit D St. Louis, MO | 1.0 | 1.0 | 550 | $899 | $1.63 | 43d | 1 | 1.21mi |
| 329 Eichelberger St Unit A St. Louis, MO | 1.0 | 1.0 | 550 | $890 | $1.62 | 23d | 1 | 1.21mi |
| 5043 Alaska Ave Unit B St. Louis, MO | 1.0 | 1.0 | 750 | $820 | $1.09 | 21d | 1 | 1.27mi |
| 5043 Alaska Ave Unit D St. Louis, MO | 1.0 | 1.0 | 750 | $795 | $1.06 | 43d | 1 | 1.27mi |
| 4117 Germania St Saint Louis, MO | 1.0 | 1.0 | 750 | $925 | $1.23 | 43d | 1 | 1.27mi |
| 7500 Morganford Rd Saint Louis, MO | 1.0 | 1.0 | 750 | $925 | $1.23 | 43d | 1 | 1.32mi |
| 3440 Delor St Unit 3444 Delor 2W St. Louis, MO | — | 1.0 | 450 | $575 | $1.28 | 23d | 1 | 1.34mi |
| 3608 Delor St Apt C St. Louis, MO | — | 1.0 | 700 | $850 | $1.21 | 43d | 1 | 1.38mi |
| 6725 Wanda Ave Saint Louis, MO | 2.0 | 1.0 | 700 | $1,100 | $1.57 | 43d | 1 | 1.46mi |
Listing history 22 events
-
2026-06-18days on market $20,000 Active 56 DOM
-
2026-06-17days on market $20,000 Active 55 DOM
-
2026-06-16days on market $20,000 Active 54 DOM
-
2026-06-15days on market $20,000 Active 53 DOM
-
2026-06-13days on market $20,000 Active 51 DOM
-
2026-06-09days on market $20,000 Active 47 DOM
-
2026-06-08days on market $20,000 Active 46 DOM
-
2026-06-07days on market $20,000 Active 45 DOM
-
2026-06-05days on market $20,000 Active 42 DOM
-
2026-06-03days on market $20,000 Active 41 DOM
-
2026-06-02days on market $20,000 Active 40 DOM
-
2026-06-01days on market $20,000 Active 39 DOM
-
2026-05-31days on market $20,000 Active 38 DOM
-
2026-04-23$20,000 Active 531-char remark
-
2023-11-13soldstatus
-
2023-11-09soldstatus Closed 524-char remark
Show marketing remark (524 chars)
"Welcome to your cozy turnkey home''—your ideal 1-bed, 1-bath home conveniently located near highways, Carondelet Park, shopping, and minutes away from downtown. It's perfect for your starter home or a savvy investor income producing property. This home is move-in ready with new LVP flooring, stainless steel appliances, and modern systems. Spot the red cellar door out front? It leads to the basement, housing all your essential systems. Don't miss out; Investor Special that fits the 1% rule, to be sold AS IS!
-
2023-10-29status Pending 524-char remark
Show marketing remark (524 chars)
"Welcome to your cozy turnkey home''—your ideal 1-bed, 1-bath home conveniently located near highways, Carondelet Park, shopping, and minutes away from downtown. It's perfect for your starter home or a savvy investor income producing property. This home is move-in ready with new LVP flooring, stainless steel appliances, and modern systems. Spot the red cellar door out front? It leads to the basement, housing all your essential systems. Don't miss out; Investor Special that fits the 1% rule, to be sold AS IS!
-
2023-10-23price $55,000 524-char remark
Show marketing remark (524 chars)
"Welcome to your cozy turnkey home''—your ideal 1-bed, 1-bath home conveniently located near highways, Carondelet Park, shopping, and minutes away from downtown. It's perfect for your starter home or a savvy investor income producing property. This home is move-in ready with new LVP flooring, stainless steel appliances, and modern systems. Spot the red cellar door out front? It leads to the basement, housing all your essential systems. Don't miss out; Investor Special that fits the 1% rule, to be sold AS IS!
-
2023-10-11price $65,000 524-char remark
Show marketing remark (524 chars)
"Welcome to your cozy turnkey home''—your ideal 1-bed, 1-bath home conveniently located near highways, Carondelet Park, shopping, and minutes away from downtown. It's perfect for your starter home or a savvy investor income producing property. This home is move-in ready with new LVP flooring, stainless steel appliances, and modern systems. Spot the red cellar door out front? It leads to the basement, housing all your essential systems. Don't miss out; Investor Special that fits the 1% rule, to be sold AS IS!
-
2023-09-29$75,000 Active 524-char remark
Show marketing remark (524 chars)
"Welcome to your cozy turnkey home''—your ideal 1-bed, 1-bath home conveniently located near highways, Carondelet Park, shopping, and minutes away from downtown. It's perfect for your starter home or a savvy investor income producing property. This home is move-in ready with new LVP flooring, stainless steel appliances, and modern systems. Spot the red cellar door out front? It leads to the basement, housing all your essential systems. Don't miss out; Investor Special that fits the 1% rule, to be sold AS IS!
-
2019-12-03soldstatus
-
1996-03-06soldstatus
ⓘ Source: listings_history table (triggers on properties + properties_extension) + one-shot
backfill from property_details.listing_events for pre-trigger history.
Tax reassessment forecast MO · Resets to sale price
- Current annual tax
- $796 · $66/mo
- Projected year-2 tax
- $796 · $66/mo
- Expected delta
- $0/yr ($0/mo · 0.0%)
ⓘ Screening estimate from a state-policy table — verify with the county assessor before closing.
Climate risk First Street
- Flood 1/10 Low FEMA zone X (unshaded) · 0% chance over 30 yrs
- Wildfire 1/10 Low
- Heat 5/10 Major 7 d/yr ≥109°F today · 21 d/yr by 30 yrs out
- Wind 2/10 Low 100% chance of damaging wind over 30 yrs
- Air quality 3/10 Moderate 3 unhealthy d/yr today · 4 by 30 yrs out
Nearby sold comps map
Loading sold comps map…
Walkable amenities ~0.75 mi
Loading nearby amenities…
Taxation est. · year 1
- Rental income
- $9,596
- − Mortgage interest
- −$1,120
- − Property taxes
- −$796
- − Insurance
- −$100
- − Repairs & maintenance
- −$768
- − Management
- −$768
- − Depreciation
- −$582
- Taxable income
- $5,462
- Est. tax owed @ 24.0%
- −$1,311
- After-tax cash flow
- $4,115/yr
For passive investors: Depreciation is non-cash, so a rental often shows a tax loss while cash-flowing — sheltering income. Rental losses are passive: they offset passive income freely, and up to $25,000/yr can offset ordinary (W-2) income if you actively participate and your MAGI is under $100k (phasing out to $0 by $150k); unused losses carry forward. On sale, claimed depreciation is recaptured at up to 25%, and gains may owe capital-gains tax (a 1031 exchange can defer both). Figures are a year-1 estimate at your 24.0% rate — not tax advice; consult a CPA.
Schools (NCES district)
- District
- St. Louis City
- NCES district ID
- 2929280
- Math proficiency
- 10% ▼ -6.00%
- Reading proficiency
- 18% ▼ -3.00%
- Median HH income
- $35,685
- Composite
- 11.54/100
- National rank
- #9699
- State rank
- #312 of 324 in MO
Livability — St. Louis
No livability data for this city. (Only ~50 U.S. cities are tracked.)
Census & demographics
- Census place
- St. Louis, MO
- County
- Saint Louis City · 254,015 people
- City population
- 283,259
- Metro
- St. Louis, MO-IL
- Population (ZIP)
- 18,851
- Household income
- $47,039
- Rent vs Own
- Severe rent burden
- 1364.0
Population outlook (St. Louis County) Hauer SSP2
- Today (2025)
- 315,737 people
- By 2030
- 313,865 · -0.6%
- By 2040
- 305,439 · -3.3%
- By 2050
- 296,529 · -6.1%
- By 2075
- 271,028 · -14.2%
- By 2100
- 255,359 · -19.1%
Race, ethnicity, and origin ACS 2023
- Neighborhood character
- Diverse neighborhood (Simpson 0.65)
- Race & ethnicity
- Black 42% White 41% Two or more races 11% Hispanic / Latino 9% Asian 1%
- Hispanic origin (detail)
- Mexican 6%
- Common ancestry
- Lithuanian 3% Slovak 1% Romanian 1%
- Foreign-born
- 7% · Canada, India
- Languages at home
- 90% English-only · Spanish 7% Other Indo-European 1%
Political lean MEDSL · St. Louis
- 2024 margin
- Solid D (+64.7) · D 81.4% · R 16.7% · Other 2.0%
- 2008→2024 swing
- -3.5pp toward R · 2008: 68.2pp · 2024: 64.7pp
- All cycles
- 2024: D+64.7 2020: D+66.2 2016: D+63.7 2012: D+66.6 2008: D+68.2
Not yet ingested
- Civics
- —
Market trends
- HPI YoY
- ▼ -92.80%
- Current HPI
- 169.4644
- Rent YoY
- ▲ 3.27%
- Metro
- St. Louis, MO-IL
- State GDP YoY
- ▲ 1.84%
- F500 in state
- 20
Industry mix (Fortune 500 HQ in MO)
| Industry | F500 HQs | Revenue |
|---|---|---|
| Healthcare | 1 | $163B |
|
||
| Insurance | 1 | $21B |
|
||
| Industrial Technology | 1 | $17B |
|
||
| Retail | 1 | $16B |
|
||
| Industrial Distribution | 1 | $10B |
|
||
| Utilities | 1 | $9B |
|
||
Price history
-73.3% since first listed9 events — show timeline
- 2026-04-23 Listed $20,000 MARIS as Distributed by MLS Grid
- 2023-11-13 Sold (Public Records) — Public Records
- 2023-11-09 Sold (MLS) — MARIS as Distributed by MLS Grid
- 2023-10-29 Pending — MARIS as Distributed by MLS Grid
- 2023-10-23 Price Changed $55,000 MARIS as Distributed by MLS Grid
- 2023-10-11 Price Changed $65,000 MARIS as Distributed by MLS Grid
- 2023-09-29 Listed $75,000 MARIS as Distributed by MLS Grid
- 2019-12-03 Sold (Public Records) — Public Records
- 1996-03-06 Sold (Public Records) — Public Records
Property tax history
+12.6%/yrLatest (2024): $796 · +534.4% YoY. Source: county tax records.
Cash-flow waterfall
monthlySold comps — $/sqft
last 12 mo · ≤1 miLoading sold comps…