 🏢 Co-op
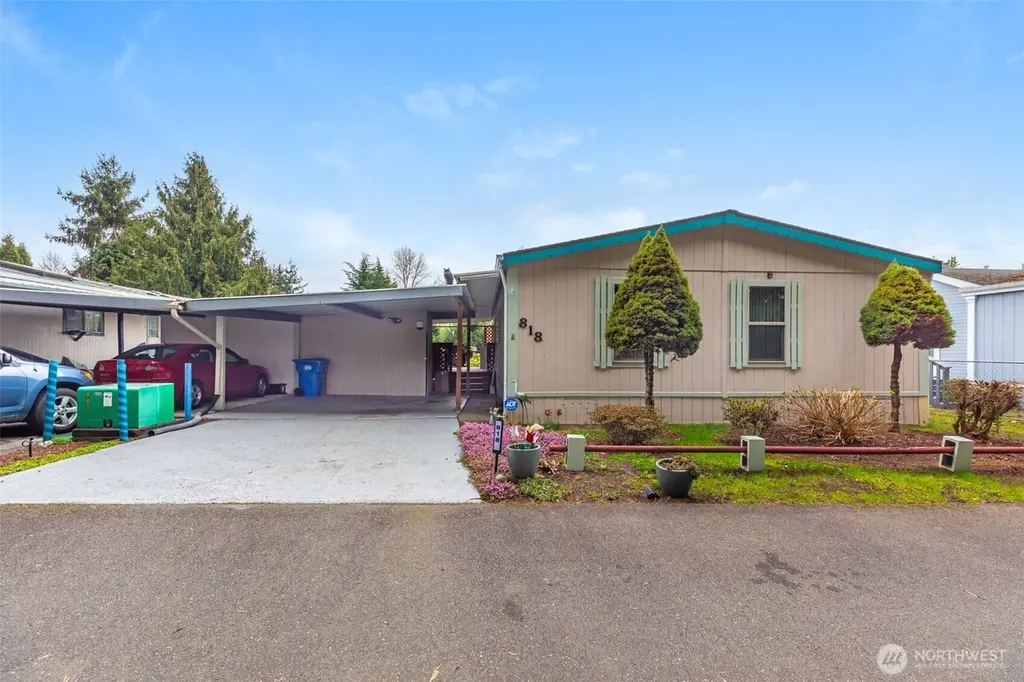
818 82nd St E #6 · Midland, WA
Flood risk 1/10 · Minimal
- FEMA flood zone
- X (unshaded)
- Chance of flooding over 30 yrs
- 0.0%
- Est. flood insurance / yr
- $507 – $1,088
Fire risk 1/10 · Minimal
- Est. fire insurance / yr
- $604 – $1,122
Heat risk 3/10 · Minor
- Hot days now (above 87°F)
- 7 days/yr
- Hot days in 30 yrs
- 13 days/yr
Wind risk 1/10 · Minimal
- Chance of severe wind over 30 yrs
- —
Air-quality risk 7/10 · Major
- Unhealthy air days now
- 10 days/yr
- Unhealthy air days in 30 yrs
- 12 days/yr
Risk factors via First Street. Map © Google.
Why this score? — see what drove the C- grade
The composite is a weighted blend of 9 inputs, each scored 0–100. Each bar is that input's sub-score; the figure is the points it added to the 100-point composite (weight × sub-score).
- Cash flow +24.4/30.0
- DSCR +7.9/10.0
- 1% rule +5.5/10.0
- Schools +3.9/10.0
- Livability +3.6/5.0
- Rent growth +2.9/5.0
- Condition / age +2.5/5.0
- ARV discount +0.1/15.0
- Appreciation +0.0/10.0
$190,000
🖨 Deal sheet 📄 Offer letter ✓ Due diligence
Listing remarks
A beautifully updated 3-bed, 1.75-bath home offering low-maintenance living in the peaceful 55+ Co-Op community of Ohana Estates. This 1,182 sq ft residence features an open, light-filled layout with extensive upgrades throughout, creating a fresh and move-in-ready feel. The kitchen, living, and dining areas flow comfortably for everyday living, while the bedrooms provide flexibility for guests, hobbies, or a dedicated office. Enjoy a low-maintenance lot perfect for relaxing or light gardening. Ideally located near shopping, medical services, and commuter routes, this home blends comfort, convenience, and a welcoming community lifestyle.
Key facts
- 2 parking spots
- Built 1989
- Listed 84 days
Neighborhood map
What this means for you Summary
Snapshot
- This is a 3-bed/2.0-bath manufactured listed at $190k.
Deal economics
- At list price, monthly cash flow is $386 ($5k/yr) — positive.
- The deal already cash-flows at list — no discount required.
- Meets the 1% rule at list price ($2k rent vs $190k).
- Recommended offer: $179k (6.0% below list) — sets the bar for market timing.
- Cap rate 8.7% vs local median 3.2% in Midland — top-decile yield for the area; either an underpriced asset or a hidden risk that comps aren't pricing in. Stress-test before assuming the spread holds.
Location & tenants
- Location reads 72/100 on livability (#208 in WA) — a middle-class / working-renter tenant base. Strengths: housing A+, health & safety A+; Watch: crime D, schools F, amenities F.
- Franklin Pierce School District (suburban): math 35% / reading 51% proficiency, ranked #197 of 291 in WA (top 68%) — families likely to look elsewhere, expect single-tenant / working-renter base with shorter leases.
- Market conditions: Rents rising (+1.6%/yr); 176 active listings in the ZIP; 28 comparable units currently listed for rent nearby; rentals leasing fast (median 13d on market — plan ~1-2 weeks tenant-placement turnaround); solid renter incomes; 3,209 units permitted in Pierce County in 2024 (1,269 in 5+ unit buildings).
Forward outlook
- Local home prices are declining (-3.0%/yr); year-one equity from $1k of loan paydown is wiped out by about $6k of value loss. Plan a longer hold.
- Pierce County population projected at +26% by 2050 — long-run rental-demand tailwind backs the buy-and-hold thesis.
Negotiation context
- It's been on market 84 days — a 6% lower offer ($179k) is reasonable based on typical stale-listing flexibility.
- 3 sale attempts since 3y ago with the ask held roughly flat each time — persistent listings suggest the price (not the market) is what's stuck; bring a comps-based counter.
Questions for the listing agent
- It's been on market 84 days. Have you received any prior offers? Is the seller open to a 6% concession, seller financing, or rate buy-down credit?
- Why hasn't it sold? Are there any deal-killer items the seller is aware of (foundation, flood, title, zoning, code violations)?
- Is there a deadline driving the sale (1031 exchange, divorce, estate, relocation)? That informs how much negotiation room exists.
- Schools are F-rated, which usually means shorter tenancies and higher turnover. Who's the typical renter profile here, and what's been the actual vacancy rate?
- Crime grade is D in this area — have there been break-ins, vandalism, or insurance claims at this property in the last 3 years? What carrier currently insures it and at what premium?
- What's the average days-on-market for RENTAL listings here right now (not sales)? A rising rental-DOM trend means longer vacancies and softer asking-rent achievability than the comps imply.
- What's the recent tenant-quality profile in this submarket — average credit score on applications, eviction rate, late-payment / NSF rate, and stable-employment percentage? A property-management company in the area should have these aggregated.
- How much new for-sale + rental construction is in the pipeline within 1–3 miles? Heavy new supply typically softens prices + rents 12–24 months out; constrained supply supports both.
Investment metrics
- 1% rule
- 1.05% ✓
- Cap rate
- 8.73%
- Cash-on-cash
- 8.70%
- DSCR
- 1.39
- GRM
- 7.9
CMA / ARV
- ARV (median comp)
- $163,162
- List price
- $190,000
- Delta
- 16.45%
- Verdict
- OVERPRICED
- Comps
- 2 within 1.0 mi
Show comp detail 3 sales within ~0.75 mi
| Address | Dist | Beds/Ba | Sqft | Sold | Price | $/sf | Match |
|---|---|---|---|---|---|---|---|
| 818 82nd St E | 0.00mi | 3/2.0 | 1,182 (0%) | 11mo | $180,000 | $152 | 91 |
| 824 82nd Street Ct E #20 | 0.04mi | 3/2.0 | 1,080 (-9%) | 19mo | $101,000 | $94 | 68 |
| 1617 80th St E | 0.62mi | 3/2.0 | 1,188 (+0%) | 13mo | $412,000 | $347 | 60 |
Match score weights: distance 35% · size 25% · config 20% · recency 20%. Top-matched comps best support the ARV.
Projected returns pro-forma
-3.0% appreciation · 1.64% rent growth · sell at horizon
- IRR
- -4.6%
- Equity multiple
- 0.83×
- Total profit
- $-8,970
- Equity at exit
- $28,330
- IRR
- 3.5%
- Equity multiple
- 1.24×
- Total profit
- $12,872
- Equity at exit
- $16,428
Cash invested: $53,200 (down + closing). Projections, not guarantees.
Landlord ↔ Tenant lean methodology
- Overall (STATE)
- 28 Tenant-Leaning
- State Washington
- 28 Tenant-Leaning · D+8
- County
- — inherits STATE
- City
- — inherits STATE
ZIP-level market 98404
- Rents YoY
- 1.6%
- Active inventory
- 176
- Price-to-rent
- 7.9×
Monthly cashflow live
- Estimated rent
- $1,995 high interval (Pro) →
- Mortgage (P&I)
- −$996
- Tax from tax record
- −$115 /mo · $1,379/yr
- Insurance
- −$79
- HOA
- −$0
- Vacancy / Maint / Mgmt
- −$419
- Net cashflow
- $386
Break-even live
UW: 25.0% down · 7.5% · 30yr · 1.5% tax · 5.0% vac · 8.0% maint · 8.0% mgmt
Financing live
Cash to close
- Down payment
- $47,500
- Closing costs
- $5,700
- Reserves months
- —
- Total cash needed
- —
Loan-product check · same deal, 3 products live
Conventional
25% down · 7.5% · 30yr
- Down + closing
- —
- Monthly P&I
- —
- Monthly cashflow
- —
- DSCR
- —
- Eligible?
- —
Personal DTI + credit; lowest rate.
DSCR
20% down · 8.5% · 30yr
- Down + closing
- —
- Monthly P&I
- —
- Monthly cashflow
- —
- DSCR
- —
- Eligible?
- —
No personal income docs; deal must DSCR.
Hard money
10% down · 12.0% · 12mo
- Down + closing
- —
- Monthly P&I
- —
- Monthly cashflow
- —
- DSCR
- —
- Eligible?
- —
Short-term bridge; refi at stabilization.
Rent comps 28 comps
| Address | Beds | Baths | Sqft | Rent | $/sqft | DOM | Units | Dist |
|---|---|---|---|---|---|---|---|---|
| 908 76th Street Ct E Tacoma, WA | 2.0–3.0 | 2.0 | 1065 | $2,178 | $2.05 | 2d | 5 | 0.31mi |
| 1018 76 Street Ct E Apt C Tacoma, WA | 2.0 | 1.0 | 866 | $1,550 | $1.79 | 43d | 1 | 0.34mi |
| 913 75th St E Tacoma, WA | 2.0 | 1.0 | 832 | $1,525 | $1.83 | 12d | 1 | 0.45mi |
| 908 74th St E Unit VASU**908-B Tacoma, WA | 2.0 | 1.0 | 828 | $1,450 | $1.75 | 43d | 1 | 0.47mi |
| 7412 Golden Given Rd E Tacoma, WA | 2.0 | 1.0–1.5 | 730 | $1,588 | $2.17 | 4d | 1 | 0.48mi |
| 7305 8th Avenue Ct E Tacoma, WA | 2.0 | 1.0 | 828 | $1,495 | $1.81 | 4d | 2 | 0.54mi |
| 901 E 72nd St Tacoma, WA | 1.0–2.0 | 1.0–2.0 | 765 | $1,795 | $2.34 | 23d | 4 | 0.63mi |
| 8015 Pacific Ave Unit 20 Tacoma, WA | 2.0 | 1.5 | 1100 | $1,995 | $1.81 | 24d | 1 | 0.63mi |
| 150 S 84th St Unit B Tacoma, WA | 2.0 | 1.0 | 1000 | $1,700 | $1.70 | 2d | 1 | 0.64mi |
| 8445 Pacific Ave Tacoma, WA | 1.0–2.0 | 1.0–2.0 | 715 | $1,975 | $2.76 | 3d | 3 | 0.66mi |
| 7645 Pacific Ave Tacoma, WA | 2.0 | 1.0 | 932 | $1,650 | $1.77 | 7d | 2 | 0.67mi |
| 7823 Pacific Ave Tacoma, WA | 1.0–2.0 | 1.0 | 699 | $1,659 | $2.37 | 3d | 5 | 0.67mi |
| 7603 Pacific Ave Unit 301 Tacoma, WA | 2.0 | 1.0 | 880 | $1,250 | $1.42 | 24d | 1 | 0.70mi |
| 7637 Pacific Ave Tacoma, WA | 1.0–2.0 | 1.0–2.0 | 700 | $1,600 | $2.29 | 5d | 6 | 0.71mi |
| 7428 S Bell St Tacoma, WA | 1.0–2.0 | 1.0–1.5 | 736 | $1,795 | $2.44 | 24d | 3 | 0.74mi |
| 1817 80th St E Tacoma, WA | 3.0 | 2.0 | 1188 | $3,200 | $2.69 | 19d | 1 | 0.75mi |
| 8624 Pacific Ave S Apt 6 Tacoma, WA | 2.0 | 1.5 | 900 | $1,475 | $1.64 | 2d | 1 | 0.77mi |
| 7605 S C St Apt 7 Tacoma, WA | 2.0 | 1.0 | 800 | $1,445 | $1.81 | 7d | 1 | 0.79mi |
| 7425 S D St Unit 204 Tacoma, WA | 2.0 | 1.0 | 900 | $1,700 | $1.89 | 24d | 1 | 0.87mi |
| 1402 E 69th St Tacoma, WA | 2.0 | 2.0 | 1000 | $1,795 | $1.79 | 24d | 2 | 0.90mi |
| 10910 22nd Avenue Ct E Unit Jkt Tacoma, WA | 3.0 | 2.0 | 1452 | $2,200 | $1.52 | 24d | 1 | 0.98mi |
| 7015 S D St Tacoma, WA | 1.0–2.0 | 1.0–1.5 | 760 | $1,894 | $2.49 | 2d | 9 | 1.02mi |
| 1111 99th Street Ct E Tacoma, WA | 1.0–2.0 | 1.0 | 775 | $1,450 | $1.87 | 43d | 4 | 1.15mi |
| 137 99th Street Ct E Tacoma, WA | 3.0 | 2.0 | 1200 | $2,397 | $2.00 | 43d | 1 | 1.20mi |
| 2621 80th St E Tacoma, WA | 2.0 | 1.0 | 978 | $2,100 | $2.15 | 5d | 1 | 1.25mi |
| 834 S 72nd St Tacoma, WA | 4.0 | 1.5 | 1450 | $2,900 | $2.00 | 7d | 1 | 1.33mi |
| 605 98th St S Tacoma, WA | 3.0 | 1.5 | 1320 | $2,800 | $2.12 | 43d | 1 | 1.35mi |
| 319 104th St E Tacoma, WA | 3.0 | 1.0 | 990 | $2,285 | $2.31 | 4d | 1 | 1.44mi |
Listing history 23 events
-
2026-06-18days on market $190,000 Active 84 DOM
-
2026-06-17days on market $190,000 Active 83 DOM
-
2026-06-16days on market $190,000 Active 82 DOM
-
2026-06-15days on market $190,000 Active 81 DOM
-
2026-06-13days on market $190,000 Active 79 DOM
-
2026-06-13days on market $190,000 Active 78 DOM
-
2026-06-09days on market $190,000 Active 75 DOM
-
2026-06-08days on market $190,000 Active 74 DOM
-
2026-06-07days on market $190,000 Active 73 DOM
-
2026-06-04days on market $190,000 Active 70 DOM
-
2026-06-03days on market $190,000 Active 69 DOM
-
2026-06-02days on market $190,000 Active 68 DOM
-
2026-06-01days on market $190,000 Active 67 DOM
-
2026-05-31days on market $190,000 Active 66 DOM
-
2026-04-27price $190,000
-
2026-03-25$195,000 Active
-
2025-08-04soldstatus $180,000
-
2023-07-20soldstatus $107,500 Closed
-
2023-07-11status Pending
-
2023-06-09status Active
-
2023-06-02status Pending
-
2023-05-31price $114,500
-
2023-04-27$124,500 Active
ⓘ Source: listings_history table (triggers on properties + properties_extension) + one-shot
backfill from property_details.listing_events for pre-trigger history.
Tax reassessment forecast WA · Resets to sale price
- Current annual tax
- $1,379 · $115/mo
- Projected year-2 tax
- $1,862 · $155/mo
- Expected delta
- +$483/yr (+$40/mo · 35.1%)
ⓘ Screening estimate from a state-policy table — verify with the county assessor before closing.
Climate risk First Street
- Flood 1/10 Low FEMA zone X (unshaded) · 0% chance over 30 yrs
- Wildfire 1/10 Low
- Heat 3/10 Moderate 7 d/yr ≥87°F today · 13 d/yr by 30 yrs out
- Wind 1/10 Low
- Air quality 7/10 Severe 10 unhealthy d/yr today · 12 by 30 yrs out
Nearby sold comps map
Loading sold comps map…
Walkable amenities ~0.75 mi
Loading nearby amenities…
Taxation est. · year 1
- Rental income
- $23,939
- − Mortgage interest
- −$10,643
- − Property taxes
- −$1,379
- − Insurance
- −$950
- − Repairs & maintenance
- −$1,915
- − Management
- −$1,915
- − Depreciation
- −$5,527
- Taxable income
- $1,610
- Est. tax owed @ 24.0%
- −$386
- After-tax cash flow
- $4,240/yr
For passive investors: Depreciation is non-cash, so a rental often shows a tax loss while cash-flowing — sheltering income. Rental losses are passive: they offset passive income freely, and up to $25,000/yr can offset ordinary (W-2) income if you actively participate and your MAGI is under $100k (phasing out to $0 by $150k); unused losses carry forward. On sale, claimed depreciation is recaptured at up to 25%, and gains may owe capital-gains tax (a 1031 exchange can defer both). Figures are a year-1 estimate at your 24.0% rate — not tax advice; consult a CPA.
Schools (NCES district)
- District
- Franklin Pierce School District
- NCES district ID
- 5302940
- Math proficiency
- 35% ▬ 0.00%
- Reading proficiency
- 51% ▲ 2.00%
- Median HH income
- $49,240
- Composite
- 39.18/100
- National rank
- #8227
- State rank
- #197 of 291 in WA
Livability — Midland
- Score
- 72/100
- State rank
- #208
- US rank
- #5731
Category grades
Schools grade is shown separately in the Schools card above.
Census & demographics
- Census place
- Midland, WA
- County
- Pierce County · 788,257 people
- Metro
- Seattle-Tacoma-Bellevue, WA
- Population (ZIP)
- 35,961
- Household income
- $82,191
- Rent vs Own
- Severe rent burden
- 989.0
Population outlook (Pierce County) Hauer SSP2
- Today (2025)
- 956,648 people
- By 2030
- 1,010,862 · +5.7%
- By 2040
- 1,113,170 · +16.4%
- By 2050
- 1,206,524 · +26.1%
- By 2075
- 1,436,425 · +50.2%
- By 2100
- 1,563,654 · +63.5%
Race, ethnicity, and origin ACS 2023
- Neighborhood character
- Highly diverse neighborhood (Simpson 0.77)
- Race & ethnicity
- White 38% Hispanic / Latino 20% Asian 17% Two or more races 16% Black 11% Native American 3% Pacific Islander 1%
- Hispanic origin (detail)
- Mexican 16% Puerto Rican 1%
- Common ancestry
- Italian 3% Portuguese 2% Slovak 1%
- Foreign-born
- 20% · Canada, Vietnam, South Korea
- Languages at home
- 68% English-only · Spanish 13% Other Asian/Pacific 7% Vietnamese 4%
Political lean MEDSL · Pierce
- 2024 margin
- D (+10.8) · D 53.9% · R 43.1% · Other 3.0%
- 2008→2024 swing
- -1.4pp toward R · 2008: 12.2pp · 2024: 10.8pp
- All cycles
- 2024: D+10.8 2020: D+11.2 2016: D+7.5 2012: D+11.0 2008: D+12.2
Not yet ingested
- Civics
- —
Market trends
- HPI YoY
- ▼ -462.09%
- Current HPI
- 360.0843
- Rent YoY
- ▲ 1.64%
- Metro
- Seattle-Tacoma-Bellevue, WA
- State GDP YoY
- ▲ 4.65%
- F500 in state
- 22
Industry mix (Fortune 500 HQ in WA)
| Industry | F500 HQs | Revenue |
|---|---|---|
| Retail | 2 | $269B |
|
||
| Technology / Retail | 1 | $638B |
|
||
| Technology | 1 | $245B |
|
||
| Telecommunications | 1 | $38B |
|
||
| Food / Beverage | 1 | $36B |
|
||
| Automotive / Trucks | 1 | $34B |
|
||
Price history
+52.6% since first listed9 events — show timeline
- 2026-04-27 Price Changed $190,000 NWMLS as Distributed by MLS Grid
- 2026-03-25 Listed $195,000 NWMLS as Distributed by MLS Grid
- 2025-08-04 Sold (Public Records) $180,000 Public Records
- 2023-07-20 Sold (MLS) $107,500 NWMLS as Distributed by MLS Grid
- 2023-07-11 Pending — NWMLS as Distributed by MLS Grid
- 2023-06-09 Relisted — NWMLS as Distributed by MLS Grid
- 2023-06-02 Pending — NWMLS as Distributed by MLS Grid
- 2023-05-31 Price Changed $114,500 NWMLS as Distributed by MLS Grid
- 2023-04-27 Listed $124,500 NWMLS as Distributed by MLS Grid
Property tax history
+23.4%/yrLatest (2026): $1,379 · +7.2% YoY. Source: county tax records.
Cash-flow waterfall
monthlySold comps — $/sqft
last 12 mo · ≤1 miLoading sold comps…