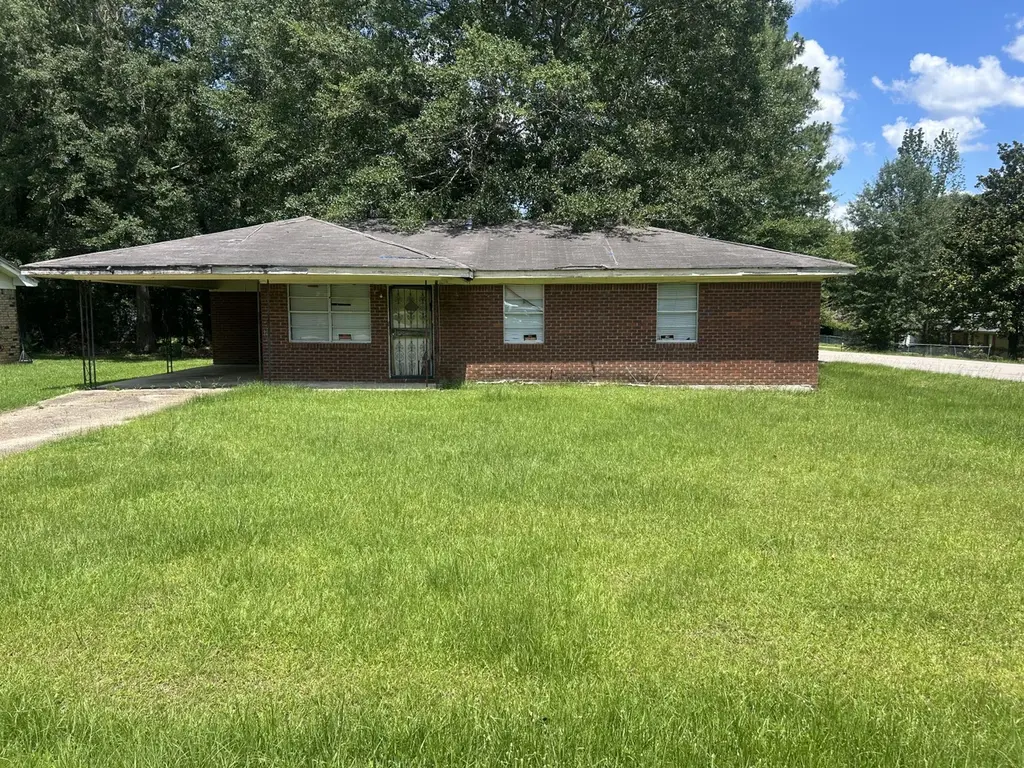
2 Magnolia St · Rawls Springs, MS
Flood risk 1/10 · Minimal
- FEMA flood zone
- X (unshaded)
- Chance of flooding over 30 yrs
- 0.0%
- Est. flood insurance / yr
- $507 – $1,088
Fire risk 4/10 · Minor
- Est. fire insurance / yr
- $1,241 – $2,305
Heat risk 8/10 · Major
- Hot days now (above 106°F)
- 7 days/yr
- Hot days in 30 yrs
- 20 days/yr
Wind risk 8/10 · Major
- Chance of severe wind over 30 yrs
- 99.0%
Air-quality risk 1/10 · Minimal
- Unhealthy air days now
- 0 days/yr
- Unhealthy air days in 30 yrs
- 0 days/yr
Risk factors via First Street. Map © Google.
Why this score? — see what drove the B- grade
The composite is a weighted blend of 9 inputs, each scored 0–100. Each bar is that input's sub-score; the figure is the points it added to the 100-point composite (weight × sub-score).
- Cash flow +30.0/30.0
- 1% rule +10.0/10.0
- DSCR +10.0/10.0
- ARV discount +7.5/15.0
- Livability +3.4/5.0
- Rent growth +3.3/5.0
- Schools +3.1/10.0
- Condition / age +2.5/5.0
- Appreciation +0.0/10.0
$40,000
🖨 Deal sheet 📄 Offer letter ✓ Due diligence
Listing remarks
Great for any investor. A fixer-upper with long-standing roots in need of a visionary's touch.
Key facts
- 9,750 sq ft lot
- Built 1971
- Listed 7 days
Property features AI
Exterior
- Parking: Attached carport; Carport; Driveway; No designated garage
- Utilities: Septic tank
- Home design: Single-family residence; One story
- Construction: Brick veneer exterior; Slab foundation
- Exterior features: Storage; Lot dimensions approximately 78 x 125; Zoned R
Interior
- Flooring: Wood flooring; Vinyl flooring
- Bathrooms: 1 full bathroom
- Heating & cooling: Window unit cooling
- Interior features: Storage; No built-in appliances listed
Neighborhood map
What this means for you Summary
Snapshot
- This is a 3-bed/1.0-bath single-family listed at $40k.
Deal economics
- At list price, monthly cash flow is $954 ($11k/yr) — positive.
- The deal already cash-flows at list — no discount required.
- Meets the 1% rule at list price ($2k rent vs $40k).
Location & tenants
- Location reads 68/100 on livability (#60 in MS) — a middle-class / working-renter tenant base. Strengths: crime A+, cost of living A+, housing A+; Watch: health & safety D, schools F, amenities F.
- Forrest County School District (rural): math 39% / reading 36% proficiency, ranked #47 of 130 in MS (top 36%) — families likely to look elsewhere, expect single-tenant / working-renter base with shorter leases; 67% free/reduced lunch — lower-income household profile, screen leases tightly.
- Market conditions: Rents rising (+3.4%/yr); 499 active listings in the ZIP; solid renter incomes; 121 units permitted in Forrest County in 2024 (30 in 5+ unit buildings).
Forward outlook
- Local home prices are declining (-3.0%/yr); year-one equity from $277 of loan paydown is wiped out by about $1k of value loss. Plan a longer hold.
- Forrest County population projected at +6% by 2050 — modest demand growth; plan on rents tracking national, not racing it.
- At projected returns (-3.0% appreciation + 3.4% rent growth), your $11k cash investment doubles in ~2 years — after that, you're playing with house money.
Negotiation context
- Only 8 days on market — expect competitive offers; lowballing is unlikely to land.
Risks & watch-outs
- Climate carrying-cost: severe wind risk, 99% chance of damaging wind over 30y; extreme-heat days projected 7→20/yr by 2055 (HVAC capex compounding) — expect insurance premiums to compound above CPI over the hold.
Questions for the listing agent
- Built in 1971 — when were the roof, HVAC, electrical panel, plumbing, and water heater last replaced?
- Is there a deadline driving the sale (1031 exchange, divorce, estate, relocation)? That informs how much negotiation room exists.
- Schools are F-rated, which usually means shorter tenancies and higher turnover. Who's the typical renter profile here, and what's been the actual vacancy rate?
- What's the average days-on-market for RENTAL listings here right now (not sales)? A rising rental-DOM trend means longer vacancies and softer asking-rent achievability than the comps imply.
- What's the recent tenant-quality profile in this submarket — average credit score on applications, eviction rate, late-payment / NSF rate, and stable-employment percentage? A property-management company in the area should have these aggregated.
- How much new for-sale + rental construction is in the pipeline within 1–3 miles? Heavy new supply typically softens prices + rents 12–24 months out; constrained supply supports both.
Investment metrics
- 1% rule
- 3.93% ✓
- Cap rate
- 34.90%
- Cash-on-cash
- 102.17%
- DSCR
- 5.55
- GRM
- 2.1
CMA / ARV
- ARV (on-the-fly)
- $138,880
- Comps found
- 2
Show comp detail 2 sales within ~0.75 mi
| Address | Dist | Beds/Ba | Sqft | Sold | Price | $/sf | Match |
|---|---|---|---|---|---|---|---|
| 4 Brantley Dr | 0.29mi | 3/1.0 | 1,160 (+4%) | 6mo | $89,900 | $78 | 75 |
| 601 Lakewood Loop | 0.63mi | 3/1.5 | 1,160 (+4%) | 11mo | $144,000 | $124 | 54 |
Match score weights: distance 35% · size 25% · config 20% · recency 20%. Top-matched comps best support the ARV.
Projected returns pro-forma
-3.0% appreciation · 3.37% rent growth · sell at horizon
- IRR
- —
- Equity multiple
- 5.90×
- Total profit
- $54,873
- Equity at exit
- $5,964
- IRR
- —
- Equity multiple
- 12.48×
- Total profit
- $128,549
- Equity at exit
- $3,458
Cash invested: $11,200 (down + closing). Projections, not guarantees.
Landlord ↔ Tenant lean methodology
- Overall (STATE)
- 90 Strongly Landlord-Friendly
- State Mississippi
- 90 Strongly Landlord-Friendly · R+11
- County
- — inherits STATE
- City
- — inherits STATE
ZIP-level market 39402
- Rents YoY
- 3.4%
- Active inventory
- 499
- Price-to-rent
- 2.1×
Monthly cashflow live
- Estimated rent
- $1,574 medium interval (Pro) →
- Mortgage (P&I)
- −$210
- Tax from tax record
- −$63 /mo · $757/yr
- Insurance
- −$17
- HOA
- −$0
- Vacancy / Maint / Mgmt
- −$330
- Net cashflow
- $954
Break-even live
UW: 25.0% down · 7.5% · 30yr · 1.5% tax · 5.0% vac · 8.0% maint · 8.0% mgmt
Financing live
Cash to close
- Down payment
- $10,000
- Closing costs
- $1,200
- Reserves months
- —
- Total cash needed
- —
Loan-product check · same deal, 3 products live
Conventional
25% down · 7.5% · 30yr
- Down + closing
- —
- Monthly P&I
- —
- Monthly cashflow
- —
- DSCR
- —
- Eligible?
- —
Personal DTI + credit; lowest rate.
DSCR
20% down · 8.5% · 30yr
- Down + closing
- —
- Monthly P&I
- —
- Monthly cashflow
- —
- DSCR
- —
- Eligible?
- —
No personal income docs; deal must DSCR.
Hard money
10% down · 12.0% · 12mo
- Down + closing
- —
- Monthly P&I
- —
- Monthly cashflow
- —
- DSCR
- —
- Eligible?
- —
Short-term bridge; refi at stabilization.
Listing history 8 events
-
2026-06-19days on market $40,000 Active 8 DOM
-
2026-06-18days on market $40,000 Active 7 DOM
-
2026-06-17days on market $40,000 Active 6 DOM
-
2026-06-16days on market $40,000 Active 5 DOM
-
2026-06-15days on market $40,000 Active 4 DOM
-
2026-06-14days on market $40,000 Active 2 DOM
-
2026-06-13remarks 94-char remark
-
2026-06-13$40,000 Active 1 DOM
ⓘ Source: listings_history table (triggers on properties + properties_extension) + one-shot
backfill from property_details.listing_events for pre-trigger history.
Tax reassessment forecast MS · Resets to sale price
- Current annual tax
- $757 · $63/mo
- Projected year-2 tax
- $757 · $63/mo
- Expected delta
- $0/yr ($0/mo · 0.0%)
ⓘ Screening estimate from a state-policy table — verify with the county assessor before closing.
Climate risk First Street
- Flood 1/10 Low FEMA zone X (unshaded) · 0% chance over 30 yrs
- Wildfire 4/10 Moderate
- Heat 8/10 Severe 7 d/yr ≥106°F today · 20 d/yr by 30 yrs out
- Wind 8/10 Severe 99% chance of damaging wind over 30 yrs
- Air quality 1/10 Low 0 unhealthy d/yr today · 0 by 30 yrs out
Nearby sold comps map
Loading sold comps map…
Walkable amenities ~0.75 mi
Loading nearby amenities…
Taxation est. · year 1
- Rental income
- $18,883
- − Mortgage interest
- −$2,241
- − Property taxes
- −$757
- − Insurance
- −$200
- − Repairs & maintenance
- −$1,511
- − Management
- −$1,511
- − Depreciation
- −$1,164
- Taxable income
- $11,500
- Est. tax owed @ 24.0%
- −$2,760
- After-tax cash flow
- $8,683/yr
For passive investors: Depreciation is non-cash, so a rental often shows a tax loss while cash-flowing — sheltering income. Rental losses are passive: they offset passive income freely, and up to $25,000/yr can offset ordinary (W-2) income if you actively participate and your MAGI is under $100k (phasing out to $0 by $150k); unused losses carry forward. On sale, claimed depreciation is recaptured at up to 25%, and gains may owe capital-gains tax (a 1031 exchange can defer both). Figures are a year-1 estimate at your 24.0% rate — not tax advice; consult a CPA.
Schools (NCES district)
- District
- Forrest County School District
- NCES district ID
- 2801490
- Math proficiency
- 39% ▼ -7.00%
- Reading proficiency
- 36% ▼ -6.00%
- Median HH income
- $39,597
- Composite
- 31.45/100
- National rank
- #5980
- State rank
- #47 of 130 in MS
Livability — Rawls Springs
- Score
- 68/100
- State rank
- #60
- US rank
- #9378
Category grades
Schools grade is shown separately in the Schools card above.
Census & demographics
- Census place
- Rawls Springs, MS
- County
- Lamar County · 44,620 people
- Metro
- Hattiesburg, MS
- Population (ZIP)
- 44,620
- Household income
- $75,220
- Rent vs Own
- Severe rent burden
- 864.0
Population outlook (Forrest County) Hauer SSP2
- Today (2025)
- 79,264 people
- By 2030
- 80,822 · +2.0%
- By 2040
- 82,979 · +4.7%
- By 2050
- 84,324 · +6.4%
- By 2075
- 84,942 · +7.2%
- By 2100
- 80,616 · +1.7%
Race, ethnicity, and origin ACS 2023
- Neighborhood character
- Diverse neighborhood (Simpson 0.56)
- Race & ethnicity
- White 59% Black 30% Hispanic / Latino 7% Two or more races 5% Asian 1%
- Hispanic origin (detail)
- Mexican 3% Puerto Rican 1%
- Common ancestry
- Serbian 4% Slovak 3% Lithuanian 3%
- Foreign-born
- 4% · Canada
- Languages at home
- 94% English-only · Spanish 4%
Political lean MEDSL · Forrest
- 2024 margin
- R (+17.9) · D 40.3% · R 58.2% · Other 1.4%
- 2008→2024 swing
- -4.4pp toward R · 2008: -13.5pp · 2024: -17.9pp
- All cycles
- 2024: R+17.9 2020: R+11.1 2016: R+14.2 2012: R+11.7 2008: R+13.5
Not yet ingested
- Civics
- —
Market trends
- HPI YoY
- ▼ -130.41%
- Current HPI
- 163.5142
- Rent YoY
- ▲ 3.37%
- Metro
- Hattiesburg, MS
- State GDP YoY
- —
- F500 in state
- 0
Price history
1 event — show timeline
- 2026-06-11 Listed $40,000 HAAR
Property tax history
-0.8%/yrLatest (2025): $757 · -11.7% YoY. Source: county tax records.
Cash-flow waterfall
monthlySold comps — $/sqft
last 12 mo · ≤1 miLoading sold comps…