771 E Hartford St Unit 3B · Citrus Hills, FL
Flood risk 1/10 · Minimal
- FEMA flood zone
- X (unshaded)
- Chance of flooding over 30 yrs
- 0.0%
- Est. flood insurance / yr
- $507 – $1,088
Fire risk 4/10 · Minor
- Est. fire insurance / yr
- $947 – $1,759
Heat risk 9/10 · Severe
- Hot days now (above 108°F)
- 7 days/yr
- Hot days in 30 yrs
- 24 days/yr
Wind risk 9/10 · Severe
- Chance of severe wind over 30 yrs
- 99.0%
Air-quality risk 1/10 · Minimal
- Unhealthy air days now
- 0 days/yr
- Unhealthy air days in 30 yrs
- 0 days/yr
Risk factors via First Street. Map © Google.
Why this score? — see what drove the D- grade
The composite is a weighted blend of 9 inputs, each scored 0–100. Each bar is that input's sub-score; the figure is the points it added to the 100-point composite (weight × sub-score).
- Cash flow +11.1/30.0
- ARV discount +7.5/15.0
- 1% rule +6.1/10.0
- Schools +4.1/10.0
- DSCR +3.2/10.0
- Livability +3.2/5.0
- Rent growth +2.5/5.0
- Condition / age +2.2/5.0
- Appreciation +0.0/10.0
$165,000
🖨 Deal sheet 📄 Offer letter ✓ Due diligence
Listing remarks
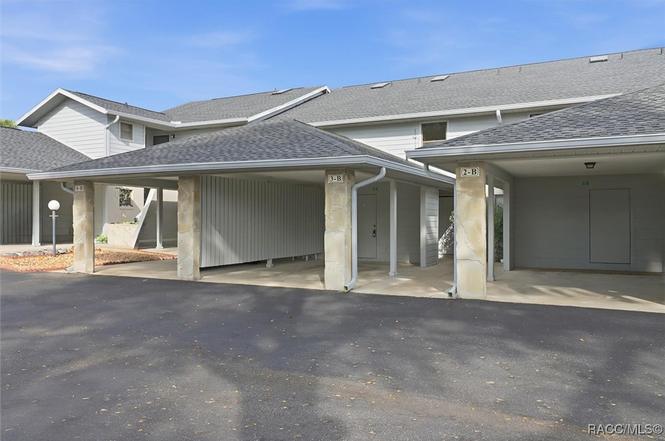
? 2-Story Townhome in Greenbriar Two – Steps from the Pool & Packed With Amenities! ? PEACE OF MIND for the buyer, Agent is offering the American Home Shield for 1 year for Condo, Townhomes for the buyer. Welcome home to this delightful two-story townhome in the sought-after Greenbriar Two community, perfectly positioned just a short stroll from the sparkling community pool. Whether you’re looking for convenience, comfort, or a lifestyle full of activities and relaxation, this property checks every box — and then some! Located within Citrus Hills with an included Social Membership, you’ll enjoy access to the incredible Terra Vista amenities, from world-class
Key facts
- Cozy enclosed lanai
- Flexible layout
- Indoor outdoor pools
Tags
Property features AI
Finance
- HOA & community: Homeowners association with monthly fee of $375; HOA covers insurance, grounds maintenance, structure maintenance, pest control, sewer, and trash
Exterior
- Parking: Attached carport; Paved driveway; One total parking space
- Security: Smoke detector(s)
- Utilities: Public water; Shared septic
- Home design: Townhouse condominium; Residential property
- Construction: Stucco construction; Block foundation; Asphalt shingle roof; Built as townhouse
- Exterior features: Community pool; Cleared, level lot; Paved road access
Interior
- Kitchen: Dishwasher; Electric oven; Electric range; Microwave; Refrigerator; Range hood; Disposal
- Flooring: Carpet; Tile
- Bathrooms: Two full bathrooms and one half bathroom
- Heating & cooling: Heat pump heating; Central air conditioning
- Interior features: Smoke detectors; Disposal; Range hood; Water heater
- Laundry & utility: Washer and dryer included
Neighborhood map
What this means for you Summary
Snapshot
- This is a 2-bed/2.5-bath condo listed at $165k. Condition is rated fair.
Deal economics
- At list price, monthly cash flow is $-68 ($-811/yr) — negative.
- To cash-flow at today's rent, offer at most $155k (5.9% below list).
- Meets the 1% rule at list price ($2k rent vs $165k).
- Recommended offer: $145k (12.0% below list) — sets the bar for market timing.
- Cap rate 5.8% vs local median 2.9% in Citrus Hills — top-decile yield for the area; either an underpriced asset or a hidden risk that comps aren't pricing in. Stress-test before assuming the spread holds.
Location & tenants
- Location reads 63/100 on livability (#744 in FL) — a middle-class / working-renter tenant base. Strengths: crime A+, housing A+; Watch: health & safety C-, amenities F, commute F.
- Citrus (rural): math 49% / reading 50% proficiency, ranked #44 of 73 in FL (top 60%) — families likely to look elsewhere, expect single-tenant / working-renter base with shorter leases.
- Zoned schools: Forest Ridge Elementary School (math 55% / reading 59%, grade C+, #781 of 2,144 statewide, top 38%, 708 students, 67% FRL); Lecanto Middle School (math 49% / reading 49%, grade C-, #265 of 571 statewide, top 48%, 809 students, 55% FRL); Lecanto High School (math 46% / reading 53%, grade D, #179 of 667 statewide, top 29%, 1,630 students, 46% FRL) — zoned schools at 56% FRL track the district average.
- Market conditions: 444 active listings in the ZIP; 6 comparable units currently listed for rent nearby; rentals at typical pace (median 21d on market — plan ~3-4 weeks tenant-placement turnaround); 2,443 units permitted in Citrus County in 2024 (0 in 5+ unit buildings).
- This rent runs 38% of the median local income ($57k/yr) — at the standard rent-burdened threshold; future hikes will face affordability resistance.
Forward outlook
- Local home prices are declining (-3.0%/yr); year-one equity from $1k of loan paydown is wiped out by about $5k of value loss. Plan a longer hold.
- Citrus County population projected to shrink 10% by 2050 — rents likely to lag national; underwrite the cash flow, not the appreciation.
Negotiation context
- It's been on market 198 days — a 12% lower offer ($145k) is reasonable based on typical stale-listing flexibility.
Risks & watch-outs
- Watch-outs: HOA is 20% of rent.
- Climate carrying-cost: severe wind risk, 99% chance of damaging wind over 30y; extreme-heat days projected 7→24/yr by 2055 (HVAC capex compounding) — expect insurance premiums to compound above CPI over the hold.
Questions for the listing agent
- What do current leases actually rent for vs. the listed asking? Can we see a recent rent roll and the last 12 months of T-12 income?
- It's been on market 198 days. Have you received any prior offers? Is the seller open to a 12% concession, seller financing, or rate buy-down credit?
- Have any recent inspections been done? Can we get a copy of the seller's disclosures and any deferred-maintenance estimates?
- What does the HOA fee cover, when was the last increase, and are there any pending special assessments or reserve-fund shortfalls?
- Any open or pending special assessments — roof, HVAC, plumbing, elevator, façade? What's the per-unit balance and payoff schedule, and is the seller paying it off at close or rolling it to the buyer?
- Why hasn't it sold? Are there any deal-killer items the seller is aware of (foundation, flood, title, zoning, code violations)?
- Is there a deadline driving the sale (1031 exchange, divorce, estate, relocation)? That informs how much negotiation room exists.
- Schools are D-rated, which usually means shorter tenancies and higher turnover. Who's the typical renter profile here, and what's been the actual vacancy rate?
- The area grade is low — what's the realistic commute time and amenity access for the typical tenant pool here? Any planned neighborhood developments (good or bad) we should know about?
- What's the average days-on-market for RENTAL listings here right now (not sales)? A rising rental-DOM trend means longer vacancies and softer asking-rent achievability than the comps imply.
- What's the recent tenant-quality profile in this submarket — average credit score on applications, eviction rate, late-payment / NSF rate, and stable-employment percentage? A property-management company in the area should have these aggregated.
- How much new apartment / multifamily construction is in the pipeline within 1–3 miles? Heavy new supply (>2% of stock underway) typically softens rents 12–24 months out; light construction supports rent growth.
Investment metrics
- 1% rule
- 1.11% ✓
- Cap rate
- 5.80%
- Cash-on-cash
- -1.76%
- DSCR
- 0.92
- GRM
- 7.5
CMA / ARV
No comps found within radius.
Projected returns pro-forma
-3.0% appreciation · 3.0% rent growth · sell at horizon
- IRR
- -19.0%
- Equity multiple
- 0.33×
- Total profit
- $-30,784
- Equity at exit
- $24,602
- IRR
- -11.2%
- Equity multiple
- 0.32×
- Total profit
- $-31,300
- Equity at exit
- $14,266
Cash invested: $46,200 (down + closing). Projections, not guarantees.
Landlord ↔ Tenant lean methodology
- Overall (STATE)
- 87 Strongly Landlord-Friendly
- State Florida
- 87 Strongly Landlord-Friendly · R+3
- County
- — inherits STATE
- City
- — inherits STATE
ZIP-level market 34442
- Home prices YoY
- -21.9%
- Active inventory
- 444
- Price-to-rent
- 7.5×
Monthly cashflow live
- Estimated rent
- $1,833 high interval (Pro) →
- Mortgage (P&I)
- −$865
- Tax est. 1.5%
- −$206 /mo · $2,475/yr
- Insurance
- −$69
- HOA
- −$375
- Vacancy / Maint / Mgmt
- −$385
- Net cashflow
- $-68
Break-even live
UW: 25.0% down · 7.5% · 30yr · 1.5% tax · 5.0% vac · 8.0% maint · 8.0% mgmt
Financing live
Cash to close
- Down payment
- $41,250
- Closing costs
- $4,950
- Reserves months
- —
- Total cash needed
- —
Loan-product check · same deal, 3 products live
Conventional
25% down · 7.5% · 30yr
- Down + closing
- —
- Monthly P&I
- —
- Monthly cashflow
- —
- DSCR
- —
- Eligible?
- —
Personal DTI + credit; lowest rate.
DSCR
20% down · 8.5% · 30yr
- Down + closing
- —
- Monthly P&I
- —
- Monthly cashflow
- —
- DSCR
- —
- Eligible?
- —
No personal income docs; deal must DSCR.
Hard money
10% down · 12.0% · 12mo
- Down + closing
- —
- Monthly P&I
- —
- Monthly cashflow
- —
- DSCR
- —
- Eligible?
- —
Short-term bridge; refi at stabilization.
Rent comps 6 comps
| Address | Beds | Baths | Sqft | Rent | $/sqft | DOM | Units | Dist |
|---|---|---|---|---|---|---|---|---|
| 790 E Gilchrist Ct Unit 2B Hernando, FL | 2.0 | 2.5 | 1320 | $2,000 | $1.52 | 20d | 1 | 0.02mi |
| 791 E Hartford St Unit 5 A Hernando, FL | 2.0 | 2.0 | 990 | $1,650 | $1.67 | 20d | 1 | 0.05mi |
| 741 E Hartford St Unit 1A Hernando, FL | 2.0 | 2.0 | 990 | $1,800 | $1.82 | 20d | 1 | 0.08mi |
| 1471 E Saint James Loop Inverness, FL | 3.0 | 2.0 | 1228 | $1,700 | $1.38 | 20d | 1 | 0.65mi |
| 2280 N Hardee Pt Hernando, FL | 2.0 | 2.0 | 1118 | $1,700 | $1.52 | 20d | 1 | 0.82mi |
| 1559 N Killebrew Pt Unit NA Hernando, FL | 3.0 | 2.0 | 1771 | $2,900 | $1.64 | 20d | 1 | 1.21mi |
HOA detail condo
- Monthly dues
- $375 · $4,500/yr
- Likely covers
- pool
- Assessments
- None detected in remarks — confirm with the listing agent.
Listing history 16 events
-
2026-06-19days on market $165,000 Active 198 DOM
-
2026-06-18days on market $165,000 Active 197 DOM
-
2026-06-17days on market $165,000 Active 196 DOM
-
2026-06-16days on market $165,000 Active 195 DOM
-
2026-06-15days on market $165,000 Active 194 DOM
-
2026-06-14days on market $165,000 Active 192 DOM
-
2026-06-13days on market $165,000 Active 191 DOM
-
2026-06-09days on market $165,000 Active 188 DOM
-
2026-06-08days on market $165,000 Active 187 DOM
-
2026-06-03days on market $165,000 Active 182 DOM
-
2026-06-02days on market $165,000 Active 181 DOM
-
2026-06-01days on market $165,000 Active 180 DOM
-
2026-05-31days on market $165,000 Active 179 DOM
-
2026-05-30days on market $165,000 Active 178 DOM
-
2026-05-04price $165,000
-
2025-12-01$179,000 Active
ⓘ Source: listings_history table (triggers on properties + properties_extension) + one-shot
backfill from property_details.listing_events for pre-trigger history.
Climate risk First Street
- Flood 1/10 Low FEMA zone X (unshaded) · 0% chance over 30 yrs
- Wildfire 4/10 Moderate
- Heat 9/10 Extreme 7 d/yr ≥108°F today · 24 d/yr by 30 yrs out
- Wind 9/10 Extreme 99% chance of damaging wind over 30 yrs
- Air quality 1/10 Low 0 unhealthy d/yr today · 0 by 30 yrs out
Nearby sold comps map
Loading sold comps map…
Walkable amenities ~0.75 mi
Loading nearby amenities…
Taxation est. · year 1
- Rental income
- $21,990
- − Mortgage interest
- −$9,243
- − Property taxes
- −$2,475
- − Insurance
- −$825
- − Repairs & maintenance
- −$1,759
- − Management
- −$1,759
- − HOA
- −$4,500
- − Depreciation
- −$4,800
- Taxable loss
- −$3,371
- Est. tax savings @ 24.0%
- +$809
- After-tax cash flow
- $-2/yr
For passive investors: Depreciation is non-cash, so a rental often shows a tax loss while cash-flowing — sheltering income. Rental losses are passive: they offset passive income freely, and up to $25,000/yr can offset ordinary (W-2) income if you actively participate and your MAGI is under $100k (phasing out to $0 by $150k); unused losses carry forward. On sale, claimed depreciation is recaptured at up to 25%, and gains may owe capital-gains tax (a 1031 exchange can defer both). Figures are a year-1 estimate at your 24.0% rate — not tax advice; consult a CPA.
Condition & rehab AI · 13 photos
This two-story townhome in Greenbriar Two is in fair condition with some minor repairs and maintenance needed. It has a good roof and foundation, but the exterior and interior could benefit from some touch-ups and cleaning. Adding fresh paint and landscaping would significantly enhance its resale and rental value.
Repairs flagged
- Minor Paint touch-ups — There are some minor scuffs and marks visible on the interior walls
- Minor Deep cleaning of tile flooring — The tile flooring in the kitchen and living area appears clean but may benefit from a deep cleaning
- Minor Landscaping enhancement — The landscaping is minimal and could benefit from some additional greenery
Value-add opportunities
- Resale Paint touch-ups — Fresh paint can make a significant difference in the home's appearance and appeal to potential buyers
- Resale Deep cleaning of tile flooring — A clean and well-maintained floor can enhance the home's overall appeal and make it more attractive to potential buyers
- Both Landscaping enhancement — Adding more greenery and landscaping can improve the home's curb appeal and increase its rental value
Renovation cost estimate screening
| Repair item | Severity | Est. cost |
|---|---|---|
| Paint touch-ups · There are some minor scuffs and marks visible on the interior walls | Minor | $500–3,000 |
| Deep cleaning of tile flooring · The tile flooring in the kitchen and living area appears clean but may benefit from a deep cleaning | Minor | $500–3,000 |
| Landscaping enhancement · The landscaping is minimal and could benefit from some additional greenery | Minor | $500–3,000 |
| Total estimated repair cost · 3 items | $1,500–9,000 |
Value-add ROI direction
- Resale Paint touch-ups — Fresh paint can make a significant difference in the home's appearance and appeal to potential buyers ↑
- Resale Deep cleaning of tile flooring — A clean and well-maintained floor can enhance the home's overall appeal and make it more attractive to potential buyers ↑
- Both Landscaping enhancement — Adding more greenery and landscaping can improve the home's curb appeal and increase its rental value ↑
ⓘ Cost ranges are severity-bucket heuristics (US national rule-of-thumb). Get contractor quotes + a written scope before underwriting a rehab budget.
Schools (NCES district)
- District
- Citrus
- NCES district ID
- 1200270
- Math proficiency
- 49% ▼ -10.00%
- Reading proficiency
- 50% ▼ -6.00%
- Median HH income
- $38,618
- Composite
- 41.28/100
- National rank
- #3519
- State rank
- #44 of 73 in FL
Livability — Citrus Hills
- Score
- 63/100
- State rank
- #744
- US rank
- #16030
Category grades
Schools grade is shown separately in the Schools card above.
Census & demographics
- Census place
- Citrus Hills, FL
- County
- Citrus County · 111,314 people
- Metro
- Homosassa Springs, FL
- Population (ZIP)
- 17,281
- Household income
- $57,259
- Rent vs Own
- Severe rent burden
- 314.0
Population outlook (Citrus County) Hauer SSP2
- Today (2025)
- 138,622 people
- By 2030
- 136,886 · -1.3%
- By 2040
- 132,009 · -4.8%
- By 2050
- 125,196 · -9.7%
- By 2075
- 108,570 · -21.7%
- By 2100
- 84,454 · -39.1%
Race, ethnicity, and origin ACS 2023
- Neighborhood character
- Predominantly White (90%)
- Race & ethnicity
- White 90% Hispanic / Latino 4% Two or more races 3% Asian 2% Black 2%
- Common ancestry
- Romanian 4% Slovak 4% Lithuanian 3%
- Foreign-born
- 8% · Canada, China, South Korea
- Languages at home
- 93% English-only · Spanish 3% German/W. Germanic 2% Tagalog/Filipino 1%
Political lean MEDSL · Citrus
- 2024 margin
- Solid R (+45.9) · D 26.8% · R 72.6%
- 2008→2024 swing
- -29.8pp toward R · 2008: -16.1pp · 2024: -45.9pp
- All cycles
- 2024: R+45.9 2020: R+41.0 2016: R+39.7 2012: R+21.9 2008: R+16.1
Not yet ingested
- Civics
- —
Market trends
- HPI YoY
- ▼ -76.70%
- Current HPI
- 273.3262
- Rent YoY
- —
- Metro
- Homosassa Springs, FL
- State GDP YoY
- ▲ 3.28%
- F500 in state
- 36
Industry mix (Fortune 500 HQ in FL)
| Industry | F500 HQs | Revenue |
|---|---|---|
| Industrial Technology | 2 | $29B |
|
||
| Insurance | 2 | $17B |
|
||
| Retail | 1 | $60B |
|
||
| Technology Distribution | 1 | $58B |
|
||
| Homebuilding | 1 | $35B |
|
||
| Technology Manufacturing | 1 | $35B |
|
||
Price history
-7.8% since first listed2 events — show timeline
- 2026-05-04 Price Changed $165,000 RACC
- 2025-12-01 Listed $179,000 RACC
Cash-flow waterfall
monthlySold comps — $/sqft
last 12 mo · ≤1 miLoading sold comps…