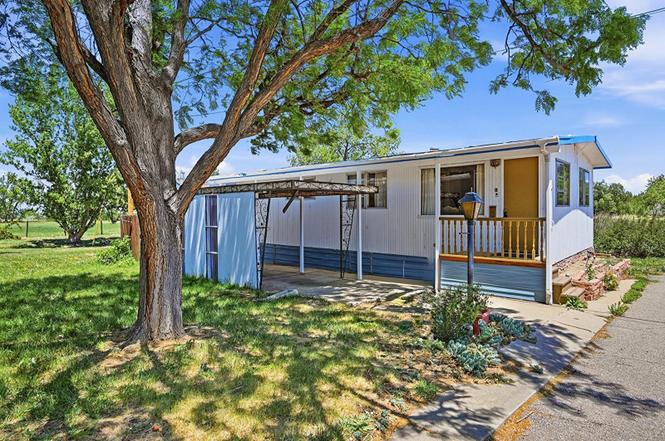
1720 S Marshall Rd · Boulder, CO
Flood risk 3/10 · Minor
- FEMA flood zone
- X (unshaded)
- Chance of flooding over 30 yrs
- 0.2%
- Est. flood insurance / yr
- $507 – $1,088
Fire risk 8/10 · Major
- Est. fire insurance / yr
- $939 – $1,743
Heat risk 3/10 · Minor
- Hot days now (above 90°F)
- 7 days/yr
- Hot days in 30 yrs
- 17 days/yr
Wind risk 1/10 · Minimal
- Chance of severe wind over 30 yrs
- —
Air-quality risk 4/10 · Minor
- Unhealthy air days now
- 4 days/yr
- Unhealthy air days in 30 yrs
- 5 days/yr
Risk factors via First Street. Map © Google.
Why this score? — see what drove the C- grade
The composite is a weighted blend of 9 inputs, each scored 0–100. Each bar is that input's sub-score; the figure is the points it added to the 100-point composite (weight × sub-score).
- Cash flow +14.4/30.0
- 1% rule +10.0/10.0
- ARV discount +7.5/15.0
- Schools +5.1/10.0
- DSCR +4.4/10.0
- Livability +3.9/5.0
- Rent growth +3.8/5.0
- Condition / age +2.5/5.0
- Appreciation +0.0/10.0
$150,000
🖨 Deal sheet 📄 Offer letter ✓ Due diligence
Listing remarks
Experience the ultimate private getaway in this 2-bedroom, 1-bathroom gem! Nestled in a quiet pocket of Boulder, this home feels like a hidden mountain hideaway where the Flatirons are your only neighbors. It’s a rare chance to enjoy total tranquility without sacrificing city convenience. Step inside to a bright and inviting interior filled with natural light from multiple windows throughout. The open living area features warm wood flooring and a comfortable layout that flows easily into the kitchen. The kitchen offers white cabinetry, ample counter space, stainless steel appliances including the gas stove are all included, and a functional design ideal for everyday living. The home i
Key facts
- Beautiful views
- Oversized workshop
- Two spacious sheds
Tags
Property features AI
Finance
- Financial info: Land lease in place ($1,097 monthly; expires March 31, 2026)
- HOA & community: Association: Table Mesa Village (professionally managed); Association fee frequency: None; Pets not allowed
Exterior
- Parking: 2 parking spaces; 2 carport spaces
- Utilities: Public sewer
- Home design: Manufactured in-park mobile home; Single-story; Individual ownership
- Construction: Wood siding construction; Mobile home (55 ft by 10 ft)
- Exterior features: Metal roof; Located in a mobile home park (Table Mesa Village)
Interior
- Kitchen: Includes oven, range and refrigerator
- Bedrooms: 2 bedrooms on the main level (one is a primary suite)
- Bathrooms: 1 full bathroom on the main level (en suite to the primary bedroom)
- Heating & cooling: Radiant floor heating
- Interior features: Oven, Range, Refrigerator
Neighborhood map
What this means for you Summary
Snapshot
- This is a 3-bed/2.0-bath manufactured listed at $150k.
Deal economics
- At list price, monthly cash flow is $29 ($347/yr) — positive.
- The deal already cash-flows at list — no discount required.
- Meets the 1% rule at list price ($3k rent vs $150k).
- Cap rate 6.5% vs local median 1.7% in Boulder — top-decile yield for the area; either an underpriced asset or a hidden risk that comps aren't pricing in. Stress-test before assuming the spread holds.
Location & tenants
- Location reads 77/100 on livability (#24 in CO, #2,958 nationally) — a middle-class / working-renter tenant base. Strengths: amenities A+, commute A+, health & safety A+; Watch: crime D+, cost of living F.
- Boulder Valley School District No. Re2 (urban): math 49% / reading 67% proficiency, ranked #6 of 86 in CO (top 7%) — acceptable for families but not a draw, mixed tenant base, ~2y average lease; only 16% free/reduced lunch — higher-income household profile.
- Zoned schools: Mesa Elementary School (math 54% / reading 77%, grade B+, #61 of 966 statewide, top 6%, 246 students, 13% FRL); Southern Hills Middle School (math 58% / reading 82%, grade A, #6 of 270 statewide, top 2%, 456 students, 10% FRL); Fairview High School (math 79% / reading 91%, grade A, #1 of 381 statewide, top 0%, 1,880 students, 14% FRL) — zoned schools at 12% FRL track the district average.
- Zoned-school proficiency averages 74% at this address vs 58% district-wide (+16 pts) — the actual schools serving this property are materially stronger than the Boulder Valley School District No. Re2 average implies; a family-tenant draw the district grade alone would hide.
- Market conditions: Rents rising fast (+5.2%/yr); 60 active listings in the ZIP; 7 comparable units currently listed for rent nearby; rentals at typical pace (median 21d on market — plan ~3-4 weeks tenant-placement turnaround); high-income renter base; 1,688 units permitted in Boulder County in 2024 (1,136 in 5+ unit buildings).
Forward outlook
- Local home prices are declining (-3.0%/yr); year-one equity from $1k of loan paydown is wiped out by about $4k of value loss. Plan a longer hold.
- Boulder County population projected at +40% by 2050 — long-run rental-demand tailwind backs the buy-and-hold thesis.
Negotiation context
- Only 7 days on market — expect competitive offers; lowballing is unlikely to land.
- 9 sale attempts since 20y ago; this cycle's ask is 100% above the opening price — seller raised mid-cycle; expect resistance to lowballs.
Risks & watch-outs
- Watch-outs: HOA is 40% of rent.
- Climate carrying-cost: severe wildfire risk — expect insurance premiums to compound above CPI over the hold.
Questions for the listing agent
- Built in 1964 — when were the roof, HVAC, electrical panel, plumbing, and water heater last replaced?
- What does the HOA fee cover, when was the last increase, and are there any pending special assessments or reserve-fund shortfalls?
- Is there a deadline driving the sale (1031 exchange, divorce, estate, relocation)? That informs how much negotiation room exists.
- Schools are B-rated — typically a magnet for longer-tenancy family renters. What's the average tenant stay here, and is there a school-zone premium baked into asking?
- Crime grade is D in this area — have there been break-ins, vandalism, or insurance claims at this property in the last 3 years? What carrier currently insures it and at what premium?
- What's the average days-on-market for RENTAL listings here right now (not sales)? A rising rental-DOM trend means longer vacancies and softer asking-rent achievability than the comps imply.
- What's the recent tenant-quality profile in this submarket — average credit score on applications, eviction rate, late-payment / NSF rate, and stable-employment percentage? A property-management company in the area should have these aggregated.
- How much new for-sale + rental construction is in the pipeline within 1–3 miles? Heavy new supply typically softens prices + rents 12–24 months out; constrained supply supports both.
Investment metrics
- 1% rule
- 1.83% ✓
- Cap rate
- 6.52%
- Cash-on-cash
- 0.83%
- DSCR
- 1.04
- GRM
- 4.6
CMA / ARV
No comps found within radius.
Projected returns pro-forma
-3.0% appreciation · 5.21% rent growth · sell at horizon
- IRR
- -9.7%
- Equity multiple
- 0.63×
- Total profit
- $-15,518
- Equity at exit
- $22,365
- IRR
- 5.0%
- Equity multiple
- 1.44×
- Total profit
- $18,519
- Equity at exit
- $12,969
Cash invested: $42,000 (down + closing). Projections, not guarantees.
Landlord ↔ Tenant lean methodology
- Overall (STATE)
- 38 Tenant-Leaning
- State Colorado
- 38 Tenant-Leaning · D+4
- County
- — inherits STATE
- City
- — inherits STATE
ZIP-level market 80305
- Rents YoY
- 5.2%
- Active inventory
- 60
- Price-to-rent
- 4.6×
Monthly cashflow live
- Estimated rent
- $2,741 high interval (Pro) →
- Mortgage (P&I)
- −$787
- Tax est. 1.5%
- −$188 /mo · $2,250/yr
- Insurance
- −$62
- HOA
- −$1,100
- Vacancy / Maint / Mgmt
- −$576
- Net cashflow
- $29
Break-even live
UW: 25.0% down · 7.5% · 30yr · 1.5% tax · 5.0% vac · 8.0% maint · 8.0% mgmt
Financing live
Cash to close
- Down payment
- $37,500
- Closing costs
- $4,500
- Reserves months
- —
- Total cash needed
- —
Loan-product check · same deal, 3 products live
Conventional
25% down · 7.5% · 30yr
- Down + closing
- —
- Monthly P&I
- —
- Monthly cashflow
- —
- DSCR
- —
- Eligible?
- —
Personal DTI + credit; lowest rate.
DSCR
20% down · 8.5% · 30yr
- Down + closing
- —
- Monthly P&I
- —
- Monthly cashflow
- —
- DSCR
- —
- Eligible?
- —
No personal income docs; deal must DSCR.
Hard money
10% down · 12.0% · 12mo
- Down + closing
- —
- Monthly P&I
- —
- Monthly cashflow
- —
- DSCR
- —
- Eligible?
- —
Short-term bridge; refi at stabilization.
Rent comps 7 comps
| Address | Beds | Baths | Sqft | Rent | $/sqft | DOM | Units | Dist |
|---|---|---|---|---|---|---|---|---|
| 4977 Moorhead Ave Boulder, CO | 1.0–2.0 | 1.0 | 735 | $2,104 | $2.86 | 13d | 22 | 1.19mi |
| 680 S Lashley Ln Boulder, CO | 2.0 | 1.0–1.5 | 525 | $2,020 | $3.85 | 13d | 22 | 1.20mi |
| 4827 Thunderbird Dr Boulder, CO | 1.0–2.0 | 1.0 | 700 | $1,571 | $2.24 | 21d | 6 | 1.23mi |
| 640 S Lashley Ln Unit 640-102 Boulder, CO | 2.0 | 1.5 | 650 | $2,020 | $3.11 | 21d | 1 | 1.24mi |
| 4917 Thunderbird Dr Boulder, CO | 1.0–2.0 | 1.0 | 725 | $1,845 | $2.54 | 21d | 1 | 1.25mi |
| 3455 Table Mesa Dr Boulder, CO | 2.0 | 1.0–2.0 | 674 | $2,797 | $4.15 | 13d | 38 | 1.37mi |
| 4990 Osage Dr Boulder, CO | 1.0–2.0 | 1.0 | 735 | $1,855 | $2.52 | 21d | 1 | 1.39mi |
HOA detail
- Monthly dues
- $1,100 · $13,200/yr
- Likely covers
- gas
Listing history 47 events
-
2026-06-18days on market $150,000 Active 7 DOM
-
2026-06-17days on market $150,000 Active 6 DOM
-
2026-06-16days on market $150,000 Active 5 DOM
-
2026-06-15days on market $150,000 Active 4 DOM
-
2026-06-14days on market $150,000 Active 2 DOM
-
2026-06-13pricedays on market $150,000 Active 1 DOM
-
2026-06-10days on market $73,000 Active 117 DOM
-
2026-06-09days on market $73,000 Active 116 DOM
-
2026-06-09days on market $73,000 Active 115 DOM
-
2026-06-07days on market $73,000 Active 114 DOM
-
2026-06-05days on market $73,000 Active 111 DOM
-
2026-06-03days on market $73,000 Active 110 DOM
-
2026-06-02days on market $73,000 Active 109 DOM
-
2026-06-01days on market $73,000 Active 108 DOM
-
2026-05-31days on market $73,000 Active 107 DOM
-
2026-05-30days on market $73,000 Active 106 DOM
-
2026-04-16price $73,000
-
2026-02-13$75,000 Active
-
2025-12-31historical
-
2025-08-28price $97,000
-
2025-06-25$100,000 Active
-
2025-06-23historical
-
2024-10-08historical
-
2024-07-18$159,950 Active
-
2024-07-17historical
-
2024-05-28status Pending
-
2024-05-28historical
-
2024-05-16$159,000 Active
-
2024-05-15historical
-
2023-08-22historical
-
2023-07-14soldstatus $169,000 Closed
-
2023-06-29status Pending Accepting Backup Offers
-
2023-06-22$169,000 Active
-
2023-06-15historical $169,000
-
2023-05-25$199,000 Active
-
2023-05-25historical
-
2022-07-02soldstatus $60,000 Closed
-
2022-06-23status Pending
-
2022-03-17price $65,000
-
2022-03-11$61,000 Active
-
2021-12-14soldstatus $55,000 Closed
-
2021-11-08status Pending
-
2021-08-31price $65,000
-
2021-08-05price $75,000
-
2021-07-29$80,000 Active
-
2006-08-01soldstatus $25,000
-
2006-07-23$27,500
ⓘ Source: listings_history table (triggers on properties + properties_extension) + one-shot
backfill from property_details.listing_events for pre-trigger history.
Climate risk First Street
- Flood 3/10 Moderate FEMA zone X (unshaded) · 20% chance over 30 yrs
- Wildfire 8/10 Severe
- Heat 3/10 Moderate 7 d/yr ≥90°F today · 17 d/yr by 30 yrs out
- Wind 1/10 Low
- Air quality 4/10 Moderate 4 unhealthy d/yr today · 5 by 30 yrs out
Nearby sold comps map
Loading sold comps map…
Walkable amenities ~0.75 mi
Loading nearby amenities…
Taxation est. · year 1
- Rental income
- $32,894
- − Mortgage interest
- −$8,402
- − Property taxes
- −$2,250
- − Insurance
- −$750
- − Repairs & maintenance
- −$2,632
- − Management
- −$2,632
- − HOA
- −$13,200
- − Depreciation
- −$4,364
- Taxable loss
- −$1,335
- Est. tax savings @ 24.0%
- +$320
- After-tax cash flow
- $667/yr
For passive investors: Depreciation is non-cash, so a rental often shows a tax loss while cash-flowing — sheltering income. Rental losses are passive: they offset passive income freely, and up to $25,000/yr can offset ordinary (W-2) income if you actively participate and your MAGI is under $100k (phasing out to $0 by $150k); unused losses carry forward. On sale, claimed depreciation is recaptured at up to 25%, and gains may owe capital-gains tax (a 1031 exchange can defer both). Figures are a year-1 estimate at your 24.0% rate — not tax advice; consult a CPA.
Schools (NCES district)
- District
- Boulder Valley School District No. Re2
- NCES district ID
- 0802490
- Math proficiency
- 49% ▼ -3.00%
- Reading proficiency
- 67% ▲ 4.00%
- Median HH income
- $70,395
- Composite
- 51.3/100
- National rank
- #1747
- State rank
- #6 of 86 in CO
Livability — Boulder
- Score
- 77/100
- State rank
- #24
- US rank
- #2958
Category grades
Schools grade is shown separately in the Schools card above.
Census & demographics
- County
- Boulder County · 271,666 people
- City population
- 121,246
- Metro
- Boulder, CO
- Population (ZIP)
- 16,291
- Household income
- $126,107
- Rent vs Own
- Severe rent burden
- 1048.0
Population outlook (Boulder County) Hauer SSP2
- Today (2025)
- 380,833 people
- By 2030
- 412,028 · +8.2%
- By 2040
- 472,764 · +24.1%
- By 2050
- 532,029 · +39.7%
- By 2075
- 679,723 · +78.5%
- By 2100
- 766,278 · +101.2%
Race, ethnicity, and origin ACS 2023
- Neighborhood character
- Predominantly White (82%)
- Race & ethnicity
- White 82% Two or more races 8% Hispanic / Latino 8% Asian 6%
- Hispanic origin (detail)
- Mexican 4%
- Common ancestry
- Italian 4% Romanian 4% Slovak 4%
- Foreign-born
- 9% · China, Canada, South Korea
- Languages at home
- 88% English-only · Spanish 3% Chinese 2% Other Indo-European 2%
Political lean MEDSL · Boulder
- 2024 margin
- Solid D (+55.8) · D 76.5% · R 20.8% · Other 2.7%
- 2008→2024 swing
- +9.6pp toward D · 2008: 46.1pp · 2024: 55.8pp
- All cycles
- 2024: D+55.8 2020: D+56.6 2016: D+48.6 2012: D+41.5 2008: D+46.1
Not yet ingested
- Civics
- —
Market trends
- HPI YoY
- ▼ -930.73%
- Current HPI
- 313.8746
- Rent YoY
- ▲ 5.21%
- Metro
- Boulder, CO
- State GDP YoY
- ▲ 1.95%
- F500 in state
- 14
Industry mix (Fortune 500 HQ in CO)
| Industry | F500 HQs | Revenue |
|---|---|---|
| Technology Distribution | 1 | $31B |
|
||
| Food / Agriculture | 1 | $18B |
|
||
| Packaging | 1 | $14B |
|
||
| Healthcare | 1 | $13B |
|
||
| Energy | 1 | $10B |
|
||
| Technology | 1 | $4B |
|
||
Price history
+165.5% since first listed31 events — show timeline
- 2026-04-16 Price Changed $73,000 REColorado as Distributed by MLS Grid
- 2026-02-13 Listed $75,000 REColorado as Distributed by MLS Grid
- 2025-12-31 Listing Removed — REColorado as Distributed by MLS Grid
- 2025-08-28 Price Changed $97,000 REColorado as Distributed by MLS Grid
- 2025-06-25 Listed $100,000 REColorado as Distributed by MLS Grid
- 2025-06-23 Coming Soon — REColorado as Distributed by MLS Grid
- 2024-10-08 Listing Removed — REColorado as Distributed by MLS Grid
- 2024-07-18 Listed $159,950 REColorado as Distributed by MLS Grid
- 2024-07-17 Coming Soon — REColorado as Distributed by MLS Grid
- 2024-05-28 Pending — REColorado as Distributed by MLS Grid
- 2024-05-28 Listing Removed — REColorado as Distributed by MLS Grid
- 2024-05-16 Listed $159,000 REColorado as Distributed by MLS Grid
- 2024-05-15 Coming Soon — REColorado as Distributed by MLS Grid
- 2023-08-22 Listing Removed — REColorado as Distributed by MLS Grid
- 2023-07-14 Sold (MLS) $169,000 REColorado as Distributed by MLS Grid
- 2023-06-29 Pending — REColorado as Distributed by MLS Grid
- 2023-06-22 Listed $169,000 REColorado as Distributed by MLS Grid
- 2023-06-15 Coming Soon $169,000 REColorado as Distributed by MLS Grid
- 2023-05-25 Listed $199,000 REColorado as Distributed by MLS Grid
- 2023-05-25 Coming Soon — REColorado as Distributed by MLS Grid
- 2022-07-02 Sold (MLS) $60,000 REColorado as Distributed by MLS Grid
- 2022-06-23 Pending — REColorado as Distributed by MLS Grid
- 2022-03-17 Price Changed $65,000 REColorado as Distributed by MLS Grid
- 2022-03-11 Listed $61,000 REColorado as Distributed by MLS Grid
- 2021-12-14 Sold (MLS) $55,000 REColorado as Distributed by MLS Grid
- 2021-11-08 Pending — REColorado as Distributed by MLS Grid
- 2021-08-31 Price Changed $65,000 REColorado as Distributed by MLS Grid
- 2021-08-05 Price Changed $75,000 REColorado as Distributed by MLS Grid
- 2021-07-29 Listed $80,000 REColorado as Distributed by MLS Grid
- 2006-08-01 Sold (MLS) $25,000 IRES
- 2006-07-23 Listed $27,500 IRES
Property tax history
+7.6%/yrLatest (2012): $74 · +5.7% YoY. Source: county tax records.
Cash-flow waterfall
monthlySold comps — $/sqft
last 12 mo · ≤1 miLoading sold comps…