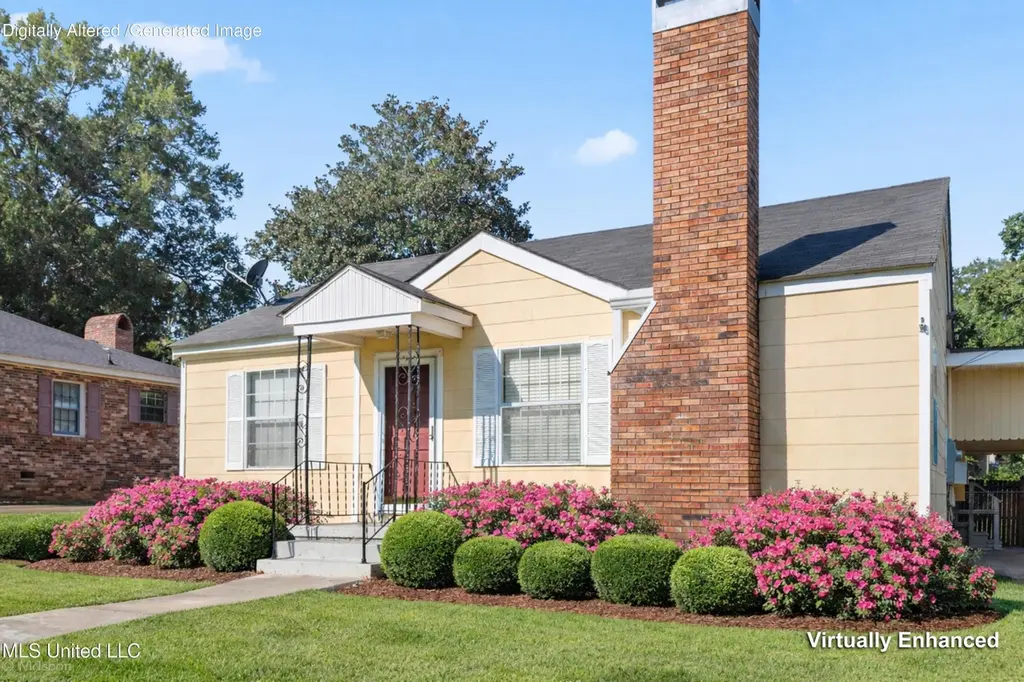
515 Lakeview Ave · McComb, MS
Flood risk 1/10 · Minimal
- FEMA flood zone
- X (unshaded)
- Chance of flooding over 30 yrs
- 0.0%
- Est. flood insurance / yr
- $507 – $1,088
Fire risk 4/10 · Minor
- Est. fire insurance / yr
- $1,241 – $2,305
Heat risk 8/10 · Major
- Hot days now (above 109°F)
- 7 days/yr
- Hot days in 30 yrs
- 21 days/yr
Wind risk 8/10 · Major
- Chance of severe wind over 30 yrs
- 99.0%
Air-quality risk 1/10 · Minimal
- Unhealthy air days now
- 0 days/yr
- Unhealthy air days in 30 yrs
- 0 days/yr
Risk factors via First Street. Map © Google.
Why this score? — see what drove the C grade
The composite is a weighted blend of 9 inputs, each scored 0–100. Each bar is that input's sub-score; the figure is the points it added to the 100-point composite (weight × sub-score).
- Cash flow +21.6/30.0
- ARV discount +15.0/15.0
- DSCR +6.9/10.0
- 1% rule +5.7/10.0
- Livability +3.5/5.0
- Rent growth +2.5/5.0
- Condition / age +2.5/5.0
- Schools +1.2/10.0
- Appreciation +0.0/10.0
$122,000
🖨 Deal sheet 📄 Offer letter ✓ Due diligence
Listing remarks MLS
This is a must see cottage move in ready. The cottage has been completely renovated and in excellant condition. House will qualify for any type loan. House features new flooring, modern kitchen with all appliances, full masonry wood burning fireplace in the family room, large laundry room and two full baths.
Key facts
- Modern appliances
- Fenced backyard
- Covered back porch
Tags
Property features AI
Finance
- Other: Zoned general residential
- Financial info: Financial details not provided
- HOA & community: No HOA information provided
Exterior
- Parking: Carport (1 space); Gravel parking
- Security: Deadbolt locks
- Utilities: Public water; Public sewer; Electricity connected; Natural gas available and connected; Cable available
- Home design: Single-family house; One story; Move-in ready
- Construction: Siding and plaster exterior; Pillar/post/pier foundation; Shingle roof; Built year information from assessor
- Exterior features: Private, fenced backyard; Deck; City lot
Interior
- Kitchen: Built-in electric range; Dishwasher; Refrigerator; Stainless steel appliances
- Bedrooms: Bedrooms information not provided
- Flooring: Carpet; Laminate
- Bathrooms: 2 full bathrooms
- Heating & cooling: Central heating (natural gas); Central air conditioning
- Interior features: Open floorplan; Laminate countertops; Blinds on windows; Deadbolt locks; Wood-burning fireplace
- Laundry & utility: Main-level laundry room with washer and electric dryer hook ups
Neighborhood map
What this means for you Summary
Snapshot
- This is a 3-bed/2.0-bath single-family listed at $122k.
Deal economics
- At list price, monthly cash flow is $186 ($2k/yr) — positive.
- The deal already cash-flows at list — no discount required.
- Meets the 1% rule at list price ($1k rent vs $122k).
- Cap rate 8.1% vs local median 6.5% in McComb — meaningfully above typical; check what's discounted (condition, days-on-market, listing class) to confirm the premium yield is real.
Location & tenants
- Location reads 69/100 on livability (#50 in MS) — a middle-class / working-renter tenant base. Strengths: cost of living A+, health & safety A+, housing A-; Watch: schools D-, amenities F, commute F.
- Mccomb School District (town): math 15% / reading 16% proficiency, ranked #106 of 130 in MS (top 82%) — low school quality limits family demand, transient renter base, plan for 1-2y turnover; 93% free/reduced lunch — lower-income household profile, screen leases tightly.
- Market conditions: 190 active listings in the ZIP; 1 comparable units currently listed for rent nearby; 10 units permitted in Pike County in 2024 (0 in 5+ unit buildings).
Forward outlook
- Local home prices are declining (-3.0%/yr); year-one equity from $843 of loan paydown is wiped out by about $4k of value loss. Plan a longer hold.
- Pike County population projected at -14% by 2050 — secular population decline; favor cash flow + early exit over multi-decade hold.
Negotiation context
- Only 8 days on market — expect competitive offers; lowballing is unlikely to land.
- 5 sale attempts since 11y ago with the ask held roughly flat each time — persistent listings suggest the price (not the market) is what's stuck; bring a comps-based counter.
Risks & watch-outs
- Climate carrying-cost: severe wind risk, 99% chance of damaging wind over 30y; extreme-heat days projected 7→21/yr by 2055 (HVAC capex compounding) — expect insurance premiums to compound above CPI over the hold.
Questions for the listing agent
- Built in 1974 — when were the roof, HVAC, electrical panel, plumbing, and water heater last replaced?
- Is there a deadline driving the sale (1031 exchange, divorce, estate, relocation)? That informs how much negotiation room exists.
- Schools are D-rated, which usually means shorter tenancies and higher turnover. Who's the typical renter profile here, and what's been the actual vacancy rate?
- What's the average days-on-market for RENTAL listings here right now (not sales)? A rising rental-DOM trend means longer vacancies and softer asking-rent achievability than the comps imply.
- What's the recent tenant-quality profile in this submarket — average credit score on applications, eviction rate, late-payment / NSF rate, and stable-employment percentage? A property-management company in the area should have these aggregated.
- How much new for-sale + rental construction is in the pipeline within 1–3 miles? Heavy new supply typically softens prices + rents 12–24 months out; constrained supply supports both.
Investment metrics
- 1% rule
- 1.07% ✓
- Cap rate
- 8.12%
- Cash-on-cash
- 6.52%
- DSCR
- 1.29
- GRM
- 7.8
CMA / ARV
- ARV (on-the-fly)
- $155,330
- Comps found
- 12
Show comp detail 12 sales within ~0.75 mi
| Address | Dist | Beds/Ba | Sqft | Sold | Price | $/sf | Match |
|---|---|---|---|---|---|---|---|
| 505 Lakeview Ave | 0.05mi | 3/2.0 | 1,606 (+1%) | 15mo | $118,000 | $73 | 83 |
| 605 Maxine St | 0.14mi | 3/2.0 | 1,542 (-3%) | 11mo | $182,000 | $118 | 80 |
| 521 Avalon Ave | 0.40mi | 3/2.0 | 1,661 (+5%) | 1mo | $259,500 | $156 | 72 |
| 1623 Christine Dr | 0.37mi | 3/2.0 | 1,513 (-4%) | 7mo | $149,000 | $98 | 70 |
| 406 Aston Ave | 0.45mi | 3/1.5 | 1,690 (+7%) | 0mo | $120,000 | $71 | 66 |
| 308 Burke Ave | 0.56mi | 3/2.0 | 1,658 (+5%) | 11mo | $149,000 | $90 | 57 |
| 604 Marion Ave | 0.16mi | 3/2.0 | 1,367 (-14%) | 18mo | $158,900 | $116 | 55 |
| 509 Caston Ave | 0.59mi | 2/1.0 (-1) | 1,468 (-7%) | 1mo | $39,900 | $27 | 50 |
| 1120 Delaware Ave | 0.60mi | 3/3.0 | 1,467 (-7%) | 7mo | $115,000 | $78 | 49 |
| 508 Kentucky Ave | 0.69mi | 3/2.0 | 1,680 (+6%) | 20mo | $99,999 | $60 | 42 |
| 205 Butler St | 0.73mi | 3/2.0 | 1,428 (-10%) | 11mo | $147,500 | $103 | 40 |
| 305 James Ave N | 0.49mi | 3/2.0 | 1,366 (-14%) | 17mo | $150,000 | $110 | 40 |
Match score weights: distance 35% · size 25% · config 20% · recency 20%. Top-matched comps best support the ARV.
Projected returns pro-forma
-3.0% appreciation · 3.0% rent growth · sell at horizon
- IRR
- -6.3%
- Equity multiple
- 0.77×
- Total profit
- $-7,925
- Equity at exit
- $18,191
- IRR
- 3.4%
- Equity multiple
- 1.25×
- Total profit
- $8,401
- Equity at exit
- $10,548
Cash invested: $34,160 (down + closing). Projections, not guarantees.
Landlord ↔ Tenant lean methodology
- Overall (STATE)
- 90 Strongly Landlord-Friendly
- State Mississippi
- 90 Strongly Landlord-Friendly · R+11
- County
- — inherits STATE
- City
- — inherits STATE
ZIP-level market 39648
- Active inventory
- 190
- Price-to-rent
- 7.8×
Monthly cashflow live
- Estimated rent
- $1,300 medium interval (Pro) →
- Mortgage (P&I)
- −$640
- Tax from tax record
- −$151 /mo · $1,809/yr
- Insurance
- −$51
- HOA
- −$0
- Vacancy / Maint / Mgmt
- −$273
- Net cashflow
- $186
Break-even live
UW: 25.0% down · 7.5% · 30yr · 1.5% tax · 5.0% vac · 8.0% maint · 8.0% mgmt
Financing live
Cash to close
- Down payment
- $30,500
- Closing costs
- $3,660
- Reserves months
- —
- Total cash needed
- —
Loan-product check · same deal, 3 products live
Conventional
25% down · 7.5% · 30yr
- Down + closing
- —
- Monthly P&I
- —
- Monthly cashflow
- —
- DSCR
- —
- Eligible?
- —
Personal DTI + credit; lowest rate.
DSCR
20% down · 8.5% · 30yr
- Down + closing
- —
- Monthly P&I
- —
- Monthly cashflow
- —
- DSCR
- —
- Eligible?
- —
No personal income docs; deal must DSCR.
Hard money
10% down · 12.0% · 12mo
- Down + closing
- —
- Monthly P&I
- —
- Monthly cashflow
- —
- DSCR
- —
- Eligible?
- —
Short-term bridge; refi at stabilization.
Rent comps 1 comps
| Address | Beds | Baths | Sqft | Rent | $/sqft | DOM | Units | Dist |
|---|---|---|---|---|---|---|---|---|
| 238 Westview Cir McComb, MS | 3.0 | 2.0 | 1574 | $1,300 | $0.83 | 43d | 1 | 1.36mi |
Listing history 7 events
-
2026-06-18days on market $122,000 Active 8 DOM
-
2026-06-17days on market $122,000 Active 7 DOM
-
2026-06-16days on market $122,000 Active 6 DOM
-
2026-06-15days on market $122,000 Active 5 DOM
-
2026-06-13days on market $122,000 Active 3 DOM
-
2026-06-12remarks 699-char remark
-
2026-06-12$122,000 Active 2 DOM
ⓘ Source: listings_history table (triggers on properties + properties_extension) + one-shot
backfill from property_details.listing_events for pre-trigger history.
Tax reassessment forecast MS · Resets to sale price
- Current annual tax
- $1,809 · $151/mo
- Projected year-2 tax
- $1,809 · $151/mo
- Expected delta
- $0/yr ($0/mo · 0.0%)
ⓘ Screening estimate from a state-policy table — verify with the county assessor before closing.
Climate risk First Street
- Flood 1/10 Low FEMA zone X (unshaded) · 0% chance over 30 yrs
- Wildfire 4/10 Moderate
- Heat 8/10 Severe 7 d/yr ≥109°F today · 21 d/yr by 30 yrs out
- Wind 8/10 Severe 99% chance of damaging wind over 30 yrs
- Air quality 1/10 Low 0 unhealthy d/yr today · 0 by 30 yrs out
Nearby sold comps map
Loading sold comps map…
Walkable amenities ~0.75 mi
Loading nearby amenities…
Taxation est. · year 1
- Rental income
- $15,600
- − Mortgage interest
- −$6,834
- − Property taxes
- −$1,809
- − Insurance
- −$610
- − Repairs & maintenance
- −$1,248
- − Management
- −$1,248
- − Depreciation
- −$3,549
- Taxable income
- $302
- Est. tax owed @ 24.0%
- −$73
- After-tax cash flow
- $2,155/yr
For passive investors: Depreciation is non-cash, so a rental often shows a tax loss while cash-flowing — sheltering income. Rental losses are passive: they offset passive income freely, and up to $25,000/yr can offset ordinary (W-2) income if you actively participate and your MAGI is under $100k (phasing out to $0 by $150k); unused losses carry forward. On sale, claimed depreciation is recaptured at up to 25%, and gains may owe capital-gains tax (a 1031 exchange can defer both). Figures are a year-1 estimate at your 24.0% rate — not tax advice; consult a CPA.
Schools (NCES district)
- District
- Mccomb School District
- NCES district ID
- 2802880
- Math proficiency
- 15% ▼ -20.00%
- Reading proficiency
- 16% ▼ -5.00%
- Median HH income
- $29,855
- Composite
- 12.26/100
- National rank
- #9645
- State rank
- #106 of 130 in MS
Livability — McComb
- Score
- 69/100
- State rank
- #50
- US rank
- #8347
Category grades
Schools grade is shown separately in the Schools card above.
Census & demographics
- Census place
- McComb, MS
- Population (ZIP)
- 19,767
Population outlook (Pike County) Hauer SSP2
- Today (2025)
- 38,766 people
- By 2030
- 37,874 · -2.3%
- By 2040
- 35,743 · -7.8%
- By 2050
- 33,276 · -14.2%
- By 2075
- 26,799 · -30.9%
- By 2100
- 18,562 · -52.1%
Race, ethnicity, and origin ACS 2023
- Neighborhood character
- Majority Black (64%)
- Race & ethnicity
- Black 64% White 32% Two or more races 2% Hispanic / Latino 2%
- Common ancestry
- Slovak 2% Lithuanian 1% Italian 1%
- Foreign-born
- 1%
- Languages at home
- 98% English-only · Spanish 1%
Political lean MEDSL · Pike
- 2024 margin
- Toss-up / Even · D 47.8% · R 51.3%
- 2008→2024 swing
- -7.0pp toward R · 2008: 3.5pp · 2024: -3.5pp
- All cycles
- 2024: R+3.5 2020: D+1.0 2016: R+0.7 2012: D+7.6 2008: D+3.5
Not yet ingested
- Civics
- —
Market trends
- HPI YoY
- ▼ -88.61%
- Current HPI
- 92.2495
- Rent YoY
- —
- Metro
- —
- State GDP YoY
- —
- F500 in state
- 0
Price history
+25.8% since first listed14 events — show timeline
- 2026-06-10 Listed $122,000 MLSU
- 2026-01-12 Price Changed $122,000 MLSU
- 2026-01-12 Relisted — MLSU
- 2026-01-08 Pending — MLSU
- 2026-01-08 Listing Removed — MLSU
- 2025-11-20 Price Changed $124,500 MLSU
- 2025-10-23 Price Changed $129,500 MLSU
- 2025-09-23 Listed $132,000 MLSU
- 2022-02-25 Sold (Public Records) — Public Records
- 2022-02-25 Sold (MLS) — MLSU
- 2021-10-05 Listed $129,000 MLSU
- 2016-04-13 Sold (MLS) — MLSU
- 2015-04-30 Listed $97,000 MLSU
- 2004-02-10 Sold (Public Records) — Public Records
Property tax history
+7.6%/yrLatest (2025): $1,809 · +123.7% YoY. Source: county tax records.
Cash-flow waterfall
monthlySold comps — $/sqft
last 12 mo · ≤1 miLoading sold comps…