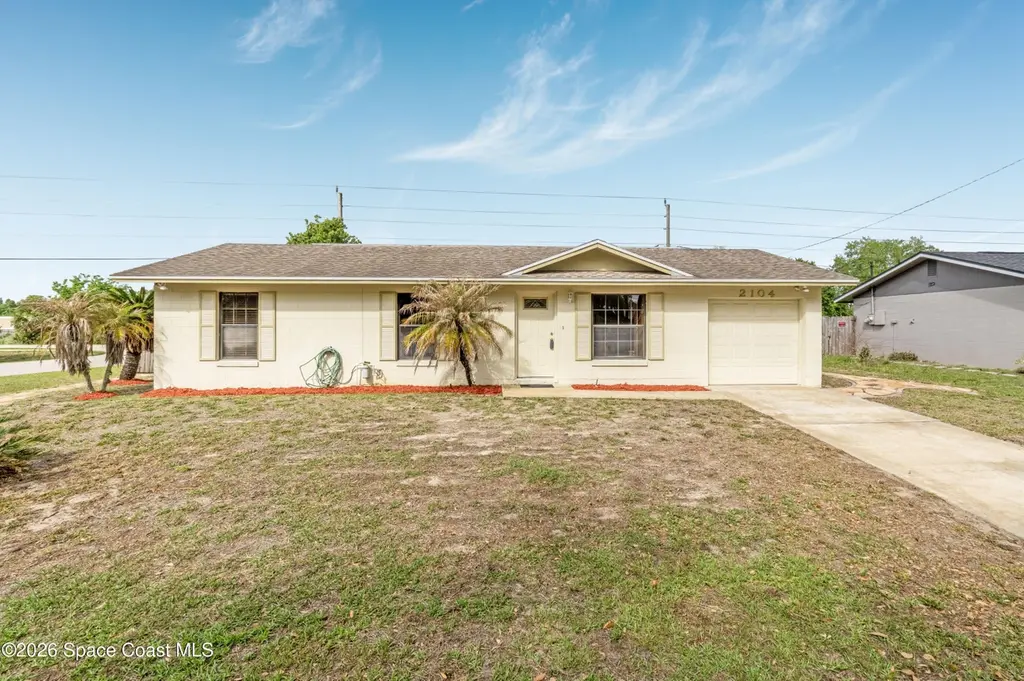
2104 Watts Dr · Mims, FL
Flood risk 4/10 · Minor
- FEMA flood zone
- X (unshaded)
- Chance of flooding over 30 yrs
- 0.22%
- Est. flood insurance / yr
- $507 – $1,088
Fire risk 6/10 · Moderate
- Est. fire insurance / yr
- $947 – $1,759
Heat risk 10/10 · Severe
- Hot days now (above 108°F)
- 7 days/yr
- Hot days in 30 yrs
- 23 days/yr
Wind risk 10/10 · Severe
- Chance of severe wind over 30 yrs
- 99.0%
Air-quality risk 1/10 · Minimal
- Unhealthy air days now
- 0 days/yr
- Unhealthy air days in 30 yrs
- 0 days/yr
Risk factors via First Street. Map © Google.
Why this score? — see what drove the D- grade
The composite is a weighted blend of 9 inputs, each scored 0–100. Each bar is that input's sub-score; the figure is the points it added to the 100-point composite (weight × sub-score).
- Cash flow +13.0/30.0
- ARV discount +7.5/15.0
- Schools +4.7/10.0
- DSCR +3.9/10.0
- Livability +3.1/5.0
- 1% rule +2.5/10.0
- Rent growth +2.5/5.0
- Condition / age +2.5/5.0
- Appreciation +0.0/10.0
$214,900
🖨 Deal sheet (PDF) 📄 Offer letter ✓ Due diligence
Listing remarks
Welcome to 2104 Watts Drive in Mims, Florida -- a comfortable home with plenty of potential and Florida charm. Sitting on a roomy lot with mature trees, this property offers peaceful surroundings and space to make it your own. Inside you'll find a practical layout with bright living areas, a functional kitchen, and good-sized bedrooms ready for your personal touch. The home has been cared for over the years and offers a solid foundation for updates or improvements at your own pace. Outside, enjoy a spacious yard perfect for pets, hobbies, or weekend projects. Conveniently located near US-1 and I-95, you're just minutes from Titusville, local shops, and the Space Coast's natural beauty. If y
Key facts
- 7,841 sq ft lot
- Garage
- Built 1981
Property features AI
Finance
- Other: Directions: From I-95, take the exit for Mims and head west toward town, then continue through the local roads toward Watts Dr in Mims, Florida. Turn onto Watts Dr and follow it to 2104 Watts Dr.
Exterior
- Parking: Garage (1 car)
- Utilities: Public sewer; Cable available; Electricity connected; Sewer connected; Water connected
- Home design: Single family residence
- Construction: Block construction
- Exterior features: Lot includes other features; Lot size approximately 0.18 acres; Property faces east; No private pool
Interior
- Bedrooms: 3 bedrooms on the main level
- Bathrooms: 1 full bathroom
- Heating & cooling: Central heating; Central air conditioning
- Interior features: 3 total rooms; Partially furnished
Neighborhood map
What this means for you Summary
Snapshot
- This is a 3-bed/2.0-bath single-family listed at $215k.
Deal economics
- At list price, monthly cash flow is $-11 ($-128/yr) — negative.
- To cash-flow at today's rent, offer at most $213k (0.9% below list).
- To meet the 1% rule (rent ≥ 1% of price), the offer needs to be $160k (25.4% below list).
- Recommended offer: $160k (25.4% below list) — sets the bar for 1% rule.
Location & tenants
- Location reads 62/100 on livability (#765 in FL) — a middle-class / working-renter tenant base. Strengths: cost of living A+, housing A+, crime B+; Watch: amenities F, commute F, employment F.
- Brevard (suburban): math 53% / reading 57% proficiency, ranked #19 of 73 in FL (top 26%) — acceptable for families but not a draw, mixed tenant base, ~2y average lease.
- Zoned schools: Mims Elementary School (math 42% / reading 47%, grade F, #1,288 of 2,144 statewide, top 62%, 462 students, 80% FRL); James Madison Middle School (math 39% / reading 39%, grade F, #381 of 571 statewide, top 67%, 446 students, 65% FRL); Astronaut High School (math 25% / reading 43%, grade F, #394 of 667 statewide, top 60%, 1,112 students, 51% FRL) — zoned schools average 65% FRL vs 43% district-wide (22 pts higher); higher-poverty schools than district average — tighter screening recommended.
- Zoned-school proficiency averages 39% at this address vs 55% district-wide (-16 pts) — the specific schools serving this property underperform the Brevard average; the district grade overstates school quality for this exact location.
- Market conditions: 184 active listings in the ZIP; 4,602 units permitted in Brevard County in 2024 (702 in 5+ unit buildings).
Forward outlook
- Local home prices are declining (-3.0%/yr); year-one equity from $1k of loan paydown is wiped out by about $6k of value loss. Plan a longer hold.
- Brevard County population projected at +15% by 2050 — modest demand growth; plan on rents tracking national, not racing it.
Negotiation context
- It's been on market 67 days — a 6% lower offer ($202k) is reasonable based on typical stale-listing flexibility.
- Current owner paid $33k; list at $215k implies a 557% gain — meaningful room to come down on a strong offer.
Risks & watch-outs
- Climate carrying-cost: severe wind risk, 99% chance of damaging wind over 30y; major wildfire risk; extreme-heat days projected 7→23/yr by 2055 (HVAC capex compounding) — expect insurance premiums to compound above CPI over the hold.
Questions for the listing agent
- What do current leases actually rent for vs. the listed asking? Can we see a recent rent roll and the last 12 months of T-12 income?
- It's been on market 67 days. Have you received any prior offers? Is the seller open to a 25% concession, seller financing, or rate buy-down credit?
- Why hasn't it sold? Are there any deal-killer items the seller is aware of (foundation, flood, title, zoning, code violations)?
- Is there a deadline driving the sale (1031 exchange, divorce, estate, relocation)? That informs how much negotiation room exists.
- Schools are D-rated, which usually means shorter tenancies and higher turnover. Who's the typical renter profile here, and what's been the actual vacancy rate?
- The area grade is low — what's the realistic commute time and amenity access for the typical tenant pool here? Any planned neighborhood developments (good or bad) we should know about?
- What's the average days-on-market for RENTAL listings here right now (not sales)? A rising rental-DOM trend means longer vacancies and softer asking-rent achievability than the comps imply.
- What's the recent tenant-quality profile in this submarket — average credit score on applications, eviction rate, late-payment / NSF rate, and stable-employment percentage? A property-management company in the area should have these aggregated.
- How much new for-sale + rental construction is in the pipeline within 1–3 miles? Heavy new supply typically softens prices + rents 12–24 months out; constrained supply supports both.
Investment metrics
- 1% rule
- 0.75% ✗
- Cap rate
- 6.23%
- Cash-on-cash
- -0.21%
- DSCR
- 0.99
- GRM
- 11.2
CMA / ARV
No comps found within radius.
Projected returns pro-forma
-3.0% appreciation · 3.0% rent growth · sell at horizon
- IRR
- -16.7%
- Equity multiple
- 0.41×
- Total profit
- $-35,605
- Equity at exit
- $32,042
- IRR
- -8.6%
- Equity multiple
- 0.46×
- Total profit
- $-32,296
- Equity at exit
- $18,581
Cash invested: $60,172 (down + closing). Projections, not guarantees.
Landlord ↔ Tenant lean methodology
- Overall (STATE)
- 87 Strongly Landlord-Friendly
- State Florida
- 87 Strongly Landlord-Friendly · R+3
- County
- — inherits STATE
- City
- — inherits STATE
ZIP-level market 32754
- Home prices YoY
- -9.4%
- Active inventory
- 184
- Price-to-rent
- 11.2×
Monthly cashflow live
- Estimated rent
- $1,604 medium interval (Pro) →
- Mortgage (P&I)
- −$1,127
- Tax from tax record
- −$61 /mo · $737/yr
- Insurance
- −$90
- HOA
- −$0
- Vacancy / Maint / Mgmt
- −$337
- Net cashflow
- $-11
Break-even live
Sensitivity live
| Price | -10% $111 | -5% $50 | +0% $-11 | +5% $-71 | +10% $-132 |
|---|---|---|---|---|---|
| Rent | -10% $-137 | -5% $-74 | +0% $-11 | +5% $53 | +10% $116 |
| Rate | -1.0pp $98 | -0.5pp $44 | base $-11 | +0.5pp $-66 | +1.0pp $-123 |
UW: 25.0% down · 7.5% · 30yr · 1.5% tax · 5.0% vac · 8.0% maint · 8.0% mgmt
Financing live
Cash to close
- Down payment
- $53,725
- Closing costs
- $6,447
- Reserves months
- —
- Total cash needed
- —
Loan-product check · same deal, 3 products live
Conventional
25% down · 7.5% · 30yr
- Down + closing
- —
- Monthly P&I
- —
- Monthly cashflow
- —
- DSCR
- —
- Eligible?
- —
Personal DTI + credit; lowest rate.
DSCR
20% down · 8.5% · 30yr
- Down + closing
- —
- Monthly P&I
- —
- Monthly cashflow
- —
- DSCR
- —
- Eligible?
- —
No personal income docs; deal must DSCR.
Hard money
10% down · 12.0% · 12mo
- Down + closing
- —
- Monthly P&I
- —
- Monthly cashflow
- —
- DSCR
- —
- Eligible?
- —
Short-term bridge; refi at stabilization.
Listing history 17 events
-
2026-06-22days on market $214,900 Active 67 DOM
-
2026-06-18days on market $214,900 Active 64 DOM
-
2026-06-17days on market $214,900 Active 63 DOM
-
2026-06-16days on market $214,900 Active 62 DOM
-
2026-06-15days on market $214,900 Active 61 DOM
-
2026-06-14pricedays on market $214,900 Active 59 DOM
-
2026-06-10days on market $219,900 Active 56 DOM
-
2026-06-08days on market $219,900 Active 54 DOM
-
2026-06-07days on market $219,900 Active 53 DOM
-
2026-06-05days on market $219,900 Active 50 DOM
-
2026-06-03days on market $219,900 Active 49 DOM
-
2026-06-02days on market $219,900 Active 48 DOM
-
2026-06-01days on market $219,900 Active 47 DOM
-
2026-05-31days on market $219,900 Active 46 DOM
-
2026-05-31days on market $219,900 Active 45 DOM
-
2026-04-13$219,900 Active
-
1981-11-01soldstatus $32,700
ⓘ Source: listings_history table (triggers on properties + properties_extension) + one-shot
backfill from property_details.listing_events for pre-trigger history.
Tax reassessment forecast FL · Resets to sale price
- Current annual tax
- $737 · $61/mo
- Projected year-2 tax
- $1,784 · $149/mo
- Expected delta
- +$1,047/yr (+$87/mo · 142.1%)
ⓘ Screening estimate from a state-policy table — verify with the county assessor before closing.
Climate risk First Street
- Flood 4/10 Moderate FEMA zone X (unshaded) · 22% chance over 30 yrs
- Wildfire 6/10 Major
- Heat 10/10 Extreme 7 d/yr ≥108°F today · 23 d/yr by 30 yrs out
- Wind 10/10 Extreme 99% chance of damaging wind over 30 yrs
- Air quality 1/10 Low 0 unhealthy d/yr today · 0 by 30 yrs out
Nearby sold comps map
Loading sold comps map…
Walkable amenities ~0.75 mi
Loading nearby amenities…
Taxation est. · year 1
- Rental income
- $19,249
- − Mortgage interest
- −$12,038
- − Property taxes
- −$737
- − Insurance
- −$1,074
- − Repairs & maintenance
- −$1,540
- − Management
- −$1,540
- − Depreciation
- −$6,252
- Taxable loss
- −$3,931
- Est. tax savings @ 24.0%
- +$943
- After-tax cash flow
- $816/yr
For passive investors: Depreciation is non-cash, so a rental often shows a tax loss while cash-flowing — sheltering income. Rental losses are passive: they offset passive income freely, and up to $25,000/yr can offset ordinary (W-2) income if you actively participate and your MAGI is under $100k (phasing out to $0 by $150k); unused losses carry forward. On sale, claimed depreciation is recaptured at up to 25%, and gains may owe capital-gains tax (a 1031 exchange can defer both). Figures are a year-1 estimate at your 24.0% rate — not tax advice; consult a CPA.
Schools (NCES district)
- District
- Brevard
- NCES district ID
- 1200150
- Math proficiency
- 53% ▼ -9.00%
- Reading proficiency
- 57% ▼ -4.00%
- Median HH income
- $49,426
- Composite
- 46.86/100
- National rank
- #2370
- State rank
- #19 of 73 in FL
Livability — Mims
- Score
- 62/100
- State rank
- #765
- US rank
- #17094
Category grades
Schools grade is shown separately in the Schools card above.
Census & demographics
- Census place
- Mims, FL
- Population (ZIP)
- 11,250
Population outlook (Brevard County) Hauer SSP2
- Today (2025)
- 623,254 people
- By 2030
- 648,420 · +4.0%
- By 2040
- 690,009 · +10.7%
- By 2050
- 715,669 · +14.8%
- By 2075
- 775,744 · +24.5%
- By 2100
- 776,687 · +24.6%
Race, ethnicity, and origin ACS 2023
- Neighborhood character
- Predominantly White (92%)
- Race & ethnicity
- White 92% Black 5% Two or more races 3% Hispanic / Latino 2%
- Common ancestry
- Lithuanian 4% Iranian 3% Italian 2%
- Foreign-born
- 2% · Canada
- Languages at home
- 97% English-only · Spanish 1% French/Haitian/Cajun 1%
Political lean MEDSL · Brevard
- 2024 margin
- Strong R (+20.8) · D 39.1% · R 59.9% · Other 1.0%
- 2008→2024 swing
- -10.4pp toward R · 2008: -10.4pp · 2024: -20.8pp
- All cycles
- 2024: R+20.8 2020: R+16.4 2016: R+19.8 2012: R+12.7 2008: R+10.4
Not yet ingested
- Civics
- —
Market trends
- HPI YoY
- ▼ -34.55%
- Current HPI
- 333.7709
- Rent YoY
- —
- Metro
- —
- State GDP YoY
- ▲ 3.28%
- F500 in state
- 36
Industry mix (Fortune 500 HQ in FL)
| Industry | F500 HQs | Revenue |
|---|---|---|
| Industrial Technology | 2 | $29B |
|
||
| Insurance | 2 | $17B |
|
||
| Retail | 1 | $60B |
|
||
| Technology Distribution | 1 | $58B |
|
||
| Homebuilding | 1 | $35B |
|
||
| Technology Manufacturing | 1 | $35B |
|
||
Price history
+572.5% since first listed2 events — show timeline
- 2026-04-13 Listed $219,900 SCMLS
- 1981-11-01 Sold (Public Records) $32,700 Public Records
Property tax history
+5.1%/yrLatest (2025): $737 · +12.5% YoY. Source: county tax records.
Cash-flow waterfall
monthlySold comps — $/sqft
last 12 mo · ≤1 miLoading sold comps…