1020 Vermilion St · Catahoula, LA
Flood risk 6/10 · Moderate
- FEMA flood zone
- A
- Chance of flooding over 30 yrs
- 0.74%
- Est. flood insurance / yr
- $1,009 – $1,996
Fire risk 1/10 · Minimal
- Est. fire insurance / yr
- $1,269 – $2,357
Heat risk 8/10 · Major
- Hot days now (above 108°F)
- 7 days/yr
- Hot days in 30 yrs
- 21 days/yr
Wind risk 9/10 · Severe
- Chance of severe wind over 30 yrs
- 99.0%
Air-quality risk 2/10 · Minimal
- Unhealthy air days now
- 0 days/yr
- Unhealthy air days in 30 yrs
- 1 days/yr
Risk factors via First Street. Map © Google.
Why this score? — see what drove the C- grade
The composite is a weighted blend of 9 inputs, each scored 0–100. Each bar is that input's sub-score; the figure is the points it added to the 100-point composite (weight × sub-score).
- Cash flow +23.8/30.0
- DSCR +7.7/10.0
- ARV discount +7.5/15.0
- 1% rule +4.9/10.0
- Livability +3.2/5.0
- Rent growth +2.5/5.0
- Condition / age +2.5/5.0
- Schools +2.3/10.0
- Appreciation +0.0/10.0
$107,000
🖨 Deal sheet 📄 Offer letter ✓ Due diligence
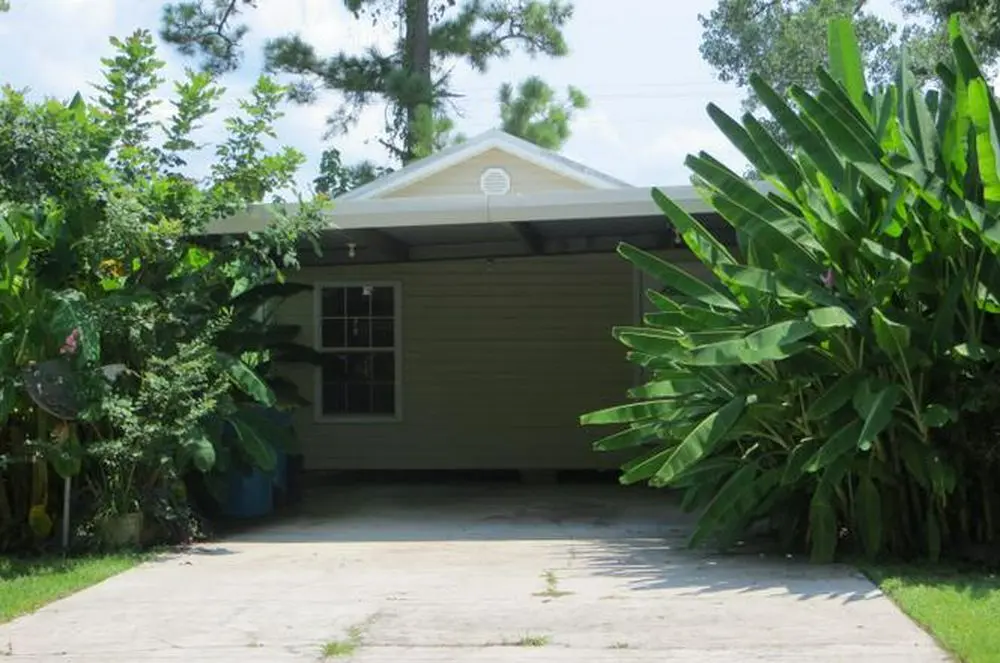
Listing remarks
3 Bedroom, 3 Bath with shower, Living Room, Dining Room, Kitchen, with carport park 6 cars. The house is half and half one half is a two-bedroom two-bath mobile home, and the other half is a spacious one-bedroom one-bath House with living room and spacious walk-in closet, the place is large and fairly nice But the place does need a few repairs so, the owner is selling the place below the market value of 127,000 and the good news is the Owner is giving 10,000 to 15,000 CASH BACK to the Buyer at closing to help with the repairs. If you have any questions or would like to make an offer please call: 504-610-8593
Key facts
- 6.97 acre lot
- Listed 6 days
Property features AI
Exterior
- Home design: Single-family house; Living area approximately 2,050
- Exterior features: Approximately 6.97 acres lot
Neighborhood map
What this means for you Summary
Snapshot
- This is a 3-bed/3.0-bath other listed at $107k.
Deal economics
- At list price, monthly cash flow is $81 ($973/yr) — positive.
- The deal already cash-flows at list — no discount required.
- To meet the 1% rule (rent ≥ 1% of price), the offer needs to be $106k (1.4% below list).
- Recommended offer: $106k (1.4% below list) — sets the bar for 1% rule.
Location & tenants
- Location reads 63/100 on livability (#193 in LA) — a middle-class / working-renter tenant base. Strengths: cost of living A+, housing A+, crime A-; Watch: schools F, amenities F, commute F.
- St. Martin Parish (rural): math 23% / reading 32% proficiency, ranked #49 of 98 in LA (top 50%) — low school quality limits family demand, transient renter base, plan for 1-2y turnover; 68% free/reduced lunch — lower-income household profile, screen leases tightly.
- Market conditions: 276 active listings in the ZIP; 54 units permitted in St. Martin Parish in 2024 (0 in 5+ unit buildings).
Forward outlook
- Local home prices are declining (-3.0%/yr); year-one equity from $740 of loan paydown is wiped out by about $3k of value loss. Plan a longer hold.
- St. Martin County population projected at +7% by 2050 — modest demand growth; plan on rents tracking national, not racing it.
Negotiation context
- Only 6 days on market — expect competitive offers; lowballing is unlikely to land.
- 3 sale attempts with the ask held roughly flat each time — persistent listings suggest the price (not the market) is what's stuck; bring a comps-based counter.
- Current owner paid $6k; list at $107k implies a 1683% gain — meaningful room to come down on a strong offer.
Risks & watch-outs
- Watch-outs: flood insurance adds $125/mo.
- Climate carrying-cost: in FEMA flood zone A (mandatory federal flood insurance); severe wind risk, 99% chance of damaging wind over 30y; extreme-heat days projected 7→21/yr by 2055 (HVAC capex compounding) — expect insurance premiums to compound above CPI over the hold.
Questions for the listing agent
- What's the actual annual flood-insurance premium (NFIP or private), and is the property in a SFHA with mandatory coverage?
- Is there a deadline driving the sale (1031 exchange, divorce, estate, relocation)? That informs how much negotiation room exists.
- Schools are F-rated, which usually means shorter tenancies and higher turnover. Who's the typical renter profile here, and what's been the actual vacancy rate?
- What's the average days-on-market for RENTAL listings here right now (not sales)? A rising rental-DOM trend means longer vacancies and softer asking-rent achievability than the comps imply.
- What's the recent tenant-quality profile in this submarket — average credit score on applications, eviction rate, late-payment / NSF rate, and stable-employment percentage? A property-management company in the area should have these aggregated.
- How much new for-sale + rental construction is in the pipeline within 1–3 miles? Heavy new supply typically softens prices + rents 12–24 months out; constrained supply supports both.
Investment metrics
- 1% rule
- 0.99% ✗
- Cap rate
- 8.61%
- Cash-on-cash
- 8.26%
- DSCR
- 1.37
- GRM
- 8.4
CMA / ARV
No comps found within radius.
Projected returns pro-forma
-3.0% appreciation · 3.0% rent growth · sell at horizon
- IRR
- -11.2%
- Equity multiple
- 0.59×
- Total profit
- $-12,149
- Equity at exit
- $15,954
- IRR
- -1.9%
- Equity multiple
- 0.87×
- Total profit
- $-3,829
- Equity at exit
- $9,251
Cash invested: $29,960 (down + closing). Projections, not guarantees.
Landlord ↔ Tenant lean methodology
- Overall (STATE)
- 90 Strongly Landlord-Friendly
- State Louisiana
- 90 Strongly Landlord-Friendly · R+12
- County
- — inherits STATE
- City
- — inherits STATE
ZIP-level market 70517
- Home prices YoY
- -33.7%
- Active inventory
- 276
- Price-to-rent
- 8.4×
Monthly cashflow live
- Estimated rent
- $1,055 medium interval (Pro) →
- Mortgage (P&I)
- −$561
- Tax from tax record
- −$22 /mo · $260/yr
- Insurance
- −$45
- Flood insurance flood zone
- −$125 /mo · $1,502/yr
- HOA
- −$0
- Vacancy / Maint / Mgmt
- −$222
- Net cashflow
- $81
Break-even live
UW: 25.0% down · 7.5% · 30yr · 1.5% tax · 5.0% vac · 8.0% maint · 8.0% mgmt
Financing live
Cash to close
- Down payment
- $26,750
- Closing costs
- $3,210
- Reserves months
- —
- Total cash needed
- —
Loan-product check · same deal, 3 products live
Conventional
25% down · 7.5% · 30yr
- Down + closing
- —
- Monthly P&I
- —
- Monthly cashflow
- —
- DSCR
- —
- Eligible?
- —
Personal DTI + credit; lowest rate.
DSCR
20% down · 8.5% · 30yr
- Down + closing
- —
- Monthly P&I
- —
- Monthly cashflow
- —
- DSCR
- —
- Eligible?
- —
No personal income docs; deal must DSCR.
Hard money
10% down · 12.0% · 12mo
- Down + closing
- —
- Monthly P&I
- —
- Monthly cashflow
- —
- DSCR
- —
- Eligible?
- —
Short-term bridge; refi at stabilization.
Listing history 6 events
-
2026-06-18days on market $107,000 Active 6 DOM
-
2026-06-17days on market $107,000 Active 5 DOM
-
2026-06-16days on market $107,000 Active 4 DOM
-
2026-06-15days on market $107,000 Active 3 DOM
-
2026-06-13remarks 620-char remark
-
2026-06-13$107,000 Active 1 DOM
ⓘ Source: listings_history table (triggers on properties + properties_extension) + one-shot
backfill from property_details.listing_events for pre-trigger history.
Tax reassessment forecast LA · Resets to sale price
- Current annual tax
- $260 · $22/mo
- Projected year-2 tax
- $588 · $49/mo
- Expected delta
- +$328/yr (+$27/mo · 126.2%)
ⓘ Screening estimate from a state-policy table — verify with the county assessor before closing.
Climate risk First Street
- Flood 6/10 Major FEMA zone A · 74% chance over 30 yrs
- Wildfire 1/10 Low
- Heat 8/10 Severe 7 d/yr ≥108°F today · 21 d/yr by 30 yrs out
- Wind 9/10 Extreme 99% chance of damaging wind over 30 yrs
- Air quality 2/10 Low 0 unhealthy d/yr today · 1 by 30 yrs out
Nearby sold comps map
Loading sold comps map…
Walkable amenities ~0.75 mi
Loading nearby amenities…
Taxation est. · year 1
- Rental income
- $12,664
- − Mortgage interest
- −$5,994
- − Property taxes
- −$260
- − Insurance
- −$2,038
- − Repairs & maintenance
- −$1,013
- − Management
- −$1,013
- − Depreciation
- −$3,113
- Taxable loss
- −$766
- Est. tax savings @ 24.0%
- +$184
- After-tax cash flow
- $1,157/yr
For passive investors: Depreciation is non-cash, so a rental often shows a tax loss while cash-flowing — sheltering income. Rental losses are passive: they offset passive income freely, and up to $25,000/yr can offset ordinary (W-2) income if you actively participate and your MAGI is under $100k (phasing out to $0 by $150k); unused losses carry forward. On sale, claimed depreciation is recaptured at up to 25%, and gains may owe capital-gains tax (a 1031 exchange can defer both). Figures are a year-1 estimate at your 24.0% rate — not tax advice; consult a CPA.
Schools (NCES district)
- District
- St. Martin Parish
- NCES district ID
- 2201590
- Math proficiency
- 23% ▼ -44.00%
- Reading proficiency
- 32% ▼ -36.00%
- Median HH income
- $42,813
- Composite
- 23.41/100
- National rank
- #7897
- State rank
- #49 of 98 in LA
Livability — Catahoula
- Score
- 63/100
- State rank
- #193
- US rank
- #15305
Category grades
Schools grade is shown separately in the Schools card above.
Census & demographics
- Population (ZIP)
- 26,570
Population outlook (St. Martin County) Hauer SSP2
- Today (2025)
- 57,446 people
- By 2030
- 58,857 · +2.5%
- By 2040
- 60,859 · +5.9%
- By 2050
- 61,419 · +6.9%
- By 2075
- 61,574 · +7.2%
- By 2100
- 57,253 · -0.3%
Race, ethnicity, and origin ACS 2023
- Neighborhood character
- Majority White (62%)
- Race & ethnicity
- White 62% Black 30% Two or more races 5% Hispanic / Latino 4% Asian 1%
- Common ancestry
- Lithuanian 18% Slovak 1% Romanian 1%
- Foreign-born
- 3% · Canada, Vietnam, China
- Languages at home
- 87% English-only · French/Haitian/Cajun 9% Spanish 3% Vietnamese 1%
Political lean MEDSL · St. Martin
- 2024 margin
- Solid R (+40.7) · D 29.1% · R 69.8% · Other 1.0%
- 2008→2024 swing
- -20.0pp toward R · 2008: -20.7pp · 2024: -40.7pp
- All cycles
- 2024: R+40.7 2020: R+36.1 2016: R+33.4 2012: R+24.5 2008: R+20.7
Not yet ingested
- Civics
- —
Market trends
- HPI YoY
- ▼ -73.00%
- Current HPI
- 143.4293
- Rent YoY
- —
- Metro
- —
- State GDP YoY
- ▲ 3.29%
- F500 in state
- 10
Industry mix (Fortune 500 HQ in LA)
| Industry | F500 HQs | Revenue |
|---|---|---|
| Telecommunications | 2 | $23B |
|
||
| Utilities | 1 | $12B |
|
||
| Wholesale / Distribution | 1 | $5B |
|
||
| Advertising | 1 | $2B |
|
||
Price history
+1683.3% since first listed10 events — show timeline
- 2026-06-12 Listed $107,000 ForSaleByOwner.com
- 2025-08-25 Price Changed $89,900 AcadianaMLS
- 2025-08-25 Price Changed $89,900 GSREIN
- 2025-08-12 Price Changed $114,900 AcadianaMLS
- 2025-08-12 Price Changed $114,900 GSREIN
- 2025-08-01 Price Changed $124,900 AcadianaMLS
- 2025-08-01 Price Changed $124,900 GSREIN
- 2025-07-18 Listed $125,000 AcadianaMLS
- 2025-03-28 Listed $55,000 AcadianaMLS
- 2012-12-14 Sold (Public Records) $6,000 Public Records
Property tax history
+3.2%/yrLatest (2025): $260 · -0.6% YoY. Source: county tax records.
Cash-flow waterfall
monthlySold comps — $/sqft
last 12 mo · ≤1 miLoading sold comps…