 🔨 Auction
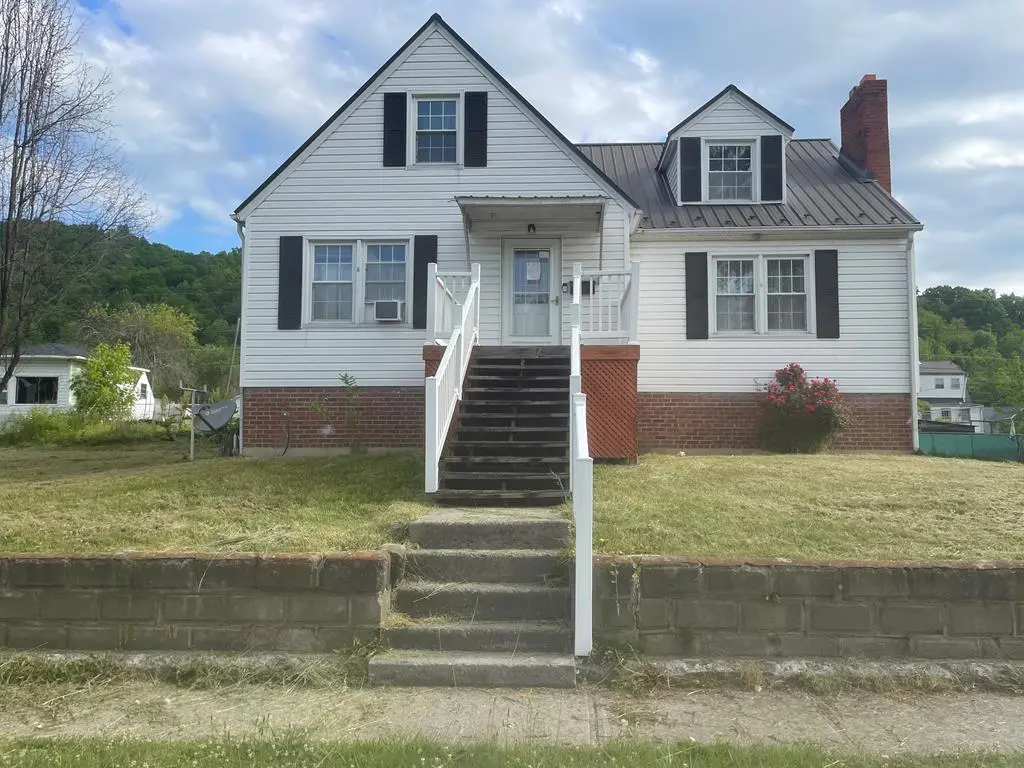
1911 4th St · Richlands, VA
Flood risk 7/10 · Major
- FEMA flood zone
- AE
- Chance of flooding over 30 yrs
- 0.77%
- Est. flood insurance / yr
- $2,026 – $9,024
Fire risk 3/10 · Minor
- Est. fire insurance / yr
- $666 – $1,236
Heat risk 3/10 · Minor
- Hot days now (above 92°F)
- 8 days/yr
- Hot days in 30 yrs
- 23 days/yr
Wind risk 2/10 · Minimal
- Chance of severe wind over 30 yrs
- —
Air-quality risk 1/10 · Minimal
- Unhealthy air days now
- 0 days/yr
- Unhealthy air days in 30 yrs
- 0 days/yr
Risk factors via First Street. Map © Google.
Why this score? — see what drove the D- grade
The composite is a weighted blend of 9 inputs, each scored 0–100. Each bar is that input's sub-score; the figure is the points it added to the 100-point composite (weight × sub-score).
- ARV discount +7.5/15.0
- Cash flow +7.2/30.0
- Schools +6.0/10.0
- Appreciation +4.1/10.0
- Livability +3.3/5.0
- Rent growth +2.5/5.0
- Condition / age +2.5/5.0
- 1% rule +2.0/10.0
- DSCR +1.4/10.0
$1
🖨 Deal sheet 📄 Offer letter ✓ Due diligence
Listing remarks
Please visit Auction.com for details regarding the auction of this property. A 1.5 Story dwelling in the Brooklyn section of Richlands. Four bedrooms, 1 1/2 baths. Partial unfinished basement. Level lot extends from 4th Street to the alley with a garden area. Square footage is estimated as public records does not allow for the second story and the property has not been viewed. Sold AS IS the online bidding will begin on June 7, 2026. A buyers premium of 5% or $2,500.00. Contact listing firm for additional information regarding the auction. PROPERTY CAN NOT BE VIEWED.
Key facts
- Garden area
- Partial basement
- Level lot
Tags
Property features AI
Exterior
- Utilities: Public water; Public sewer
- Home design: Single family residence; One and one-half stories
- Construction: Metal siding; Metal roof
- Exterior features: Level lot; Lot dimensions approximately 100 x 127 x 101 x 127; Zoned R2
Interior
- Flooring: See remarks
- Bathrooms: 1 full bathroom; 1 half bathroom
- Interior features: Basement present; Flooring: see remarks
Neighborhood map
What this means for you Summary
Snapshot
- This is a 4-bed/1.5-bath single-family listed at $1.
Deal economics
- At list price, monthly cash flow is $-705 ($-8k/yr) — negative.
- The deal already cash-flows at list — no discount required.
- Meets the 1% rule at list price ($1k rent vs $1).
Location & tenants
- Location reads 66/100 on livability (#314 in VA) — a middle-class / working-renter tenant base. Strengths: cost of living A+, housing A-; Watch: crime C-, amenities F, commute F.
- Tazewell County Public School District (town): math 67% / reading 78% proficiency, ranked #21 of 131 in VA (top 16%) — strong family-tenant draw, lease renewals of 3-5y typical.
- Zoned schools: Richlands Elementary (math 69% / reading 79%, grade A, #248 of 1,108 statewide, top 23%, 547 students, 83% FRL); Richlands Middle (math 58% / reading 71%, grade A-, #123 of 342 statewide, top 37%, 495 students, 83% FRL); Richlands High (math 68% / reading 87%, grade A-, #83 of 319 statewide, top 28%, 636 students, 82% FRL) — zoned schools average 83% FRL vs 47% district-wide (36 pts higher); higher-poverty schools than district average — tighter screening recommended.
- Market conditions: 44 active listings in the ZIP; 4 units permitted in Tazewell County in 2024 (0 in 5+ unit buildings).
Forward outlook
- Local home prices are declining (-1.9%/yr); year-one equity from $1k of loan paydown is wiped out by about $3k of value loss. Plan a longer hold.
- Tazewell County population projected at -30% by 2050 — secular population decline; favor cash flow + early exit over multi-decade hold.
Negotiation context
- It's been on market 28 days — a 2% lower offer ($0) is reasonable based on typical stale-listing flexibility.
Risks & watch-outs
- Watch-outs: property tax is 268299.0% of price; flood insurance adds $460/mo; built in 1930 — expect roof / HVAC / electrical / plumbing capex.
- Climate carrying-cost: in FEMA flood zone AE (mandatory federal flood insurance) — expect insurance premiums to compound above CPI over the hold.
Questions for the listing agent
- What do current leases actually rent for vs. the listed asking? Can we see a recent rent roll and the last 12 months of T-12 income?
- Built in 1930 — when were the roof, HVAC, electrical panel, plumbing, and water heater last replaced?
- Property tax is high relative to price — has the assessment been appealed recently, and will the sale trigger a re-assessment?
- What's the actual annual flood-insurance premium (NFIP or private), and is the property in a SFHA with mandatory coverage?
- Is there a deadline driving the sale (1031 exchange, divorce, estate, relocation)? That informs how much negotiation room exists.
- Schools are B-rated — typically a magnet for longer-tenancy family renters. What's the average tenant stay here, and is there a school-zone premium baked into asking?
- The area grade is low — what's the realistic commute time and amenity access for the typical tenant pool here? Any planned neighborhood developments (good or bad) we should know about?
- What's the average days-on-market for RENTAL listings here right now (not sales)? A rising rental-DOM trend means longer vacancies and softer asking-rent achievability than the comps imply.
- What's the recent tenant-quality profile in this submarket — average credit score on applications, eviction rate, late-payment / NSF rate, and stable-employment percentage? A property-management company in the area should have these aggregated.
- How much new for-sale + rental construction is in the pipeline within 1–3 miles? Heavy new supply typically softens prices + rents 12–24 months out; constrained supply supports both.
Investment metrics
- 1% rule
- 0.70% ✗
- Cap rate
- 4.65%
- Cash-on-cash
- -5.86%
- DSCR
- 0.74
- GRM
- 11.9
CMA / ARV
- ARV (on-the-fly)
- $178,866
- Comps found
- 6
Show comp detail 6 sales within ~0.75 mi
| Address | Dist | Beds/Ba | Sqft | Sold | Price | $/sf | Match |
|---|---|---|---|---|---|---|---|
| 307 Tazewell Ave | 0.29mi | 3/1.5 (-1) | 1,460 (-7%) | 12mo | $172,500 | $118 | 60 |
| 306 Rockbridge Ave | 0.44mi | 3/1.0 (-1) | 1,488 (-5%) | 10mo | $78,000 | $52 | 55 |
| 209 Carolina Ave | 0.73mi | 4/2.5 | 1,680 (+7%) | 7mo | $192,080 | $114 | 44 |
| 424 Kents Ridge Rd | 0.67mi | 4/2.0 | 1,502 (-4%) | 22mo | $20,000 | $13 | 41 |
| 211 Philpot Ave | 0.68mi | 3/2.5 (-1) | 1,759 (+12%) | 6mo | $233,000 | $132 | 34 |
| 1314 Kentucky Ave | 0.64mi | 3/2.0 (-1) | 1,417 (-10%) | 18mo | $120,000 | $85 | 32 |
Match score weights: distance 35% · size 25% · config 20% · recency 20%. Top-matched comps best support the ARV.
Projected returns pro-forma
-1.87% appreciation · 3.0% rent growth · sell at horizon
- IRR
- -35.2%
- Equity multiple
- -0.30×
- Total profit
- $-64,997
- Equity at exit
- $35,811
- IRR
- -33.3%
- Equity multiple
- -1.11×
- Total profit
- $-105,484
- Equity at exit
- $31,632
Cash invested: $50,082 (down + closing). Projections, not guarantees.
Landlord ↔ Tenant lean methodology
- Overall (STATE)
- 55 Moderately Landlord-Leaning
- State Virginia
- 55 Moderately Landlord-Leaning · D+2
- County
- — inherits STATE
- City
- — inherits STATE
ZIP-level market 24641
- Home prices YoY
- -1.3%
- Active inventory
- 44
Monthly cashflow live
- Estimated rent
- $1,255 medium interval (Pro) →
- Mortgage (P&I)
- −$938
- Tax est. 1.5%
- −$224 /mo · $2,683/yr
- Insurance
- −$75
- Flood insurance flood zone
- −$460 /mo · $5,525/yr
- HOA
- −$0
- Vacancy / Maint / Mgmt
- −$264
- Net cashflow
- $-705
Break-even live
UW: 25.0% down · 7.5% · 30yr · 1.5% tax · 5.0% vac · 8.0% maint · 8.0% mgmt
Financing live
Cash to close
- Down payment
- $44,716
- Closing costs
- $5,366
- Reserves months
- —
- Total cash needed
- —
Loan-product check · same deal, 3 products live
Conventional
25% down · 7.5% · 30yr
- Down + closing
- —
- Monthly P&I
- —
- Monthly cashflow
- —
- DSCR
- —
- Eligible?
- —
Personal DTI + credit; lowest rate.
DSCR
20% down · 8.5% · 30yr
- Down + closing
- —
- Monthly P&I
- —
- Monthly cashflow
- —
- DSCR
- —
- Eligible?
- —
No personal income docs; deal must DSCR.
Hard money
10% down · 12.0% · 12mo
- Down + closing
- —
- Monthly P&I
- —
- Monthly cashflow
- —
- DSCR
- —
- Eligible?
- —
Short-term bridge; refi at stabilization.
Listing history 17 events
-
2026-06-19days on market $1 Active 28 DOM
-
2026-06-18days on market $1 Active 27 DOM
-
2026-06-17days on market $1 Active 26 DOM
-
2026-06-17remarks 575-char remark
-
2026-06-16days on market $1 Active 25 DOM
-
2026-06-15days on market $1 Active 24 DOM
-
2026-06-14days on market $1 Active 22 DOM
-
2026-06-12days on market $1 Active 21 DOM
-
2026-06-09days on market $1 Active 18 DOM
-
2026-06-08days on market $1 Active 17 DOM
-
2026-06-07days on market $1 Active 16 DOM
-
2026-06-03days on market $1 Active 12 DOM
-
2026-06-02days on market $1 Active 11 DOM
-
2026-06-01days on market $1 Active 10 DOM
-
2026-05-31days on market $1 Active 9 DOM
-
2026-05-30days on market $1 Active 8 DOM
-
2026-05-21$1 Active
ⓘ Source: listings_history table (triggers on properties + properties_extension) + one-shot
backfill from property_details.listing_events for pre-trigger history.
Climate risk First Street
- Flood 7/10 Severe FEMA zone AE · 77% chance over 30 yrs
- Wildfire 3/10 Moderate
- Heat 3/10 Moderate 8 d/yr ≥92°F today · 23 d/yr by 30 yrs out
- Wind 2/10 Low
- Air quality 1/10 Low 0 unhealthy d/yr today · 0 by 30 yrs out
Nearby sold comps map
Loading sold comps map…
Walkable amenities ~0.75 mi
Loading nearby amenities…
Taxation est. · year 1
- Rental income
- $15,060
- − Mortgage interest
- −$10,019
- − Property taxes
- −$2,683
- − Insurance
- −$6,419
- − Repairs & maintenance
- −$1,205
- − Management
- −$1,205
- − Depreciation
- −$5,203
- Taxable loss
- −$11,675
- Est. tax savings @ 24.0%
- +$2,802
- After-tax cash flow
- $-5,659/yr
For passive investors: Depreciation is non-cash, so a rental often shows a tax loss while cash-flowing — sheltering income. Rental losses are passive: they offset passive income freely, and up to $25,000/yr can offset ordinary (W-2) income if you actively participate and your MAGI is under $100k (phasing out to $0 by $150k); unused losses carry forward. On sale, claimed depreciation is recaptured at up to 25%, and gains may owe capital-gains tax (a 1031 exchange can defer both). Figures are a year-1 estimate at your 24.0% rate — not tax advice; consult a CPA.
Schools (NCES district)
- District
- Tazewell County Public School District
- NCES district ID
- 5103810
- Math proficiency
- 67% ▼ -23.00%
- Reading proficiency
- 78% ▼ -6.00%
- Median HH income
- $37,003
- Composite
- 60.16/100
- National rank
- #865
- State rank
- #21 of 131 in VA
Livability — Richlands
- Score
- 66/100
- State rank
- #314
- US rank
- #11229
Category grades
Schools grade is shown separately in the Schools card above.
Census & demographics
- Census place
- Richlands, VA
- Population (ZIP)
- 5,417
Population outlook (Tazewell County) Hauer SSP2
- Today (2025)
- 38,275 people
- By 2030
- 35,719 · -6.7%
- By 2040
- 30,875 · -19.3%
- By 2050
- 26,798 · -30.0%
- By 2075
- 19,286 · -49.6%
- By 2100
- 13,631 · -64.4%
Race, ethnicity, and origin ACS 2023
- Neighborhood character
- Predominantly White (98%)
- Race & ethnicity
- White 98% Asian 2%
- Common ancestry
- Serbian 1% Italian 1%
- Foreign-born
- 1%
- Languages at home
- 98% English-only · Other Indo-European 1%
Political lean MEDSL · Tazewell
- 2024 margin
- Solid R (+68.9) · D 15.3% · R 84.2%
- 2008→2024 swing
- -36.0pp toward R · 2008: -32.9pp · 2024: -68.9pp
- All cycles
- 2024: R+68.9 2020: R+67.2 2016: R+66.3 2012: R+57.5 2008: R+32.9
Not yet ingested
- Civics
- —
Market trends
- HPI YoY
- ▼ -1.87%
- Current HPI
- 141.9823
- Rent YoY
- —
- Metro
- —
- State GDP YoY
- ▲ 2.40%
- F500 in state
- 50
Industry mix (Fortune 500 HQ in VA)
| Industry | F500 HQs | Revenue |
|---|---|---|
| Aerospace / Defense | 4 | $236B |
|
||
| Technology / Defense | 3 | $32B |
|
||
| Financial Services | 2 | $176B |
|
||
| Utilities | 2 | $27B |
|
||
| Insurance | 2 | $25B |
|
||
| Technology | 2 | $15B |
|
||
Property tax history
+4.3%/yrLatest (2025): $545 · +0.0% YoY. Source: county tax records.
Cash-flow waterfall
monthlySold comps — $/sqft
last 12 mo · ≤1 miLoading sold comps…