 🏷️ Likely Rental
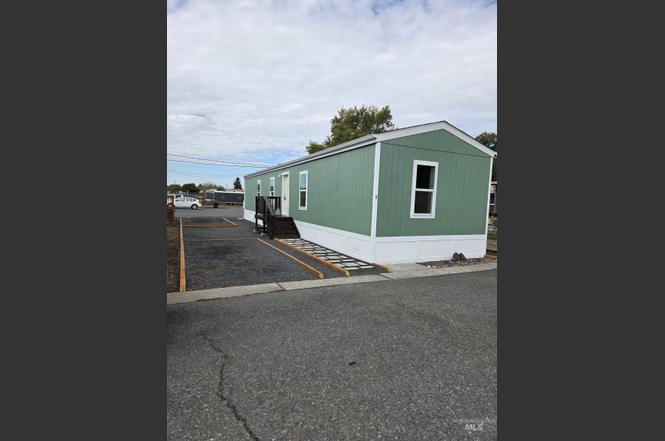
928 Warner Ave #8 · Lewiston, ID
Flood risk 1/10 · Minimal
- FEMA flood zone
- —
- Chance of flooding over 30 yrs
- 0.0%
- Est. flood insurance / yr
- —
Fire risk 5/10 · Moderate
- Est. fire insurance / yr
- $584 – $1,086
Heat risk 4/10 · Minor
- Hot days now (above 98°F)
- 6 days/yr
- Hot days in 30 yrs
- 13 days/yr
Wind risk 1/10 · Minimal
- Chance of severe wind over 30 yrs
- —
Air-quality risk 8/10 · Major
- Unhealthy air days now
- 12 days/yr
- Unhealthy air days in 30 yrs
- 18 days/yr
Risk factors via First Street. Map © Google.
Why this score? — see what drove the C- grade
The composite is a weighted blend of 9 inputs, each scored 0–100. Each bar is that input's sub-score; the figure is the points it added to the 100-point composite (weight × sub-score).
- Cash flow +18.8/30.0
- ARV discount +7.5/15.0
- DSCR +5.9/10.0
- 1% rule +5.0/10.0
- Schools +4.2/10.0
- Livability +3.8/5.0
- Rent growth +2.5/5.0
- Condition / age +2.5/5.0
- Appreciation +0.0/10.0
$99,999
🖨 Deal sheet 📄 Offer letter ✓ Due diligence
Listing remarks
This is your opportunity to own a brand new Fleetwood home in a nice community park. This 3 bedroom, 2 bathroom home is all set up and ready for you to move right in. The appliances are all new and the home even includes a washer and dryer! Your lot has two parking spots and easy access from the front and back doors. The colors in the home are neutral and ready for you to add your decorative touches. Lot rent is $620 per month and there is also a $52 per month sewer fee. Buyer must be approved by park management.
Key facts
- Easy access
- Washer and dryer
- New appliances
Tags
Property features AI
Exterior
- Parking: Carport with 2 covered spaces (total 2 parking spaces)
- Utilities: City water service; Sewer connected
- Home design: Mobile/manufactured home on a rented lot; New construction (built 2025)
- Construction: Composition roof; Year built 2025
- Exterior features: Composition roof; Located in a mobile home park
Interior
- Kitchen: Dishwasher; Oven/Range (freestanding); Refrigerator
- Bedrooms: 3 bedrooms, all on the main level
- Flooring: Vinyl
- Bathrooms: 2 bathrooms
- Heating & cooling: Electric forced-air heating; Wall/window air conditioning unit(s)
- Interior features: Master bedroom on main level; Walk-in closet(s); Breakfast bar; Laminate counters
- Laundry & utility: Electric water heater
Neighborhood map
What this means for you Summary
Snapshot
- This is a 2-bed/1.0-bath single-family listed at $100k.
Deal economics
- At list price, monthly cash flow is $100 ($1k/yr) — positive.
- The deal already cash-flows at list — no discount required.
- Meets the 1% rule at list price ($1k rent vs $100k).
- Recommended offer: $88k (12.0% below list) — sets the bar for market timing.
- Cap rate 7.5% vs local median 1.9% in Lewiston — top-decile yield for the area; either an underpriced asset or a hidden risk that comps aren't pricing in. Stress-test before assuming the spread holds.
Location & tenants
- Location reads 75/100 on livability (#30 in ID, #4,281 nationally) — a middle-class / working-renter tenant base. Strengths: housing A+, health & safety A+, cost of living A; Watch: amenities F, commute F.
- Lewiston Independent District (urban): math 44% / reading 54% proficiency, ranked #37 of 92 in ID (top 40%) — families likely to look elsewhere, expect single-tenant / working-renter base with shorter leases.
- Zoned schools: Mcghee Elementary School (math 37% / reading 52%, grade F, #199 of 357 statewide, top 59%, 257 students, 48% FRL); Lewiston High School (math 37% / reading 63%, grade D+, #39 of 169 statewide, top 23%, 1,373 students, 17% FRL) — zoned schools at 32% FRL track the district average.
- Market conditions: 272 active listings in the ZIP; 1 comparable units currently listed for rent nearby; 125 units permitted in Nez Perce County in 2024 (0 in 5+ unit buildings).
- This rent is only 16% of the median local income ($74k/yr) — well below the 30% rent-burden line; pricing power to push rent on renewal without tenant pushback.
Forward outlook
- Local home prices are declining (-3.0%/yr); year-one equity from $691 of loan paydown is wiped out by about $3k of value loss. Plan a longer hold.
- Nez Perce County population projected at +12% by 2050 — modest demand growth; plan on rents tracking national, not racing it.
Negotiation context
- It's been on market 254 days — a 12% lower offer ($88k) is reasonable based on typical stale-listing flexibility.
Risks & watch-outs
- Climate carrying-cost: moderate wildfire risk — expect insurance premiums to compound above CPI over the hold.
Questions for the listing agent
- It's been on market 254 days. Have you received any prior offers? Is the seller open to a 12% concession, seller financing, or rate buy-down credit?
- Why hasn't it sold? Are there any deal-killer items the seller is aware of (foundation, flood, title, zoning, code violations)?
- Is there a deadline driving the sale (1031 exchange, divorce, estate, relocation)? That informs how much negotiation room exists.
- What's the average days-on-market for RENTAL listings here right now (not sales)? A rising rental-DOM trend means longer vacancies and softer asking-rent achievability than the comps imply.
- What's the recent tenant-quality profile in this submarket — average credit score on applications, eviction rate, late-payment / NSF rate, and stable-employment percentage? A property-management company in the area should have these aggregated.
- How much new for-sale + rental construction is in the pipeline within 1–3 miles? Heavy new supply typically softens prices + rents 12–24 months out; constrained supply supports both.
Investment metrics
- 1% rule
- 1.00% ✓
- Cap rate
- 7.50%
- Cash-on-cash
- 4.30%
- DSCR
- 1.19
- GRM
- 8.3
CMA / ARV
- ARV (on-the-fly)
- $283,008
- Comps found
- 8
Show comp detail 8 sales within ~0.75 mi
| Address | Dist | Beds/Ba | Sqft | Sold | Price | $/sf | Match |
|---|---|---|---|---|---|---|---|
| 3127 8th St | 0.56mi | 2/1.0 | 802 (-0%) | 12mo | $285,000 | $355 | 64 |
| 810 Park Ave | 0.41mi | 2/1.0 | 866 (+8%) | 6mo | $339,500 | $392 | 63 |
| 3309 1/2 11th St | 0.39mi | 2/1.0 | 840 (+4%) | 23mo | $240,000 | $286 | 55 |
| 3311 11th St | 0.33mi | 2/1.0 | 880 (+10%) | 21mo | $269,900 | $307 | 51 |
| 819 Warner Ave | 0.30mi | 2/1.0 | 708 (-12%) | 19mo | $294,900 | $417 | 50 |
| 3127 7th St C | 0.68mi | 2/1.0 | 884 (+10%) | 6mo | $269,000 | $304 | 46 |
| 828 Airway Ave | 0.40mi | 2/1.0 | 896 (+11%) | 20mo | $139,900 | $156 | 46 |
| 3531 11th St D | 0.73mi | 2/1.0 | 894 (+11%) | 7mo | $315,000 | $352 | 42 |
Match score weights: distance 35% · size 25% · config 20% · recency 20%. Top-matched comps best support the ARV.
Projected returns pro-forma
-3.0% appreciation · 3.0% rent growth · sell at horizon
- IRR
- -9.6%
- Equity multiple
- 0.65×
- Total profit
- $-9,805
- Equity at exit
- $14,910
- IRR
- -0.1%
- Equity multiple
- 0.99×
- Total profit
- $-255
- Equity at exit
- $8,646
Cash invested: $28,000 (down + closing). Projections, not guarantees.
Landlord ↔ Tenant lean methodology
- Overall (STATE)
- 91 Strongly Landlord-Friendly
- State Idaho
- 91 Strongly Landlord-Friendly · R+18
- County
- — inherits STATE
- City
- — inherits STATE
ZIP-level market 83501
- Active inventory
- 272
- Price-to-rent
- 8.3×
Monthly cashflow live
- Estimated rent
- $1,002 medium interval (Pro) →
- Mortgage (P&I)
- −$524
- Tax est. 1.5%
- −$125 /mo · $1,500/yr
- Insurance
- −$42
- HOA
- −$0
- Vacancy / Maint / Mgmt
- −$210
- Net cashflow
- $100
Break-even live
UW: 25.0% down · 7.5% · 30yr · 1.5% tax · 5.0% vac · 8.0% maint · 8.0% mgmt
Financing live
Cash to close
- Down payment
- $25,000
- Closing costs
- $3,000
- Reserves months
- —
- Total cash needed
- —
Loan-product check · same deal, 3 products live
Conventional
25% down · 7.5% · 30yr
- Down + closing
- —
- Monthly P&I
- —
- Monthly cashflow
- —
- DSCR
- —
- Eligible?
- —
Personal DTI + credit; lowest rate.
DSCR
20% down · 8.5% · 30yr
- Down + closing
- —
- Monthly P&I
- —
- Monthly cashflow
- —
- DSCR
- —
- Eligible?
- —
No personal income docs; deal must DSCR.
Hard money
10% down · 12.0% · 12mo
- Down + closing
- —
- Monthly P&I
- —
- Monthly cashflow
- —
- DSCR
- —
- Eligible?
- —
Short-term bridge; refi at stabilization.
Rent comps 1 comps
| Address | Beds | Baths | Sqft | Rent | $/sqft | DOM | Units | Dist |
|---|---|---|---|---|---|---|---|---|
| 2937 Magnolia St Lewiston, ID | 2.0 | 1.0 | 893 | $1,018 | $1.14 | 43d | 1 | 0.82mi |
Listing history 17 events
-
2026-06-19days on market $99,999 Active 254 DOM
-
2026-06-18days on market $99,999 Active 253 DOM
-
2026-06-17days on market $99,999 Active 252 DOM
-
2026-06-16days on market $99,999 Active 251 DOM
-
2026-06-15days on market $99,999 Active 250 DOM
-
2026-06-14days on market $99,999 Active 248 DOM
-
2026-06-12days on market $99,999 Active 247 DOM
-
2026-06-09days on market $99,999 Active 244 DOM
-
2026-06-08days on market $99,999 Active 243 DOM
-
2026-06-07days on market $99,999 Active 242 DOM
-
2026-06-03days on market $99,999 Active 238 DOM
-
2026-06-02days on market $99,999 Active 237 DOM
-
2026-06-01days on market $99,999 Active 236 DOM
-
2026-05-31days on market $99,999 Active 235 DOM
-
2026-05-30pricedays on market $99,999 Active 234 DOM
-
2026-02-10price $104,999
-
2025-10-08$109,900 Active
ⓘ Source: listings_history table (triggers on properties + properties_extension) + one-shot
backfill from property_details.listing_events for pre-trigger history.
Climate risk First Street
- Flood 1/10 Low 0% chance over 30 yrs
- Wildfire 5/10 Major
- Heat 4/10 Moderate 6 d/yr ≥98°F today · 13 d/yr by 30 yrs out
- Wind 1/10 Low
- Air quality 8/10 Severe 12 unhealthy d/yr today · 18 by 30 yrs out
Nearby sold comps map
Loading sold comps map…
Walkable amenities ~0.75 mi
Loading nearby amenities…
Taxation est. · year 1
- Rental income
- $12,020
- − Mortgage interest
- −$5,601
- − Property taxes
- −$1,500
- − Insurance
- −$500
- − Repairs & maintenance
- −$962
- − Management
- −$962
- − Depreciation
- −$2,909
- Taxable loss
- −$414
- Est. tax savings @ 24.0%
- +$99
- After-tax cash flow
- $1,302/yr
For passive investors: Depreciation is non-cash, so a rental often shows a tax loss while cash-flowing — sheltering income. Rental losses are passive: they offset passive income freely, and up to $25,000/yr can offset ordinary (W-2) income if you actively participate and your MAGI is under $100k (phasing out to $0 by $150k); unused losses carry forward. On sale, claimed depreciation is recaptured at up to 25%, and gains may owe capital-gains tax (a 1031 exchange can defer both). Figures are a year-1 estimate at your 24.0% rate — not tax advice; consult a CPA.
Schools (NCES district)
- District
- Lewiston Independent District
- NCES district ID
- 1601860
- Math proficiency
- 44% ▬ 0.00%
- Reading proficiency
- 54% ▬ 0.00%
- Median HH income
- $47,224
- Composite
- 41.65/100
- National rank
- #3423
- State rank
- #37 of 92 in ID
Livability — Lewiston
- Score
- 75/100
- State rank
- #30
- US rank
- #4281
Category grades
Schools grade is shown separately in the Schools card above.
Census & demographics
- Census place
- Lewiston, ID
- County
- Nez Perce County · 37,520 people
- City population
- 37,520
- Metro
- Lewiston, ID-WA
- Population (ZIP)
- 37,520
- Household income
- $73,629
- Rent vs Own
- Severe rent burden
- 976.0
Population outlook (Nez Perce County) Hauer SSP2
- Today (2025)
- 42,583 people
- By 2030
- 43,754 · +2.7%
- By 2040
- 45,907 · +7.8%
- By 2050
- 47,819 · +12.3%
- By 2075
- 53,100 · +24.7%
- By 2100
- 55,971 · +31.4%
Race, ethnicity, and origin ACS 2023
- Neighborhood character
- Predominantly White (89%)
- Race & ethnicity
- White 89% Two or more races 5% Hispanic / Latino 5% Native American 2%
- Common ancestry
- Portuguese 6% Slovak 3% Lithuanian 3%
- Foreign-born
- 2% · Canada
- Languages at home
- 97% English-only · Spanish 2%
Political lean MEDSL · Nez Perce
- 2024 margin
- Solid R (+38.6) · D 29.4% · R 68.1% · Other 2.5%
- 2008→2024 swing
- -20.5pp toward R · 2008: -18.1pp · 2024: -38.6pp
- All cycles
- 2024: R+38.6 2020: R+33.6 2016: R+34.1 2012: R+20.9 2008: R+18.1
Not yet ingested
- Civics
- —
Market trends
- HPI YoY
- ▼ -352.77%
- Current HPI
- 229.4958
- Rent YoY
- —
- Metro
- Lewiston, ID-WA
- State GDP YoY
- ▲ 4.51%
- F500 in state
- 6
Industry mix (Fortune 500 HQ in ID)
| Industry | F500 HQs | Revenue |
|---|---|---|
| Retail | 1 | $79B |
|
||
| Technology | 1 | $25B |
|
||
| Food / Agriculture | 1 | $6B |
|
||
Price history
-4.5% since first listed2 events — show timeline
- 2026-02-10 Price Changed $104,999 IMLS
- 2025-10-08 Listed $109,900 IMLS
Property tax history
+7.5%/yrLatest (2019): $80 · +12.4% YoY. Source: county tax records.
Cash-flow waterfall
monthlySold comps — $/sqft
last 12 mo · ≤1 miLoading sold comps…