 5-Plex
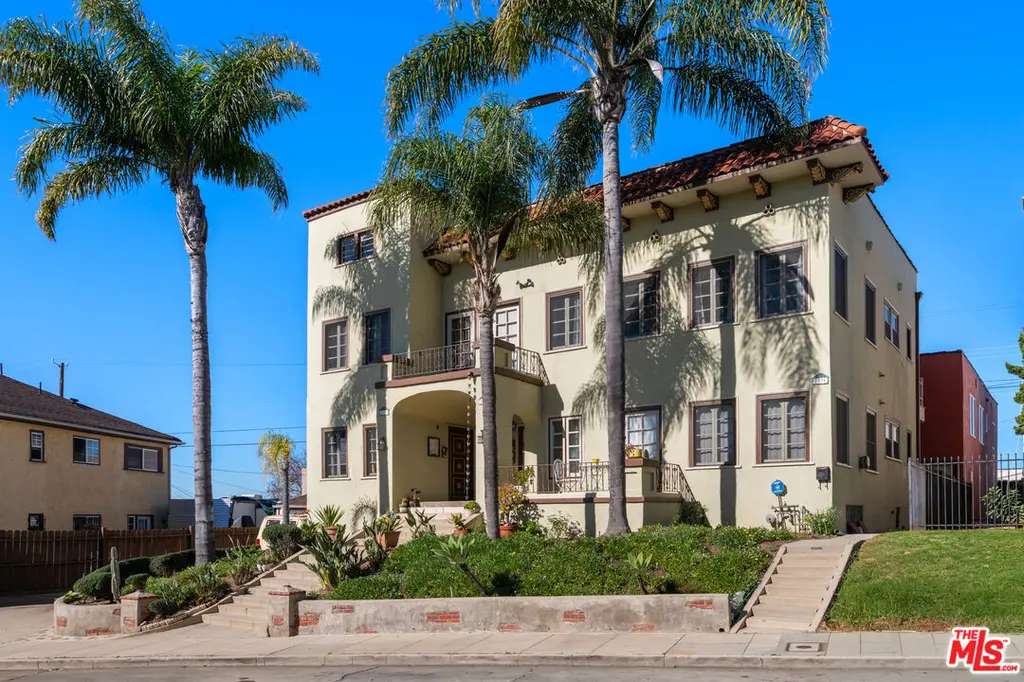
2331 Lucerne Ave · Los Angeles, CA
Flood risk 1/10 · Minimal
- FEMA flood zone
- X (unshaded)
- Chance of flooding over 30 yrs
- 0.0%
- Est. flood insurance / yr
- $507 – $1,088
Fire risk 1/10 · Minimal
- Est. fire insurance / yr
- $659 – $1,223
Heat risk 6/10 · Moderate
- Hot days now (above 89°F)
- 7 days/yr
- Hot days in 30 yrs
- 21 days/yr
Wind risk 1/10 · Minimal
- Chance of severe wind over 30 yrs
- —
Air-quality risk 5/10 · Moderate
- Unhealthy air days now
- 7 days/yr
- Unhealthy air days in 30 yrs
- 7 days/yr
Risk factors via First Street. Map © Google.
Why this score? — see what drove the B- grade
The composite is a weighted blend of 9 inputs, each scored 0–100. Each bar is that input's sub-score; the figure is the points it added to the 100-point composite (weight × sub-score).
- Cash flow +30.0/30.0
- DSCR +10.0/10.0
- 1% rule +7.4/10.0
- ARV discount +5.7/15.0
- Schools +3.6/10.0
- Livability +3.4/5.0
- Rent growth +2.8/5.0
- Condition / age +2.5/5.0
- Appreciation +0.0/10.0
$1,625,000
🖨 Deal sheet 📄 Offer letter ✓ Due diligence
Multi-family units
County records classify this as Multi-Family (5+ Unit). Listing-text estimate: 5 units. confirmed
5+ unit building — per-unit beds/baths from public records are typically unavailable; the breakdown below (if shown) is an estimate from the listing text.
Listing remarks MLS
BEST VALUE IN MID CITY! Welcome to Lucerne tower! A five unit, 1920's Italianate Arts & Crafts architectural multifamily apartment building with multiple live/ loft/ work accessory unit potential. Centrally located, within the urban vibrancy of Mid City Heights/West Adams district. Officially designated an "Urbanized, Transit Priority Area" (TPA), the property is strategically positioned in the most appealing centre of high growth areas from Downtown L. A. to Culver City's Tech Hub, the neighbourhood is experiencing a rapid growth of multifamily development. Lucerne Tower sits within recently funded city infrastructure installations including (2) Metro lines to USC , LAX, Downtown, Westside Beaches, and walkability to the "Washington Corridor" & Artist District featuring trending coffee venue destinations and art galleries. All units have been master-crafted, millwork restored and adequately sized [potential reconfigure] with hi-cove ceilings, separate dining areas, sconced parlors and Batchelder fireplace mantles. Bathrooms feature wainscoted tile, pedestal sinks, and deep 1920s Kohler tubs in all units. All units retain individual laundry rooms with 125 amp electric service, copper plumbing with no expense spared on the structural assets. The property sits atop an apex of unobstructed, Los Angeles citywide views. Here you will find the "hero tower" unit with a separate 12'x12' creative space, 360' panoramic rooftop views and balconies perched over the Mediterranean landscape's 25 ft palm trees. The rear loft apartment sits stand alone over (4) additional artist shops or studio workplaces adding a unique flex-space potential [buyer to verify with city]. The property can be versatile for an owner-user/creative that wants to have onsite work -loft studio space or any professional/investor.
Key facts
- Hi-cove ceilings
- Pedestal sinks
- Sconced parlors
Tags
Neighborhood map
What this means for you Summary
Snapshot
- This is a 5 × 5-bed/5.0-bath units multifamily listed at $1.62M.
Deal economics
- At list price, monthly cash flow is $6k ($74k/yr) — positive. Per door: $1k/mo.
- The deal already cash-flows at list — no discount required.
- Meets the 1% rule at list price ($20k rent vs $1.62M).
- Recommended offer: $1.43M (12.0% below list) — sets the bar for market timing.
- Cap rate 10.9% vs local median 2.1% in Los Angeles — top-decile yield for the area; either an underpriced asset or a hidden risk that comps aren't pricing in. Stress-test before assuming the spread holds.
Location & tenants
- Location reads 68/100 on livability (#273 in CA) — a middle-class / working-renter tenant base. Strengths: amenities A+, commute A+, employment B; Watch: health & safety C-, schools D+, crime F.
- Los Angeles Unified (urban): math 29% / reading 54% proficiency, ranked #223 of 517 in CA (top 43%) — families likely to look elsewhere, expect single-tenant / working-renter base with shorter leases; 67% free/reduced lunch — lower-income household profile, screen leases tightly.
- Market conditions: Rents rising (+1.1%/yr); 149 active listings in the ZIP; 5 comparable units currently listed for rent nearby; rentals lingering (median 44d on market — plan ~5-8 weeks vacancy on turnover, expect pricing pressure); 60% of comp listings sitting > 30 days — soft ceiling on asking rent; 19,697 units permitted in Los Angeles County in 2024 (9,426 in 5+ unit buildings).
- At $20,184/mo this rent would consume 329% of the median local household income ($74k/yr) (locally 3450% of renters already pay >50% of income on rent) — very limited rent-growth headroom before tenants either downsize or default.
Forward outlook
- Local home prices are declining (-3.0%/yr); year-one equity from $11k of loan paydown is wiped out by about $49k of value loss. Plan a longer hold.
- Los Angeles County population projected at +9% by 2050 — modest demand growth; plan on rents tracking national, not racing it.
- At projected returns (-3.0% appreciation + 1.1% rent growth), your $455k cash investment doubles in ~9 years — after that, you're playing with house money.
Negotiation context
- It's been on market 154 days — a 12% lower offer ($1.43M) is reasonable based on typical stale-listing flexibility.
- 4 sale attempts since 25y ago with the ask held roughly flat each time — persistent listings suggest the price (not the market) is what's stuck; bring a comps-based counter.
- Current owner paid $321k; list at $1.62M implies a 406% gain — meaningful room to come down on a strong offer.
Risks & watch-outs
- Watch-outs: built in 1924 — expect roof / HVAC / electrical / plumbing capex.
- Climate carrying-cost: extreme-heat days projected 7→21/yr by 2055 (HVAC capex compounding) — expect insurance premiums to compound above CPI over the hold.
Questions for the listing agent
- It's been on market 154 days. Have you received any prior offers? Is the seller open to a 12% concession, seller financing, or rate buy-down credit?
- Can we see the unit-by-unit rent roll, current vacancy, and any below-market leases? What's the average tenancy length?
- What capital expenditures (roof, boiler, parking lot, exteriors) have been made in the last 5 years, and what's planned in the next 2?
- Built in 1924 — when were the roof, HVAC, electrical panel, plumbing, and water heater last replaced?
- Why hasn't it sold? Are there any deal-killer items the seller is aware of (foundation, flood, title, zoning, code violations)?
- Is there a deadline driving the sale (1031 exchange, divorce, estate, relocation)? That informs how much negotiation room exists.
- Schools are D-rated, which usually means shorter tenancies and higher turnover. Who's the typical renter profile here, and what's been the actual vacancy rate?
- Crime grade is F in this area — have there been break-ins, vandalism, or insurance claims at this property in the last 3 years? What carrier currently insures it and at what premium?
- What's the average days-on-market for RENTAL listings here right now (not sales)? A rising rental-DOM trend means longer vacancies and softer asking-rent achievability than the comps imply.
- What's the recent tenant-quality profile in this submarket — average credit score on applications, eviction rate, late-payment / NSF rate, and stable-employment percentage? A property-management company in the area should have these aggregated.
- How much new apartment / multifamily construction is in the pipeline within 1–3 miles? Heavy new supply (>2% of stock underway) typically softens rents 12–24 months out; light construction supports rent growth.
Investment metrics
- 1% rule
- 1.24% ✓
- Cap rate
- 10.86%
- Cash-on-cash
- 16.32%
- DSCR
- 1.73
- GRM
- 6.7
CMA / ARV
- ARV (median comp)
- $1,561,876
- List price
- $1,625,000
- Delta
- 4.04%
- Verdict
- FAIR
- Comps
- 20 within 1.0 mi
Projected returns pro-forma
-3.0% appreciation · 1.12% rent growth · sell at horizon
- IRR
- 5.4%
- Equity multiple
- 1.20×
- Total profit
- $92,785
- Equity at exit
- $242,293
- IRR
- 13.1%
- Equity multiple
- 1.96×
- Total profit
- $437,836
- Equity at exit
- $140,500
Cash invested: $455,000 (down + closing). Projections, not guarantees.
Landlord ↔ Tenant lean methodology
- Overall (CITY)
- 0 Strongly Tenant-Friendly
- State California
- 18 Strongly Tenant-Friendly · D+13
- County
- — inherits STATE
- City Los Angeles
- 0 Strongly Tenant-Friendly · D+22
ZIP-level market 90016
- Rents YoY
- 1.1%
- Active inventory
- 149
- Price-to-rent
- 33.5×
Monthly cashflow live
- Estimated rent
- $20,184 medium interval (Pro) →
- Mortgage (P&I)
- −$8,522
- Tax from tax record
- −$558 /mo · $6,690/yr
- Insurance
- −$677
- HOA
- −$0
- Vacancy / Maint / Mgmt
- −$4,239
- Net cashflow
- $6,189
Break-even live
5-unit breakdown (identical units grouped — click to expand)
| Units | Beds | Baths | Est. rent |
|---|---|---|---|
| 5× units | 5 | 5 | $20,185 |
| #1 | 5 | 5 | $4,037 |
| #2 | 5 | 5 | $4,037 |
| #3 | 5 | 5 | $4,037 |
| #4 | 5 | 5 | $4,037 |
| #5 | 5 | 5 | $4,037 |
| Total (5 units) | $20,184 | ||
UW: 25.0% down · 7.5% · 30yr · 1.5% tax · 5.0% vac · 8.0% maint · 8.0% mgmt
Financing live
Cash to close
- Down payment
- $406,250
- Closing costs
- $48,750
- Reserves months
- —
- Total cash needed
- —
Loan-product check · same deal, 3 products live
Conventional
25% down · 7.5% · 30yr
- Down + closing
- —
- Monthly P&I
- —
- Monthly cashflow
- —
- DSCR
- —
- Eligible?
- —
Personal DTI + credit; lowest rate.
DSCR
20% down · 8.5% · 30yr
- Down + closing
- —
- Monthly P&I
- —
- Monthly cashflow
- —
- DSCR
- —
- Eligible?
- —
No personal income docs; deal must DSCR.
Hard money
10% down · 12.0% · 12mo
- Down + closing
- —
- Monthly P&I
- —
- Monthly cashflow
- —
- DSCR
- —
- Eligible?
- —
Short-term bridge; refi at stabilization.
Rent comps 5 comps
| Address | Beds | Baths | Sqft | Rent | $/sqft | DOM | Units | Dist |
|---|---|---|---|---|---|---|---|---|
| 1801 Buckingham Rd Los Angeles, CA | 3.0 | 3.5 | 3977 | $15,000 | $3.77 | 14d | 1 | 0.56mi |
| 1555 6th Ave Unit 1/2 Los Angeles, CA | 2.0 | 1.0 | 4690 | $2,900 | $0.62 | 43d | 1 | 1.17mi |
| 1185 S Tremaine Ave Los Angeles, CA | 2.0 | 1.0 | 2744 | $4,500 | $1.64 | 21d | 1 | 1.20mi |
| 1117 Queen Anne Pl Los Angeles, CA | 2.0 | 1.0 | 5358 | $2,600 | $0.49 | 43d | 1 | 1.38mi |
| 1014 Meadowbrook Ave Los Angeles, CA | 3.0 | 3.0 | 3514 | $5,200 | $1.48 | 43d | 1 | 1.45mi |
Listing history 24 events
-
2026-06-18days on market $1,625,000 Active 154 DOM
-
2026-06-17days on market $1,625,000 Active 153 DOM
-
2026-06-16days on market $1,625,000 Active 152 DOM
-
2026-06-15days on market $1,625,000 Active 151 DOM
-
2026-06-13days on market $1,625,000 Active 149 DOM
-
2026-06-09days on market $1,625,000 Active 145 DOM
-
2026-06-08days on market $1,625,000 Active 144 DOM
-
2026-06-07days on market $1,625,000 Active 143 DOM
-
2026-06-04days on market $1,625,000 Active 140 DOM
-
2026-06-03days on market $1,625,000 Active 139 DOM
-
2026-06-02days on market $1,625,000 Active 138 DOM
-
2026-06-01days on market $1,625,000 Active 137 DOM
-
2026-05-31days on market $1,625,000 Active 136 DOM
-
2026-01-15$1,625,000 Active 1863-char remark
Show marketing remark (1863 chars)
BEST VALUE IN MID CITY! Welcome to Lucerne tower! A five unit, 1920's Italianate Arts & Crafts architectural multifamily apartment building with multiple live/ loft/ work accessory unit potential. Centrally located, within the urban vibrancy of Mid City Heights/West Adams district. Officially designated an "Urbanized, Transit Priority Area" (TPA), the property is strategically positioned in the most appealing centre of high growth areas from Downtown L. A. to Culver City's Tech Hub, the neighbourhood is experiencing a rapid growth of multifamily development. Lucerne Tower sits within recently funded city infrastructure installations including (2) Metro lines to USC , LAX, Downtown, Westside Beaches, and walkability to the "Washington Corridor" & Artist District featuring trending coffee venue destinations and art galleries. All units have been master-crafted, millwork restored and adequately sized [potential reconfigure] with hi-cove ceilings, separate dining areas, sconced parlors and Batchelder fireplace mantles. Bathrooms feature wainscoted tile, pedestal sinks, and deep 1920s Kohler tubs in all units. All units retain individual laundry rooms with 125 amp electric service, copper plumbing with no expense spared on the structural assets. The property sits atop an apex of unobstructed, Los Angeles citywide views. Here you will find the "hero tower" unit with a separate 12'x12' creative space, 360' panoramic rooftop views and balconies perched over the Mediterranean landscape's 25 ft palm trees. The rear loft apartment sits stand alone over (4) additional artist shops or studio workplaces adding a unique flex-space potential [buyer to verify with city]. The property can be versatile for an owner-user/creative that wants to have onsite work -loft studio space or any professional/investor.
-
2025-09-02price
-
2025-08-08Active
-
2011-12-23historical Withdrawn
-
2011-03-18Active
-
2002-06-25soldstatus $321,000
-
2002-06-21soldstatus $321,000
-
2002-04-16historical
-
2001-12-20$320,000
-
1988-05-27soldstatus $200,000
-
1983-06-01soldstatus $152,500
ⓘ Source: listings_history table (triggers on properties + properties_extension) + one-shot
backfill from property_details.listing_events for pre-trigger history.
Tax reassessment forecast CA · Resets to sale price
- Current annual tax
- $6,690 · $558/mo
- Projected year-2 tax
- $12,350 · $1,029/mo
- Expected delta
- +$5,660/yr (+$472/mo · 84.6%)
ⓘ Screening estimate from a state-policy table — verify with the county assessor before closing.
Climate risk First Street
- Flood 1/10 Low FEMA zone X (unshaded) · 0% chance over 30 yrs
- Wildfire 1/10 Low
- Heat 6/10 Major 7 d/yr ≥89°F today · 21 d/yr by 30 yrs out
- Wind 1/10 Low
- Air quality 5/10 Major 7 unhealthy d/yr today · 7 by 30 yrs out
Nearby sold comps map
Loading sold comps map…
Walkable amenities ~0.75 mi
Loading nearby amenities…
Taxation est. · year 1
- Rental income
- $242,208
- − Mortgage interest
- −$91,025
- − Property taxes
- −$6,690
- − Insurance
- −$8,125
- − Repairs & maintenance
- −$19,377
- − Management
- −$19,377
- − Depreciation
- −$47,273
- Taxable income
- $50,341
- Est. tax owed @ 24.0%
- −$12,082
- After-tax cash flow
- $62,187/yr
For passive investors: Depreciation is non-cash, so a rental often shows a tax loss while cash-flowing — sheltering income. Rental losses are passive: they offset passive income freely, and up to $25,000/yr can offset ordinary (W-2) income if you actively participate and your MAGI is under $100k (phasing out to $0 by $150k); unused losses carry forward. On sale, claimed depreciation is recaptured at up to 25%, and gains may owe capital-gains tax (a 1031 exchange can defer both). Figures are a year-1 estimate at your 24.0% rate — not tax advice; consult a CPA.
Schools (NCES district)
- District
- Los Angeles Unified
- NCES district ID
- 0622710
- Math proficiency
- 29% ▼ -4.00%
- Reading proficiency
- 54% ▲ 10.00%
- Median HH income
- $50,403
- Composite
- 35.67/100
- National rank
- #4875
- State rank
- #223 of 517 in CA
Livability — Los Angeles
- Score
- 68/100
- State rank
- #273
- US rank
- #9237
Category grades
Schools grade is shown separately in the Schools card above.
Census & demographics
- Census place
- Los Angeles, CA
- County
- Los Angeles County · 9,444,647 people
- City population
- 3,838,149
- Metro
- Los Angeles-Long Beach-Anaheim, CA
- Population (ZIP)
- 46,457
- Household income
- $73,516
- Rent vs Own
- Severe rent burden
- 3450.0
Population outlook (Los Angeles County) Hauer SSP2
- Today (2025)
- 10,940,515 people
- By 2030
- 11,256,481 · +2.9%
- By 2040
- 11,729,929 · +7.2%
- By 2050
- 11,948,407 · +9.2%
- By 2075
- 11,818,114 · +8.0%
- By 2100
- 10,842,928 · -0.9%
Race, ethnicity, and origin ACS 2023
- Neighborhood character
- Diverse neighborhood (Simpson 0.64)
- Race & ethnicity
- Hispanic / Latino 52% Black 27% Two or more races 18% White 12% Asian 4%
- Hispanic origin (detail)
- Mexican 34%
- Common ancestry
- British 1% Scotch-Irish 1% Romanian 1%
- Foreign-born
- 30% · Canada, South Korea, China
- Languages at home
- 47% English-only · Spanish 47% French/Haitian/Cajun 1% Chinese 1%
Political lean MEDSL · Los Angeles
- 2024 margin
- Solid D (+32.9) · D 64.8% · R 31.9% · Other 3.3%
- 2008→2024 swing
- -7.4pp toward R · 2008: 40.4pp · 2024: 32.9pp
- All cycles
- 2024: D+32.9 2020: D+44.2 2016: D+48.0 2012: D+40.0 2008: D+40.4
Not yet ingested
- Civics
- —
Market trends
- HPI YoY
- ▼ -991.94%
- Current HPI
- 584.0673
- Rent YoY
- ▲ 1.12%
- Metro
- Los Angeles-Long Beach-Anaheim, CA
- State GDP YoY
- ▲ 3.21%
- F500 in state
- 116
Industry mix (Fortune 500 HQ in CA)
| Industry | F500 HQs | Revenue |
|---|---|---|
| Technology | 27 | $1,492B |
|
||
| Financial Services | 3 | $174B |
|
||
| Retail | 3 | $44B |
|
||
| Insurance | 3 | $26B |
|
||
| Media / Entertainment | 2 | $115B |
|
||
| Pharmaceuticals / Biotech | 2 | $62B |
|
||
Price history
+965.6% since first listed11 events — show timeline
- 2026-01-15 Listed $1,625,000 TheMLS
- 2025-09-02 Price Changed — TheMLS
- 2025-08-08 Listed — TheMLS
- 2011-12-23 Delisted — TheMLS
- 2011-03-18 Listed — TheMLS
- 2002-06-25 Sold (MLS) $321,000 TheMLS
- 2002-06-21 Sold (Public Records) $321,000 Public Records
- 2002-04-16 Delisted — TheMLS
- 2001-12-20 Listed $320,000 TheMLS
- 1988-05-27 Sold (Public Records) $200,000 Public Records
- 1983-06-01 Sold (Public Records) $152,500 Public Records
Property tax history
+1.7%/yrLatest (2025): $6,690 · +1.9% YoY. Source: county tax records.
Cash-flow waterfall
monthlySold comps — $/sqft
last 12 mo · ≤1 miLoading sold comps…