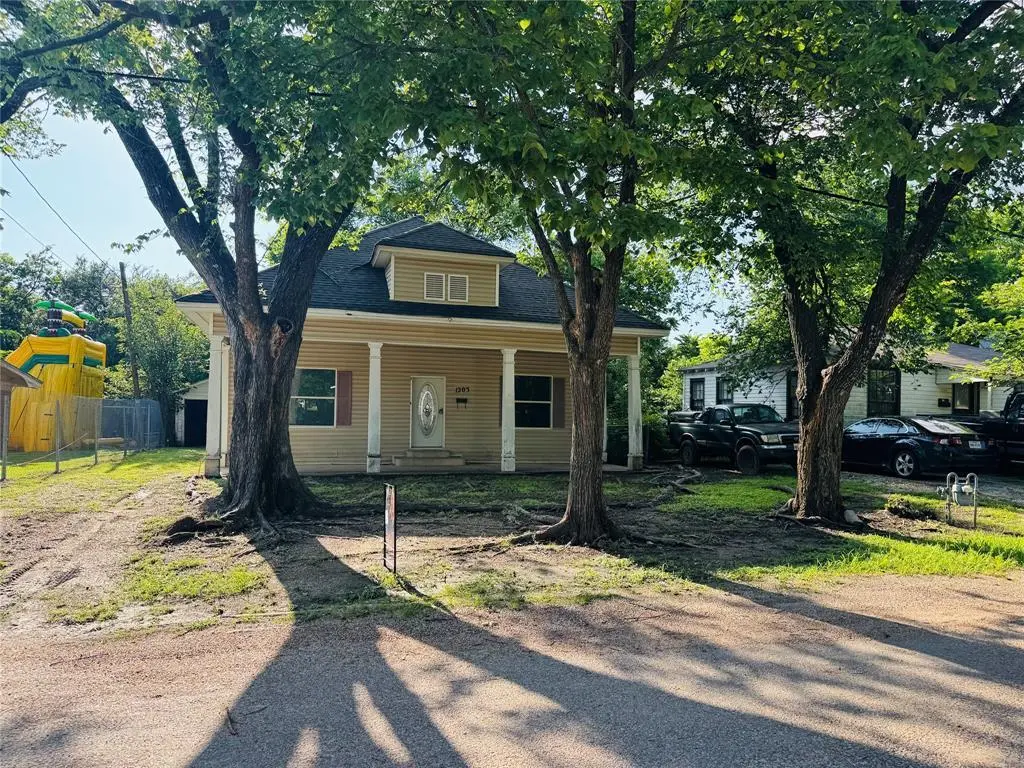
1203 Sewanee Dr · Marlin, TX
Flood risk 1/10 · Minimal
- FEMA flood zone
- X
- Chance of flooding over 30 yrs
- 0.0%
- Est. flood insurance / yr
- $507 – $1,088
Fire risk 3/10 · Minor
- Est. fire insurance / yr
- $1,222 – $2,270
Heat risk 7/10 · Major
- Hot days now (above 108°F)
- 7 days/yr
- Hot days in 30 yrs
- 22 days/yr
Wind risk 6/10 · Moderate
- Chance of severe wind over 30 yrs
- 70.0%
Air-quality risk 1/10 · Minimal
- Unhealthy air days now
- 0 days/yr
- Unhealthy air days in 30 yrs
- 0 days/yr
Risk factors via First Street. Map © Google.
Why this score? — see what drove the C grade
The composite is a weighted blend of 9 inputs, each scored 0–100. Each bar is that input's sub-score; the figure is the points it added to the 100-point composite (weight × sub-score).
- Cash flow +24.5/30.0
- DSCR +7.9/10.0
- Appreciation +7.1/10.0
- 1% rule +6.9/10.0
- Livability +3.0/5.0
- Rent growth +2.5/5.0
- Condition / age +2.5/5.0
- Schools +1.7/10.0
- ARV discount +0.0/15.0
$97,900
🖨 Deal sheet 📄 Offer letter ✓ Due diligence
Listing remarks
Investor Special – Fix & Flip or Buy-and-Hold Opportunity! Built in the 1950's, this property offers timeless colonial-style curb appeal with a gabled roofline, symmetrical windows, and a centered entry that creates a classic, balanced exterior. The extended front patio provides a great space for outdoor seating or entertaining. Inside, you’ll find high ceilings that enhance the sense of space, along with a living room featuring a traditional mantle and a formal dining area that flows into the kitchen. The kitchen is equipped to accommodate either gas or electric appliances, offering flexibility for future upgrades. The home includes two well-sized bedrooms, each with clo
Key facts
- Extended front patio
- Symmetrical windows
- Centered entry
Tags
Property features AI
Finance
- HOA & community: No homeowners association
Exterior
- Parking: 1 covered parking space; 1-car garage; On-street and off-street parking available; Garage faces front
- Utilities: City water; City sewer; Electricity available; Individual gas meter; Individual water meter
- Home design: Single-family residence; One level; Residential property
- Construction: Built in 1950; Siding exterior; Pillar/post/pier foundation; Composition/shingle roof
- Exterior features: Covered front porch; Covered patio; Back yard chain link fence
Interior
- Kitchen: Pantry
- Bedrooms: Primary bedroom (level 1) with ensuite bath — approx. 12 x 12
- Flooring: Hardwood; Laminate; Linoleum; Varied/other
- Bathrooms: 1 full bathroom
- Heating & cooling: Wall furnace heating; Ceiling fan(s) for cooling
- Interior features: Built-in features; Natural woodwork; Pantry; Vaulted ceiling(s); Plantation shutters
- Laundry & utility: Utility room; Washer hookup
Neighborhood map
What this means for you Summary
Snapshot
- This is a 2-bed/1.0-bath single-family listed at $98k.
Deal economics
- At list price, monthly cash flow is $200 ($2k/yr) — positive.
- The deal already cash-flows at list — no discount required.
- Meets the 1% rule at list price ($1k rent vs $98k).
- Recommended offer: $96k (1.5% below list) — sets the bar for market timing.
- Cap rate 8.7% vs local median 5.7% in Marlin — top-decile yield for the area; either an underpriced asset or a hidden risk that comps aren't pricing in. Stress-test before assuming the spread holds.
Location & tenants
- Location reads 59/100 on livability (#1,146 in TX) — a working-class tenant base; expect higher turnover. Strengths: cost of living A+, crime B+, housing B+; Watch: amenities F, commute F, employment F.
- Marlin ISD (town): math 21% / reading 22% proficiency, ranked #779 of 826 in TX (top 94%) — low school quality limits family demand, transient renter base, plan for 1-2y turnover; 84% free/reduced lunch — lower-income household profile, screen leases tightly.
- Zoned schools: Marlin El (math 22% / reading 27%, grade F, #3,052 of 4,322 statewide, top 74%, 474 students, 99% FRL) — zoned schools average 99% FRL vs 84% district-wide (16 pts higher); higher-poverty schools than district average — tighter screening recommended.
- Market conditions: 122 active listings in the ZIP; 4 units permitted in Falls County in 2024 (0 in 5+ unit buildings).
Forward outlook
- In year one you build about $5k of equity ($677 loan paydown + $4k appreciation (4.2% local appreciation)).
- Falls County population projected at -14% by 2050 — secular population decline; favor cash flow + early exit over multi-decade hold.
- At projected returns (4.2% appreciation + 3.0% rent growth), your $27k cash investment doubles in ~4 years — after that, you're playing with house money.
- By year 7, paydown + projected appreciation supports a ~$30k cash-out refi (75% LTV) — recoverable capital for the next deal without selling this one.
Negotiation context
- It's been on market 25 days — a 2% lower offer ($96k) is reasonable based on typical stale-listing flexibility.
- 3 sale attempts with the ask held roughly flat each time — persistent listings suggest the price (not the market) is what's stuck; bring a comps-based counter.
Risks & watch-outs
- Watch-outs: built in 1950 — expect roof / HVAC / electrical / plumbing capex.
- Climate carrying-cost: major wind risk, 70% chance of damaging wind over 30y; extreme-heat days projected 7→22/yr by 2055 (HVAC capex compounding) — expect insurance premiums to compound above CPI over the hold.
Questions for the listing agent
- Built in 1950 — when were the roof, HVAC, electrical panel, plumbing, and water heater last replaced?
- Is there a deadline driving the sale (1031 exchange, divorce, estate, relocation)? That informs how much negotiation room exists.
- Schools are F-rated, which usually means shorter tenancies and higher turnover. Who's the typical renter profile here, and what's been the actual vacancy rate?
- What's the average days-on-market for RENTAL listings here right now (not sales)? A rising rental-DOM trend means longer vacancies and softer asking-rent achievability than the comps imply.
- What's the recent tenant-quality profile in this submarket — average credit score on applications, eviction rate, late-payment / NSF rate, and stable-employment percentage? A property-management company in the area should have these aggregated.
- How much new for-sale + rental construction is in the pipeline within 1–3 miles? Heavy new supply typically softens prices + rents 12–24 months out; constrained supply supports both.
Investment metrics
- 1% rule
- 1.19% ✓
- Cap rate
- 8.74%
- Cash-on-cash
- 8.75%
- DSCR
- 1.39
- GRM
- 7.0
CMA / ARV
- ARV (on-the-fly)
- $66,600
- Comps found
- 7
Show comp detail 7 sales within ~0.75 mi
| Address | Dist | Beds/Ba | Sqft | Sold | Price | $/sf | Match |
|---|---|---|---|---|---|---|---|
| 206 Mistletoe Dr | 0.12mi | 2/1.0 | 1,250 (-6%) | 21mo | $115,000 | $92 | 67 |
| 729 Chilton St | 0.46mi | 2/1.0 | 1,367 (+3%) | 16mo | $50,000 | $37 | 61 |
| 234 Northridge Ln | 0.41mi | 3/2.0 (+1) | 1,376 (+3%) | 11mo | $68,900 | $50 | 57 |
| 300 W Anders St | 0.35mi | 3/2.0 (+1) | 1,392 (+4%) | 21mo | $139,900 | $101 | 50 |
| 214 Royal Dr | 0.42mi | 3/2.0 (+1) | 1,266 (-5%) | 17mo | $175,000 | $138 | 49 |
| 703 Chilton St | 0.54mi | 3/2.0 (+1) | 1,400 (+5%) | 12mo | $44,000 | $31 | 48 |
| 112 Shenandoah St | 0.18mi | 3/2.0 (+1) | 1,482 (+11%) | 21mo | $69,000 | $47 | 46 |
Match score weights: distance 35% · size 25% · config 20% · recency 20%. Top-matched comps best support the ARV.
Projected returns pro-forma
4.17% appreciation · 3.0% rent growth · sell at horizon
- IRR
- 18.5%
- Equity multiple
- 2.12×
- Total profit
- $30,763
- Equity at exit
- $50,615
- IRR
- 19.0%
- Equity multiple
- 4.08×
- Total profit
- $84,472
- Equity at exit
- $83,576
Cash invested: $27,412 (down + closing). Projections, not guarantees.
Landlord ↔ Tenant lean methodology
- Overall (STATE)
- 87 Strongly Landlord-Friendly
- State Texas
- 87 Strongly Landlord-Friendly · R+5
- County
- — inherits STATE
- City
- — inherits STATE
ZIP-level market 76661
- Home prices YoY
- 3.4%
- Active inventory
- 122
- Price-to-rent
- 7.0×
Monthly cashflow live
- Estimated rent
- $1,162 medium interval (Pro) →
- Mortgage (P&I)
- −$513
- Tax from tax record
- −$164 /mo · $1,965/yr
- Insurance
- −$41
- HOA
- −$0
- Vacancy / Maint / Mgmt
- −$244
- Net cashflow
- $200
Break-even live
UW: 25.0% down · 7.5% · 30yr · 1.5% tax · 5.0% vac · 8.0% maint · 8.0% mgmt
Financing live
Cash to close
- Down payment
- $24,475
- Closing costs
- $2,937
- Reserves months
- —
- Total cash needed
- —
Loan-product check · same deal, 3 products live
Conventional
25% down · 7.5% · 30yr
- Down + closing
- —
- Monthly P&I
- —
- Monthly cashflow
- —
- DSCR
- —
- Eligible?
- —
Personal DTI + credit; lowest rate.
DSCR
20% down · 8.5% · 30yr
- Down + closing
- —
- Monthly P&I
- —
- Monthly cashflow
- —
- DSCR
- —
- Eligible?
- —
No personal income docs; deal must DSCR.
Hard money
10% down · 12.0% · 12mo
- Down + closing
- —
- Monthly P&I
- —
- Monthly cashflow
- —
- DSCR
- —
- Eligible?
- —
Short-term bridge; refi at stabilization.
Listing history 21 events
-
2026-06-18days on market $97,900 Active 25 DOM
-
2026-06-17days on market $97,900 Active 24 DOM
-
2026-06-16days on market $97,900 Active 23 DOM
-
2026-06-15days on market $97,900 Active 22 DOM
-
2026-06-14days on market $97,900 Active 20 DOM
-
2026-06-13days on market $97,900 Active 19 DOM
-
2026-06-10days on market $97,900 Active 17 DOM
-
2026-06-09days on market $97,900 Active 16 DOM
-
2026-06-08days on market $97,900 Active 15 DOM
-
2026-06-07days on market $97,900 Active 14 DOM
-
2026-06-03days on market $97,900 Active 10 DOM
-
2026-06-02days on market $97,900 Active 9 DOM
-
2026-06-01days on market $97,900 Active 8 DOM
-
2026-05-31days on market $97,900 Active 7 DOM
-
2026-05-30days on market $97,900 Active 6 DOM
-
2026-05-24$97,900 Active
-
2026-02-19historical
-
2025-09-25status Active
-
2025-09-15status Pending
-
2025-06-02$89,900 Active
-
2003-08-19soldstatus
ⓘ Source: listings_history table (triggers on properties + properties_extension) + one-shot
backfill from property_details.listing_events for pre-trigger history.
Tax reassessment forecast TX · Resets to sale price
- Current annual tax
- $1,965 · $164/mo
- Projected year-2 tax
- $1,965 · $164/mo
- Expected delta
- $0/yr ($0/mo · 0.0%)
ⓘ Screening estimate from a state-policy table — verify with the county assessor before closing.
Climate risk First Street
- Flood 1/10 Low FEMA zone X · 0% chance over 30 yrs
- Wildfire 3/10 Moderate
- Heat 7/10 Severe 7 d/yr ≥108°F today · 22 d/yr by 30 yrs out
- Wind 6/10 Major 70% chance of damaging wind over 30 yrs
- Air quality 1/10 Low 0 unhealthy d/yr today · 0 by 30 yrs out
Nearby sold comps map
Loading sold comps map…
Walkable amenities ~0.75 mi
Loading nearby amenities…
Taxation est. · year 1
- Rental income
- $13,941
- − Mortgage interest
- −$5,484
- − Property taxes
- −$1,965
- − Insurance
- −$490
- − Repairs & maintenance
- −$1,115
- − Management
- −$1,115
- − Depreciation
- −$2,848
- Taxable income
- $924
- Est. tax owed @ 24.0%
- −$222
- After-tax cash flow
- $2,176/yr
For passive investors: Depreciation is non-cash, so a rental often shows a tax loss while cash-flowing — sheltering income. Rental losses are passive: they offset passive income freely, and up to $25,000/yr can offset ordinary (W-2) income if you actively participate and your MAGI is under $100k (phasing out to $0 by $150k); unused losses carry forward. On sale, claimed depreciation is recaptured at up to 25%, and gains may owe capital-gains tax (a 1031 exchange can defer both). Figures are a year-1 estimate at your 24.0% rate — not tax advice; consult a CPA.
Schools (NCES district)
- District
- Marlin ISD
- NCES district ID
- 4829130
- Math proficiency
- 21% ▲ 2.00%
- Reading proficiency
- 22% ▲ 6.00%
- Median HH income
- $29,255
- Composite
- 17.18/100
- National rank
- #9106
- State rank
- #779 of 826 in TX
Livability — Marlin
- Score
- 59/100
- State rank
- #1146
- US rank
- #20161
Category grades
Schools grade is shown separately in the Schools card above.
Census & demographics
- Census place
- Marlin, TX
- Population (ZIP)
- 7,266
Population outlook (Falls County) Hauer SSP2
- Today (2025)
- 15,782 people
- By 2030
- 15,209 · -3.6%
- By 2040
- 14,276 · -9.5%
- By 2050
- 13,645 · -13.5%
- By 2075
- 13,724 · -13.0%
- By 2100
- 13,005 · -17.6%
Race, ethnicity, and origin ACS 2023
- Neighborhood character
- Highly diverse neighborhood (Simpson 0.70)
- Race & ethnicity
- Black 35% Hispanic / Latino 30% White 30% Two or more races 13% Asian 3%
- Hispanic origin (detail)
- Mexican 29%
- Common ancestry
- Romanian 2% Lithuanian 1% Italian 1%
- Foreign-born
- 7% · Canada
- Languages at home
- 84% English-only · Spanish 15%
Political lean MEDSL · Falls
- 2024 margin
- Solid R (+44.7) · D 27.3% · R 72.0%
- 2008→2024 swing
- -25.0pp toward R · 2008: -19.7pp · 2024: -44.7pp
- All cycles
- 2024: R+44.7 2020: R+37.1 2016: R+33.6 2012: R+24.4 2008: R+19.7
Not yet ingested
- Civics
- —
Market trends
- HPI YoY
- ▲ 4.17%
- Current HPI
- 126.9217
- Rent YoY
- —
- Metro
- —
- State GDP YoY
- ▲ 3.95%
- F500 in state
- 110
Industry mix (Fortune 500 HQ in TX)
| Industry | F500 HQs | Revenue |
|---|---|---|
| Energy | 16 | $1,198B |
|
||
| Technology | 5 | $198B |
|
||
| Engineering / Construction | 4 | $72B |
|
||
| Energy Services | 3 | $60B |
|
||
| Utilities | 3 | $41B |
|
||
| Healthcare | 2 | $330B |
|
||
Price history
+8.9% since first listed6 events — show timeline
- 2026-05-24 Listed $97,900 NTREIS
- 2026-02-19 Listing Removed — NTREIS
- 2025-09-25 Relisted — NTREIS
- 2025-09-15 Pending — NTREIS
- 2025-06-02 Listed $89,900 NTREIS
- 2003-08-19 Sold (Public Records) — Public Records
Property tax history
+3.9%/yrLatest (2025): $1,965 · +11.7% YoY. Source: county tax records.
Cash-flow waterfall
monthlySold comps — $/sqft
last 12 mo · ≤1 miLoading sold comps…