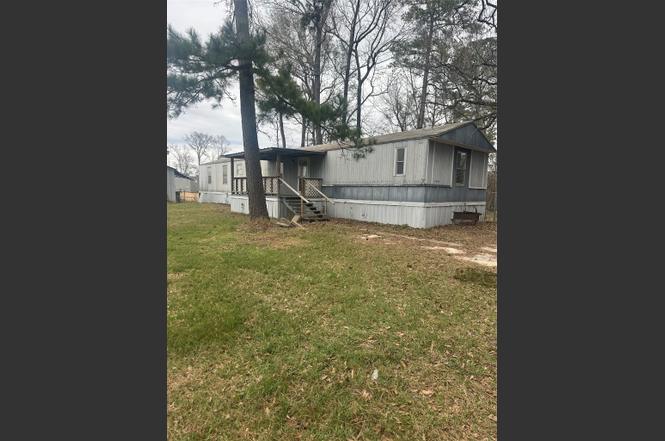
17899 Lakeview Dr · Porter Heights, TX
Flood risk 1/10 · Minimal
- FEMA flood zone
- X (unshaded)
- Chance of flooding over 30 yrs
- 0.0%
- Est. flood insurance / yr
- $507 – $1,088
Fire risk 3/10 · Minor
- Est. fire insurance / yr
- $1,222 – $2,270
Heat risk 8/10 · Major
- Hot days now (above 110°F)
- 7 days/yr
- Hot days in 30 yrs
- 23 days/yr
Wind risk 8/10 · Major
- Chance of severe wind over 30 yrs
- 99.0%
Air-quality risk 3/10 · Minor
- Unhealthy air days now
- 3 days/yr
- Unhealthy air days in 30 yrs
- 3 days/yr
Risk factors via First Street. Map © Google.
Why this score? — see what drove the B- grade
The composite is a weighted blend of 9 inputs, each scored 0–100. Each bar is that input's sub-score; the figure is the points it added to the 100-point composite (weight × sub-score).
- Cash flow +30.0/30.0
- 1% rule +10.0/10.0
- DSCR +10.0/10.0
- ARV discount +7.5/15.0
- Livability +3.2/5.0
- Rent growth +2.9/5.0
- Schools +2.8/10.0
- Condition / age +2.5/5.0
- Appreciation +0.0/10.0
$130,000
🖨 Deal sheet 📄 Offer letter ✓ Due diligence
Key facts
- 0.29 acre lot
- Built 1993
- Listed 15 days
Property features AI
Finance
- Other: Living area approximately 1,330 (building area total)
Exterior
- Utilities: Public water; Public sewer and septic tank
- Home design: Residential property; Faces south; Single-level living (rooms listed on first floor)
- Construction: Built in 1993; Aluminum and wood siding; Metal roof; Block foundation
- Exterior features: Covered patio and patio; Deck; Storage; Shed(s); Cleared lot in a subdivision; Has additional parcels
Interior
- Kitchen: Free-standing range; Oven
- Bedrooms: Primary bedroom on the first floor (16x6); Bedroom on the first floor (12x10); Bedroom on the first floor (10x11)
- Flooring: Plank flooring; Vinyl flooring; Wood flooring
- Bathrooms: 2 full bathrooms
- Heating & cooling: Central heating (electric and gas); Central air conditioning (electric and gas)
- Interior features: Washer hookup and hookups for both electric and gas dryer; Free-standing range and oven; Plank, vinyl, and wood flooring; No fireplaces
- Laundry & utility: Washer hookup; Electric dryer hookup; Gas dryer hookup
Neighborhood map
What this means for you Summary
Snapshot
- This is a 3-bed/2.0-bath manufactured listed at $130k.
Deal economics
- At list price, monthly cash flow is $840 ($10k/yr) — positive.
- The deal already cash-flows at list — no discount required.
- Meets the 1% rule at list price ($2k rent vs $130k).
- Recommended offer: $128k (1.5% below list) — sets the bar for market timing.
- Cap rate 14.1% vs local median 2.5% in Porter Heights — top-decile yield for the area; either an underpriced asset or a hidden risk that comps aren't pricing in. Stress-test before assuming the spread holds.
Location & tenants
- Location reads 65/100 on livability (#663 in TX) — a middle-class / working-renter tenant base. Strengths: crime A+, employment A+, cost of living A+; Watch: amenities F, commute F, health & safety F.
- New Caney ISD (suburban): math 31% / reading 32% proficiency, ranked #570 of 826 in TX (top 69%) — families likely to look elsewhere, expect single-tenant / working-renter base with shorter leases.
- Zoned schools: Robert Crippen El (math 23% / reading 23%, grade F, #3,277 of 4,322 statewide, top 77%, 858 students, 77% FRL); White Oak Middle (math 38% / reading 32%, grade F, #842 of 1,662 statewide, top 51%, 834 students, 75% FRL); Porter H S (math 31% / reading 38%, grade F, #963 of 1,632 statewide, top 61%, 2,209 students, 65% FRL) — zoned schools average 72% FRL vs 57% district-wide (16 pts higher); higher-poverty schools than district average — tighter screening recommended.
- Market conditions: Rents rising (+1.6%/yr); 941 active listings in the ZIP; 6 comparable units currently listed for rent nearby; rentals at typical pace (median 17d on market — plan ~3-4 weeks tenant-placement turnaround); solid renter incomes; 13,259 units permitted in Montgomery County in 2024 (1,402 in 5+ unit buildings).
Forward outlook
- Local home prices are declining (-3.0%/yr); year-one equity from $899 of loan paydown is wiped out by about $4k of value loss. Plan a longer hold.
- Montgomery County population projected at +65% by 2050 — long-run rental-demand tailwind backs the buy-and-hold thesis.
- At projected returns (-3.0% appreciation + 1.6% rent growth), your $36k cash investment doubles in ~5 years — after that, you're playing with house money.
Negotiation context
- It's been on market 15 days — a 2% lower offer ($128k) is reasonable based on typical stale-listing flexibility.
- 2 sale attempts with the ask held roughly flat each time — persistent listings suggest the price (not the market) is what's stuck; bring a comps-based counter.
Risks & watch-outs
- Climate carrying-cost: severe wind risk, 99% chance of damaging wind over 30y; extreme-heat days projected 7→23/yr by 2055 (HVAC capex compounding) — expect insurance premiums to compound above CPI over the hold.
Questions for the listing agent
- Is there a deadline driving the sale (1031 exchange, divorce, estate, relocation)? That informs how much negotiation room exists.
- Schools are F-rated, which usually means shorter tenancies and higher turnover. Who's the typical renter profile here, and what's been the actual vacancy rate?
- What's the average days-on-market for RENTAL listings here right now (not sales)? A rising rental-DOM trend means longer vacancies and softer asking-rent achievability than the comps imply.
- What's the recent tenant-quality profile in this submarket — average credit score on applications, eviction rate, late-payment / NSF rate, and stable-employment percentage? A property-management company in the area should have these aggregated.
- How much new for-sale + rental construction is in the pipeline within 1–3 miles? Heavy new supply typically softens prices + rents 12–24 months out; constrained supply supports both.
Investment metrics
- 1% rule
- 1.58% ✓
- Cap rate
- 14.05%
- Cash-on-cash
- 27.71%
- DSCR
- 2.23
- GRM
- 5.3
CMA / ARV
No comps found within radius.
Projected returns pro-forma
-3.0% appreciation · 1.65% rent growth · sell at horizon
- IRR
- 20.3%
- Equity multiple
- 1.82×
- Total profit
- $29,670
- Equity at exit
- $19,383
- IRR
- 27.7%
- Equity multiple
- 3.30×
- Total profit
- $83,610
- Equity at exit
- $11,240
Cash invested: $36,400 (down + closing). Projections, not guarantees.
Landlord ↔ Tenant lean methodology
- Overall (STATE)
- 87 Strongly Landlord-Friendly
- State Texas
- 87 Strongly Landlord-Friendly · R+5
- County
- — inherits STATE
- City
- — inherits STATE
ZIP-level market 77365
- Home prices YoY
- -33.0%
- Rents YoY
- 1.6%
- Active inventory
- 941
- Price-to-rent
- 5.3×
Monthly cashflow live
- Estimated rent
- $2,051 high interval (Pro) →
- Mortgage (P&I)
- −$682
- Tax from tax record
- −$44 /mo · $532/yr
- Insurance
- −$54
- HOA
- −$0
- Vacancy / Maint / Mgmt
- −$431
- Net cashflow
- $840
Break-even live
UW: 25.0% down · 7.5% · 30yr · 1.5% tax · 5.0% vac · 8.0% maint · 8.0% mgmt
Financing live
Cash to close
- Down payment
- $32,500
- Closing costs
- $3,900
- Reserves months
- —
- Total cash needed
- —
Loan-product check · same deal, 3 products live
Conventional
25% down · 7.5% · 30yr
- Down + closing
- —
- Monthly P&I
- —
- Monthly cashflow
- —
- DSCR
- —
- Eligible?
- —
Personal DTI + credit; lowest rate.
DSCR
20% down · 8.5% · 30yr
- Down + closing
- —
- Monthly P&I
- —
- Monthly cashflow
- —
- DSCR
- —
- Eligible?
- —
No personal income docs; deal must DSCR.
Hard money
10% down · 12.0% · 12mo
- Down + closing
- —
- Monthly P&I
- —
- Monthly cashflow
- —
- DSCR
- —
- Eligible?
- —
Short-term bridge; refi at stabilization.
Rent comps 6 comps
| Address | Beds | Baths | Sqft | Rent | $/sqft | DOM | Units | Dist |
|---|---|---|---|---|---|---|---|---|
| 18167 Woodsdale Ct Porter, TX | 4.0 | 2.5 | 1608 | $1,769 | $1.10 | 2d | 1 | 0.98mi |
| 18644 Swainboro Dr New Caney, TX | 3.0 | 2.0 | 1415 | $2,000 | $1.41 | 43d | 1 | 1.33mi |
| 21625 Hackamore Ct Porter, TX | 3.0 | 2.0 | 1758 | $2,145 | $1.22 | 11d | 1 | 1.33mi |
| 20114 Battle Branch Trl New Caney, TX | 3.0 | 2.0 | 1465 | $1,949 | $1.33 | 2d | 1 | 1.33mi |
| 16658 Moss Ln Porter, TX | 3.0 | 2.0 | 1402 | $1,750 | $1.25 | 24d | 1 | 1.37mi |
| 20112 Leaf River Cir New Caney, TX | 4.0 | 2.0 | 1831 | $1,895 | $1.03 | 17d | 1 | 1.39mi |
Listing history 6 events
-
2026-05-07status Pending
-
2026-05-04status Active
-
2026-02-09status Pending
-
2026-01-28status Pending
-
2026-01-27$130,000 Active
-
1997-04-16soldstatus
ⓘ Source: listings_history table (triggers on properties + properties_extension) + one-shot
backfill from property_details.listing_events for pre-trigger history.
Tax reassessment forecast TX · Resets to sale price
- Current annual tax
- $532 · $44/mo
- Projected year-2 tax
- $2,379 · $198/mo
- Expected delta
- +$1,847/yr (+$154/mo · 347.1%)
ⓘ Screening estimate from a state-policy table — verify with the county assessor before closing.
Climate risk First Street
- Flood 1/10 Low FEMA zone X (unshaded) · 0% chance over 30 yrs
- Wildfire 3/10 Moderate
- Heat 8/10 Severe 7 d/yr ≥110°F today · 23 d/yr by 30 yrs out
- Wind 8/10 Severe 99% chance of damaging wind over 30 yrs
- Air quality 3/10 Moderate 3 unhealthy d/yr today · 3 by 30 yrs out
Nearby sold comps map
Loading sold comps map…
Walkable amenities ~0.75 mi
Loading nearby amenities…
Taxation est. · year 1
- Rental income
- $24,618
- − Mortgage interest
- −$7,282
- − Property taxes
- −$532
- − Insurance
- −$650
- − Repairs & maintenance
- −$1,969
- − Management
- −$1,969
- − Depreciation
- −$3,782
- Taxable income
- $8,433
- Est. tax owed @ 24.0%
- −$2,024
- After-tax cash flow
- $8,061/yr
For passive investors: Depreciation is non-cash, so a rental often shows a tax loss while cash-flowing — sheltering income. Rental losses are passive: they offset passive income freely, and up to $25,000/yr can offset ordinary (W-2) income if you actively participate and your MAGI is under $100k (phasing out to $0 by $150k); unused losses carry forward. On sale, claimed depreciation is recaptured at up to 25%, and gains may owe capital-gains tax (a 1031 exchange can defer both). Figures are a year-1 estimate at your 24.0% rate — not tax advice; consult a CPA.
Schools (NCES district)
- District
- New Caney ISD
- NCES district ID
- 4832400
- Math proficiency
- 31% ▼ -16.00%
- Reading proficiency
- 32% ▼ -6.00%
- Median HH income
- $55,380
- Composite
- 27.97/100
- National rank
- #6857
- State rank
- #570 of 826 in TX
Livability — Porter Heights
- Score
- 65/100
- State rank
- #663
- US rank
- #12479
Category grades
Schools grade is shown separately in the Schools card above.
Census & demographics
- Census place
- Porter Heights, TX
- County
- Montgomery County · 663,713 people
- Metro
- Houston-The Woodlands-Sugar Land, TX
- Population (ZIP)
- 46,418
- Household income
- $95,702
- Rent vs Own
- Severe rent burden
- 1016.0
Population outlook (Montgomery County) Hauer SSP2
- Today (2025)
- 713,896 people
- By 2030
- 805,263 · +12.8%
- By 2040
- 992,708 · +39.1%
- By 2050
- 1,179,590 · +65.2%
- By 2075
- 1,628,084 · +128.1%
- By 2100
- 1,937,880 · +171.5%
Race, ethnicity, and origin ACS 2023
- Neighborhood character
- Diverse neighborhood (Simpson 0.59)
- Race & ethnicity
- Hispanic / Latino 46% White 44% Two or more races 15% Black 5% Asian 3%
- Hispanic origin (detail)
- Mexican 39% Puerto Rican 1%
- Common ancestry
- Lithuanian 4% Slovak 2% Romanian 2%
- Foreign-born
- 18% · Canada
- Languages at home
- 59% English-only · Spanish 36% Other Indo-European 2% Russian/Polish/Slavic 1%
Political lean MEDSL · Montgomery
- 2024 margin
- Solid R (+45.5) · D 26.8% · R 72.3%
- 2008→2024 swing
- +7.2pp toward D · 2008: -52.7pp · 2024: -45.5pp
- All cycles
- 2024: R+45.5 2020: R+43.8 2016: R+51.4 2012: R+60.7 2008: R+52.7
Not yet ingested
- Civics
- —
Market trends
- HPI YoY
- ▼ -111.46%
- Current HPI
- 225.9903
- Rent YoY
- ▲ 1.65%
- Metro
- Houston-The Woodlands-Sugar Land, TX
- State GDP YoY
- ▲ 3.95%
- F500 in state
- 110
Industry mix (Fortune 500 HQ in TX)
| Industry | F500 HQs | Revenue |
|---|---|---|
| Energy | 16 | $1,198B |
|
||
| Technology | 5 | $198B |
|
||
| Engineering / Construction | 4 | $72B |
|
||
| Energy Services | 3 | $60B |
|
||
| Utilities | 3 | $41B |
|
||
| Healthcare | 2 | $330B |
|
||
Price history
6 events — show timeline
- 2026-05-07 Pending — HARMLS
- 2026-05-04 Relisted — HARMLS
- 2026-02-09 Pending — HARMLS
- 2026-01-28 Pending — HARMLS
- 2026-01-27 Listed $130,000 HARMLS
- 1997-04-16 Sold (Public Records) — Public Records
Property tax history
+3.8%/yrLatest (2025): $532 · +19.6% YoY. Source: county tax records.
Cash-flow waterfall
monthlySold comps — $/sqft
last 12 mo · ≤1 miLoading sold comps…