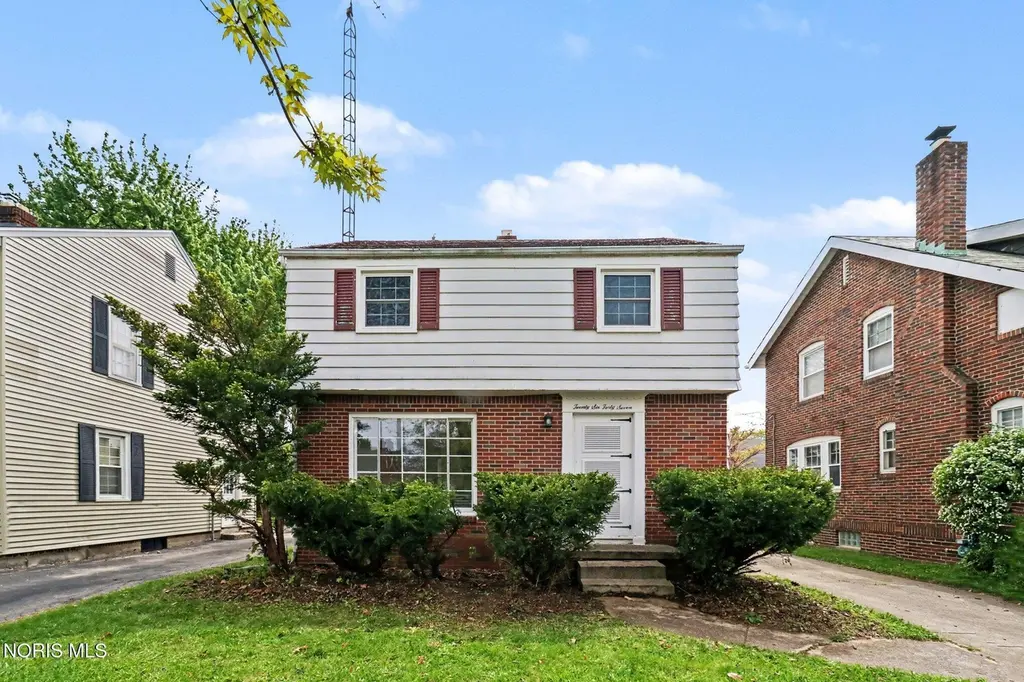
2647 Stamford Dr · Toledo, OH
Flood risk 1/10 · Minimal
- FEMA flood zone
- X (unshaded)
- Chance of flooding over 30 yrs
- 0.0%
- Est. flood insurance / yr
- $473 – $860
Fire risk 1/10 · Minimal
- Est. fire insurance / yr
- $713 – $1,323
Heat risk 3/10 · Minor
- Hot days now (above 100°F)
- 7 days/yr
- Hot days in 30 yrs
- 16 days/yr
Wind risk 2/10 · Minimal
- Chance of severe wind over 30 yrs
- —
Air-quality risk 2/10 · Minimal
- Unhealthy air days now
- 1 days/yr
- Unhealthy air days in 30 yrs
- 2 days/yr
Risk factors via First Street. Map © Google.
Why this score? — see what drove the B- grade
The composite is a weighted blend of 9 inputs, each scored 0–100. Each bar is that input's sub-score; the figure is the points it added to the 100-point composite (weight × sub-score).
- Cash flow +30.0/30.0
- DSCR +10.0/10.0
- 1% rule +9.8/10.0
- ARV discount +7.5/15.0
- Rent growth +4.5/5.0
- Livability +3.3/5.0
- Condition / age +2.5/5.0
- Schools +1.6/10.0
- Appreciation +0.0/10.0
$99,000
🖨 Deal sheet 📄 Offer letter ✓ Due diligence
Listing remarks
Two-story home in a prime location close to schools, parks, and restaurants! This property offers great potential and is ready for your vision. While it does need some repairs, it presents an excellent opportunity for investors or buyers looking to build equity. Don't miss your chance to own in a desirable area. Minimum Bid Auction of $99,000 on May 18th at 3 PM. Preview and registration begin at 2 PM.
Key facts
- 4,400 sq ft lot
- Garage
- Built 1957
Property features AI
Exterior
- Parking: Detached garage; Driveway; Garage with ~1.5 spaces
- Utilities: Electricity connected; Natural gas connected; Public water; Public sewer
- Home design: Single-family house; Two levels (2 stories); Not attached / no common walls; Entry facing information not provided
- Construction: Brick construction; Block foundation; Built year not provided
- Exterior features: Shingle roof
Interior
- Kitchen: Kitchen on main level
- Bedrooms: Primary bedroom (Upper); Bedroom 2 (Upper); Bedroom 3 (Upper)
- Flooring: Carpet; Hardwood
- Bathrooms: 1 full bathroom
- Heating & cooling: Forced air heating; Natural gas heating
- Interior features: Eat-in kitchen; Other
- Laundry & utility: Laundry in basement; Basement present; Bonus room on lower level (large finished space)
Neighborhood map
What this means for you Summary
Snapshot
- This is a 3-bed/1.0-bath single-family listed at $99k.
Deal economics
- At list price, monthly cash flow is $406 ($5k/yr) — positive.
- The deal already cash-flows at list — no discount required.
- Meets the 1% rule at list price ($1k rent vs $99k).
- Recommended offer: $98k (1.5% below list) — sets the bar for market timing.
- Cap rate 11.2% vs local median 7.6% in Toledo — top-decile yield for the area; either an underpriced asset or a hidden risk that comps aren't pricing in. Stress-test before assuming the spread holds.
Location & tenants
- Location reads 66/100 on livability (#645 in OH) — a middle-class / working-renter tenant base. Strengths: cost of living A+, housing A+, health & safety A+; Watch: amenities C-, crime F, commute F.
- Toledo City (urban): math 15% / reading 24% proficiency, ranked #634 of 656 in OH (top 97%) — low school quality limits family demand, transient renter base, plan for 1-2y turnover; 72% free/reduced lunch — lower-income household profile, screen leases tightly.
- Zoned schools: Beverly Elementary School (math 32% / reading 46%, grade F, #1,078 of 1,584 statewide, top 68%, 536 students, 48% FRL); Bowsher High School (math 23% / reading 45%, grade F, #596 of 781 statewide, top 76%, 1,240 students, 49% FRL) — zoned schools average 49% FRL vs 72% district-wide (23 pts lower); this property's tenant base skews higher-income than the district average.
- Zoned-school proficiency averages 36% at this address vs 20% district-wide (+17 pts) — the actual schools serving this property are materially stronger than the Toledo City average implies; a family-tenant draw the district grade alone would hide.
- Market conditions: Rents rising fast (+8.0%/yr); 71 active listings in the ZIP; 7 comparable units currently listed for rent nearby; rentals at typical pace (median 21d on market — plan ~3-4 weeks tenant-placement turnaround); 415 units permitted in Lucas County in 2024 (122 in 5+ unit buildings).
Forward outlook
- Local home prices are declining (-3.0%/yr); year-one equity from $684 of loan paydown is wiped out by about $3k of value loss. Plan a longer hold.
- Lucas County population projected at -16% by 2050 — secular population decline; favor cash flow + early exit over multi-decade hold.
- At projected returns (-3.0% appreciation + 8.0% rent growth), your $28k cash investment doubles in ~6 years — after that, you're playing with house money.
Negotiation context
- It's been on market 21 days — a 2% lower offer ($98k) is reasonable based on typical stale-listing flexibility.
Risks & watch-outs
- Watch-outs: built in 1957 — expect roof / HVAC / electrical / plumbing capex.
Questions for the listing agent
- Built in 1957 — when were the roof, HVAC, electrical panel, plumbing, and water heater last replaced?
- Is there a deadline driving the sale (1031 exchange, divorce, estate, relocation)? That informs how much negotiation room exists.
- Schools are D-rated, which usually means shorter tenancies and higher turnover. Who's the typical renter profile here, and what's been the actual vacancy rate?
- Crime grade is F in this area — have there been break-ins, vandalism, or insurance claims at this property in the last 3 years? What carrier currently insures it and at what premium?
- What's the average days-on-market for RENTAL listings here right now (not sales)? A rising rental-DOM trend means longer vacancies and softer asking-rent achievability than the comps imply.
- What's the recent tenant-quality profile in this submarket — average credit score on applications, eviction rate, late-payment / NSF rate, and stable-employment percentage? A property-management company in the area should have these aggregated.
- How much new for-sale + rental construction is in the pipeline within 1–3 miles? Heavy new supply typically softens prices + rents 12–24 months out; constrained supply supports both.
Investment metrics
- 1% rule
- 1.48% ✓
- Cap rate
- 11.22%
- Cash-on-cash
- 17.60%
- DSCR
- 1.78
- GRM
- 5.6
CMA / ARV
- ARV (median comp)
- $205,889
- List price
- $99,000
- Delta
- -51.92%
- Verdict
- UNDERPRICED
- Comps
- 20 within 1.0 mi
Show comp detail 12 sales within ~0.75 mi
| Address | Dist | Beds/Ba | Sqft | Sold | Price | $/sf | Match |
|---|---|---|---|---|---|---|---|
| 3104 Ravenwood Blvd | 0.57mi | 3/1.0 | 1,251 (+0%) | 2mo | $173,000 | $138 | 72 |
| 2944 Daleford Dr | 0.52mi | 3/1.5 | 1,204 (-4%) | 3mo | $232,500 | $193 | 65 |
| 3037 Maeterlinck Ave | 0.47mi | 3/2.0 | 1,170 (-6%) | 1mo | $164,900 | $141 | 63 |
| 1926 Meadowlark Ave | 0.26mi | 3/2.0 | 1,091 (-13%) | 1mo | $234,900 | $215 | 61 |
| 3133 Strathmoor Ave | 0.57mi | 3/1.0 | 1,158 (-7%) | 1mo | $186,000 | $161 | 61 |
| 3459 Pineway Dr | 0.28mi | 3/2.0 | 1,401 (+12%) | 3mo | $239,900 | $171 | 61 |
| 3018 Cragmoor Ave | 0.51mi | 2/1.0 (-1) | 1,163 (-7%) | 2mo | $145,000 | $125 | 58 |
| 3013 Glencairn Ave | 0.38mi | 3/1.0 | 1,080 (-14%) | 4mo | $180,000 | $167 | 56 |
| 1538 Watova Rd | 0.66mi | 3/1.0 | 1,148 (-8%) | 2mo | $88,000 | $77 | 54 |
| 3250 Heatherdowns Blvd | 0.75mi | 2/1.0 (-1) | 1,365 (+9%) | 3mo | $198,900 | $146 | 42 |
| 3121 Daleford Dr | 0.67mi | 3/1.5 | 1,076 (-14%) | 2mo | $153,500 | $143 | 42 |
| 1422 Leith Dr | 0.73mi | 2/1.0 (-1) | 1,113 (-11%) | 1mo | $172,000 | $155 | 42 |
Match score weights: distance 35% · size 25% · config 20% · recency 20%. Top-matched comps best support the ARV.
Projected returns pro-forma
-3.0% appreciation · 8.0% rent growth · sell at horizon
- IRR
- 14.9%
- Equity multiple
- 1.64×
- Total profit
- $17,627
- Equity at exit
- $14,761
- IRR
- 27.3%
- Equity multiple
- 4.03×
- Total profit
- $84,070
- Equity at exit
- $8,560
Cash invested: $27,720 (down + closing). Projections, not guarantees.
Landlord ↔ Tenant lean methodology
- Overall (STATE)
- 73 Landlord-Friendly
- State Ohio
- 73 Landlord-Friendly · R+6
- County
- — inherits STATE
- City
- — inherits STATE
ZIP-level market 43614
- Home prices YoY
- -22.4%
- Rents YoY
- 8.0%
- Active inventory
- 71
- Price-to-rent
- 5.6×
Monthly cashflow live
- Estimated rent
- $1,461 high interval (Pro) →
- Mortgage (P&I)
- −$519
- Tax from tax record
- −$187 /mo · $2,246/yr
- Insurance
- −$41
- HOA
- −$0
- Vacancy / Maint / Mgmt
- −$307
- Net cashflow
- $406
Break-even live
UW: 25.0% down · 7.5% · 30yr · 1.5% tax · 5.0% vac · 8.0% maint · 8.0% mgmt
Financing live
Cash to close
- Down payment
- $24,750
- Closing costs
- $2,970
- Reserves months
- —
- Total cash needed
- —
Loan-product check · same deal, 3 products live
Conventional
25% down · 7.5% · 30yr
- Down + closing
- —
- Monthly P&I
- —
- Monthly cashflow
- —
- DSCR
- —
- Eligible?
- —
Personal DTI + credit; lowest rate.
DSCR
20% down · 8.5% · 30yr
- Down + closing
- —
- Monthly P&I
- —
- Monthly cashflow
- —
- DSCR
- —
- Eligible?
- —
No personal income docs; deal must DSCR.
Hard money
10% down · 12.0% · 12mo
- Down + closing
- —
- Monthly P&I
- —
- Monthly cashflow
- —
- DSCR
- —
- Eligible?
- —
Short-term bridge; refi at stabilization.
Rent comps 7 comps
| Address | Beds | Baths | Sqft | Rent | $/sqft | DOM | Units | Dist |
|---|---|---|---|---|---|---|---|---|
| 3042 Cragmoor Ave Toledo, OH | 3.0 | 1.0 | 1250 | $1,800 | $1.44 | 44d | 1 | 0.52mi |
| 1510 Watova Rd Toledo, OH | 3.0 | 1.0 | 1197 | $1,495 | $1.25 | 21d | 1 | 0.69mi |
| 3025 S Byrne Rd Unit 1 Toledo, OH | 3.0 | 1.0 | 1064 | $1,095 | $1.03 | 21d | 1 | 0.85mi |
| 1255 S Byrne Rd Toledo, OH | 1.0–3.0 | 1.0–2.0 | 1080 | $1,529 | $1.42 | 14d | 1 | 1.27mi |
| 3348 Arlington Ave Apt 10 Toledo, OH | 2.0 | 1.0 | 900 | $795 | $0.88 | 44d | 1 | 1.34mi |
| 1027 Valley Side Dr Maumee, OH | 2.0 | 1.5 | 1260 | $1,495 | $1.19 | 23d | 1 | 1.47mi |
| 1010 Valley Side Dr Unit 1010 Maumee, OH | 2.0 | 1.5 | 1260 | $1,395 | $1.11 | 14d | 1 | 1.48mi |
Listing history 3 events
-
2026-04-27$99,000 Active 405-char remark
-
1990-08-27soldstatus $79,000
-
1960-06-23soldstatus $19,500
ⓘ Source: listings_history table (triggers on properties + properties_extension) + one-shot
backfill from property_details.listing_events for pre-trigger history.
Tax reassessment forecast OH · Partial reset (capped growth)
- Current annual tax
- $2,246 · $187/mo
- Projected year-2 tax
- $2,246 · $187/mo
- Expected delta
- $0/yr ($0/mo · 0.0%)
ⓘ Screening estimate from a state-policy table — verify with the county assessor before closing.
Climate risk First Street
- Flood 1/10 Low FEMA zone X (unshaded) · 0% chance over 30 yrs
- Wildfire 1/10 Low
- Heat 3/10 Moderate 7 d/yr ≥100°F today · 16 d/yr by 30 yrs out
- Wind 2/10 Low
- Air quality 2/10 Low 1 unhealthy d/yr today · 2 by 30 yrs out
Nearby sold comps map
Loading sold comps map…
Walkable amenities ~0.75 mi
Loading nearby amenities…
Taxation est. · year 1
- Rental income
- $17,529
- − Mortgage interest
- −$5,546
- − Property taxes
- −$2,246
- − Insurance
- −$495
- − Repairs & maintenance
- −$1,402
- − Management
- −$1,402
- − Depreciation
- −$2,880
- Taxable income
- $3,559
- Est. tax owed @ 24.0%
- −$854
- After-tax cash flow
- $4,024/yr
For passive investors: Depreciation is non-cash, so a rental often shows a tax loss while cash-flowing — sheltering income. Rental losses are passive: they offset passive income freely, and up to $25,000/yr can offset ordinary (W-2) income if you actively participate and your MAGI is under $100k (phasing out to $0 by $150k); unused losses carry forward. On sale, claimed depreciation is recaptured at up to 25%, and gains may owe capital-gains tax (a 1031 exchange can defer both). Figures are a year-1 estimate at your 24.0% rate — not tax advice; consult a CPA.
Schools (NCES district)
- District
- Toledo City
- NCES district ID
- 3904490
- Math proficiency
- 15% ▼ -16.00%
- Reading proficiency
- 24% ▼ -13.00%
- Median HH income
- $32,137
- Composite
- 15.76/100
- National rank
- #9276
- State rank
- #634 of 656 in OH
Livability — Toledo
- Score
- 66/100
- State rank
- #645
- US rank
- #11442
Category grades
Schools grade is shown separately in the Schools card above.
Census & demographics
- Census place
- Toledo, OH
- County
- Lucas County · 380,724 people
- City population
- 280,811
- Metro
- Toledo, OH
- Population (ZIP)
- 29,075
- Household income
- $58,961
- Rent vs Own
- Severe rent burden
- 1407.0
Population outlook (Lucas County) Hauer SSP2
- Today (2025)
- 420,751 people
- By 2030
- 410,187 · -2.5%
- By 2040
- 384,019 · -8.7%
- By 2050
- 355,125 · -15.6%
- By 2075
- 291,683 · -30.7%
- By 2100
- 233,670 · -44.5%
Race, ethnicity, and origin ACS 2023
- Neighborhood character
- Predominantly White (67%)
- Race & ethnicity
- White 67% Black 21% Hispanic / Latino 7% Two or more races 4% Asian 2%
- Hispanic origin (detail)
- Mexican 6% Puerto Rican 1%
- Common ancestry
- Romanian 8% Italian 5% Lithuanian 3%
- Foreign-born
- 3% · Canada
- Languages at home
- 96% English-only · Other Indo-European 1% Spanish 1%
Political lean MEDSL · Lucas
- 2024 margin
- D (+12.6) · D 55.8% · R 43.2%
- 2008→2024 swing
- -18.9pp toward R · 2008: 31.4pp · 2024: 12.6pp
- All cycles
- 2024: D+12.6 2020: D+16.8 2016: D+17.4 2012: D+30.4 2008: D+31.4
Not yet ingested
- Civics
- —
Market trends
- HPI YoY
- ▼ -61.96%
- Current HPI
- 214.7031
- Rent YoY
- ▲ 8.03%
- Metro
- Toledo, OH
- State GDP YoY
- ▲ 1.98%
- F500 in state
- 48
Industry mix (Fortune 500 HQ in OH)
| Industry | F500 HQs | Revenue |
|---|---|---|
| Insurance | 3 | $145B |
|
||
| Industrial Machinery | 3 | $49B |
|
||
| Financial Services | 3 | $24B |
|
||
| Consumer Goods | 2 | $93B |
|
||
| Aerospace / Defense | 2 | $47B |
|
||
| Utilities | 2 | $33B |
|
||
Price history
+588.2% since first listed5 events — show timeline
- 2026-06-08 Sold (MLS) $134,200 NORIS
- 2026-05-19 Pending — NORIS
- 2026-04-27 Listed $99,000 NORIS
- 1990-08-27 Sold (Public Records) $79,000 Public Records
- 1960-06-23 Sold (Public Records) $19,500 Public Records
Property tax history
+2.9%/yrLatest (2025): $2,246 · -0.9% YoY. Source: county tax records.
Cash-flow waterfall
monthlySold comps — $/sqft
last 12 mo · ≤1 miLoading sold comps…