 Multi-family
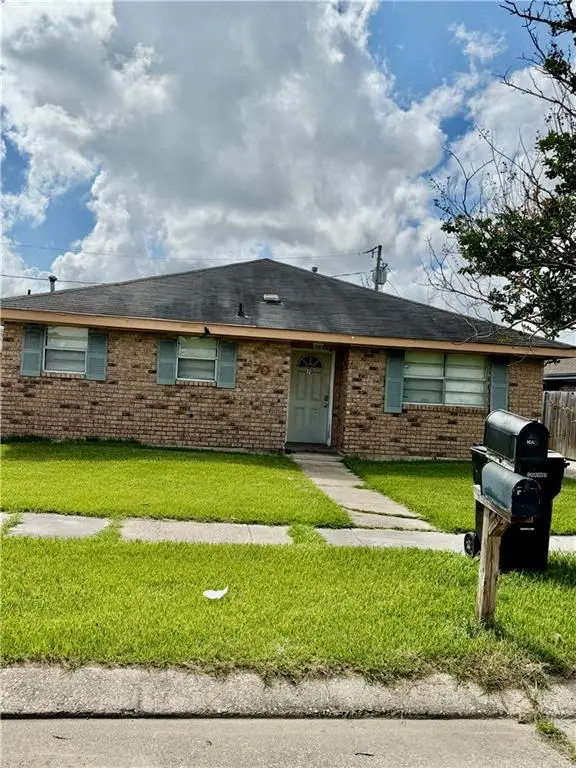
70 72 Phillip Ct · Chalmette, LA
Flood risk 8/10 · Major
- FEMA flood zone
- X (shaded)
- Chance of flooding over 30 yrs
- 0.6%
- Est. flood insurance / yr
- $507 – $1,088
Fire risk 1/10 · Minimal
- Est. fire insurance / yr
- $1,269 – $2,357
Heat risk 10/10 · Severe
- Hot days now (above 108°F)
- 7 days/yr
- Hot days in 30 yrs
- 21 days/yr
Wind risk 10/10 · Severe
- Chance of severe wind over 30 yrs
- 99.0%
Air-quality risk 3/10 · Minor
- Unhealthy air days now
- 3 days/yr
- Unhealthy air days in 30 yrs
- 3 days/yr
Risk factors via First Street. Map © Google.
Why this score? — see what drove the B- grade
The composite is a weighted blend of 9 inputs, each scored 0–100. Each bar is that input's sub-score; the figure is the points it added to the 100-point composite (weight × sub-score).
- Cash flow +28.4/30.0
- DSCR +10.0/10.0
- ARV discount +8.4/15.0
- 1% rule +6.9/10.0
- Schools +5.0/10.0
- Rent growth +3.3/5.0
- Livability +3.2/5.0
- Condition / age +2.5/5.0
- Appreciation +0.0/10.0
$249,000
🖨 Deal sheet 📄 Offer letter ✓ Due diligence
Multi-family units
County records classify this as Multi-Family (2-4 Unit). Listing-text estimate: 1 unit. estimate disagrees with records
Listing remarks MLS
Long term tenants. Well maintained. 2 bedrooms, one bath in the front unit and 3 bedrooms, 2 baths in rear unit. Great investment or live on one side and earn income from the other unit. Flood zone X means very low flood insurance.Must see to appreciate.
Key facts
- 2 parking spots
- Built 1987
- Listed 15 days
Property features AI
Exterior
- Parking: Off-street parking with two spaces via driveway
- Utilities: Public water; Public sewer
- Home design: Single-story property; Brick construction; Slab foundation; Shingle roof; Property was completely rebuilt after Hurricane Katrina (2005) and fully renovated in 2007
- Construction: Brick construction; Shingle roof; Slab foundation; Rebuilt after 2005 and renovated in 2007
- Exterior features: City lot, rectangular shape; Permeable paving
Interior
- Bedrooms: 2-unit property (total units: 2)
- Bathrooms: 3 full bathrooms (total)
- Heating & cooling: Central heating (dual system); Central air conditioning
- Interior features: Very good condition; Permeable paving
- Laundry & utility: Tenants pay electricity and water
Neighborhood map
What this means for you Summary
Snapshot
- This is a 5-bed/3.0-bath multifamily listed at $249k.
Deal economics
- At list price, monthly cash flow is $742 ($9k/yr) — positive.
- The deal already cash-flows at list — no discount required.
- Meets the 1% rule at list price ($3k rent vs $249k).
- Recommended offer: $245k (1.5% below list) — sets the bar for market timing.
- Cap rate 10.2% vs local median 5.5% in Chalmette — top-decile yield for the area; either an underpriced asset or a hidden risk that comps aren't pricing in. Stress-test before assuming the spread holds.
Location & tenants
- Location reads 65/100 on livability (#137 in LA) — a middle-class / working-renter tenant base. Strengths: cost of living A+, housing A+, health & safety A; Watch: crime F, amenities F, commute F.
- Market conditions: Rents rising (+3.1%/yr); 209 active listings in the ZIP; 1 comparable units currently listed for rent nearby; 112 units permitted in St. Bernard Parish in 2024 (0 in 5+ unit buildings).
- At $2,973/mo this rent would consume 65% of the median local household income ($55k/yr) (locally 881% of renters already pay >50% of income on rent) — very limited rent-growth headroom before tenants either downsize or default.
Forward outlook
- Local home prices are declining (-3.0%/yr); year-one equity from $2k of loan paydown is wiped out by about $7k of value loss. Plan a longer hold.
- St. Bernard County population projected at +89% by 2050 — long-run rental-demand tailwind backs the buy-and-hold thesis.
- At projected returns (-3.0% appreciation + 3.1% rent growth), your $70k cash investment doubles in ~9 years — after that, you're playing with house money.
Negotiation context
- It's been on market 16 days — a 2% lower offer ($245k) is reasonable based on typical stale-listing flexibility.
- 2 sale attempts with the ask held roughly flat each time — persistent listings suggest the price (not the market) is what's stuck; bring a comps-based counter.
- Current owner paid $55k; list at $249k implies a 353% gain — meaningful room to come down on a strong offer.
Risks & watch-outs
- Watch-outs: flood insurance adds $66/mo.
- Climate carrying-cost: severe flood risk; severe wind risk, 99% chance of damaging wind over 30y; extreme-heat days projected 7→21/yr by 2055 (HVAC capex compounding) — expect insurance premiums to compound above CPI over the hold.
Questions for the listing agent
- What's the actual annual flood-insurance premium (NFIP or private), and is the property in a SFHA with mandatory coverage?
- Is there a deadline driving the sale (1031 exchange, divorce, estate, relocation)? That informs how much negotiation room exists.
- Crime grade is F in this area — have there been break-ins, vandalism, or insurance claims at this property in the last 3 years? What carrier currently insures it and at what premium?
- What's the average days-on-market for RENTAL listings here right now (not sales)? A rising rental-DOM trend means longer vacancies and softer asking-rent achievability than the comps imply.
- What's the recent tenant-quality profile in this submarket — average credit score on applications, eviction rate, late-payment / NSF rate, and stable-employment percentage? A property-management company in the area should have these aggregated.
- How much new apartment / multifamily construction is in the pipeline within 1–3 miles? Heavy new supply (>2% of stock underway) typically softens rents 12–24 months out; light construction supports rent growth.
Investment metrics
- 1% rule
- 1.19% ✓
- Cap rate
- 10.19%
- Cash-on-cash
- 13.91%
- DSCR
- 1.62
- GRM
- 7.0
CMA / ARV
- ARV (on-the-fly)
- $254,000
- Comps found
- 12
Show comp detail 12 sales within ~0.75 mi
| Address | Dist | Beds/Ba | Sqft | Sold | Price | $/sf | Match |
|---|---|---|---|---|---|---|---|
| 74-76 Phillip Ct | 0.01mi | 4/2.0 (-1) | 1,920 (-4%) | 1mo | $240,000 | $125 | 82 |
| 3521 23 Kings Dr | 0.32mi | 5/4.0 | 1,996 (-0%) | 3mo | $354,000 | $177 | 78 |
| 3509-3511 Jupiter Dr | 0.19mi | 5/3.0 | 2,250 (+12%) | 2mo | $263,000 | $117 | 69 |
| 2724 26 Pakenham Dr | 0.50mi | 5/3.0 | 1,966 (-2%) | 8mo | $249,000 | $127 | 67 |
| 3705-07 Juno Dr | 0.23mi | 6/4.0 (+1) | 2,085 (+4%) | 10mo | $350,000 | $168 | 65 |
| 8512 14 Valor Dr | 0.28mi | 4/2.0 (-1) | 1,933 (-3%) | 11mo | $250,000 | $129 | 63 |
| 4005-07 Jupiter Dr | 0.48mi | 5/2.5 | 2,048 (+2%) | 11mo | $230,000 | $112 | 62 |
| 9109 Atreus St | 0.53mi | 4/3.5 (-1) | 1,980 (-1%) | 9mo | $170,000 | $86 | 59 |
| 9025-27 Atreus St | 0.52mi | 4/4.0 (-1) | 2,000 (0%) | 14mo | $196,000 | $98 | 55 |
| 4017-19 Jupiter Dr | 0.50mi | 4/2.0 (-1) | 1,804 (-10%) | 11mo | $207,000 | $115 | 42 |
| 3817 19 Juno Dr | 0.34mi | 4/2.0 (-1) | 1,700 (-15%) | 14mo | $255,000 | $150 | 39 |
| 9101-9103 Atreus St | 0.52mi | 4/4.0 (-1) | 1,700 (-15%) | 11mo | $243,500 | $143 | 32 |
Match score weights: distance 35% · size 25% · config 20% · recency 20%. Top-matched comps best support the ARV.
Projected returns pro-forma
-3.0% appreciation · 3.11% rent growth · sell at horizon
- IRR
- 2.7%
- Equity multiple
- 1.10×
- Total profit
- $7,189
- Equity at exit
- $37,127
- IRR
- 12.3%
- Equity multiple
- 1.98×
- Total profit
- $68,335
- Equity at exit
- $21,529
Cash invested: $69,720 (down + closing). Projections, not guarantees.
Landlord ↔ Tenant lean methodology
- Overall (STATE)
- 90 Strongly Landlord-Friendly
- State Louisiana
- 90 Strongly Landlord-Friendly · R+12
- County
- — inherits STATE
- City
- — inherits STATE
ZIP-level market 70043
- Rents YoY
- 3.1%
- Active inventory
- 209
- Price-to-rent
- 14.4×
Monthly cashflow live
- Estimated rent
- $2,973 high interval (Pro) →
- Mortgage (P&I)
- −$1,306
- Tax from tax record
- −$131 /mo · $1,573/yr
- Insurance
- −$104
- Flood insurance flood zone
- −$66 /mo · $798/yr
- HOA
- −$0
- Vacancy / Maint / Mgmt
- −$624
- Net cashflow
- $742
Break-even live
2-unit breakdown (identical units grouped — click to expand)
| Units | Beds | Baths | Est. rent |
|---|---|---|---|
| 1× unit | 2 | 1 | $1,445 |
| 1× unit | 3 | 2 | $1,528 |
| Total (2 units) | $2,973 | ||
UW: 25.0% down · 7.5% · 30yr · 1.5% tax · 5.0% vac · 8.0% maint · 8.0% mgmt
Financing live
Cash to close
- Down payment
- $62,250
- Closing costs
- $7,470
- Reserves months
- —
- Total cash needed
- —
Loan-product check · same deal, 3 products live
Conventional
25% down · 7.5% · 30yr
- Down + closing
- —
- Monthly P&I
- —
- Monthly cashflow
- —
- DSCR
- —
- Eligible?
- —
Personal DTI + credit; lowest rate.
DSCR
20% down · 8.5% · 30yr
- Down + closing
- —
- Monthly P&I
- —
- Monthly cashflow
- —
- DSCR
- —
- Eligible?
- —
No personal income docs; deal must DSCR.
Hard money
10% down · 12.0% · 12mo
- Down + closing
- —
- Monthly P&I
- —
- Monthly cashflow
- —
- DSCR
- —
- Eligible?
- —
Short-term bridge; refi at stabilization.
Rent comps 1 comps
| Address | Beds | Baths | Sqft | Rent | $/sqft | DOM | Units | Dist |
|---|---|---|---|---|---|---|---|---|
| 7532 Patricia St Arabi, LA | 4.0 | 3.0 | 2099 | $2,200 | $1.05 | 43d | 1 | 1.40mi |
Listing history 11 events
-
2026-06-18days on market $249,000 Active 16 DOM
-
2026-06-17days on market $249,000 Active 15 DOM
-
2026-06-16days on market $249,000 Active 14 DOM
-
2026-06-15days on market $249,000 Active 13 DOM
-
2026-06-13days on market $249,000 Active 11 DOM
-
2026-06-10days on market $249,000 Active 8 DOM
-
2026-06-09days on market $249,000 Active 7 DOM
-
2026-06-08days on market $249,000 Active 6 DOM
-
2026-06-07days on market $249,000 Active 5 DOM
-
2026-06-03remarks 255-char remark
Show marketing remark (254 chars)
Long term tenants. Well maintained. 2 bedrooms, one bath in the front unit and 3 bedrooms, 2 baths in rear unit. Great investment or live on one side and earn income from the other unit. Flood zone X means very low flood insurance.Must see to appreciate.
-
2026-06-03$249,000 Active 1 DOM
Show marketing remark (254 chars)
Long term tenants. Well maintained. 2 bedrooms, one bath in the front unit and 3 bedrooms, 2 baths in rear unit. Great investment or live on one side and earn income from the other unit. Flood zone X means very low flood insurance.Must see to appreciate.
ⓘ Source: listings_history table (triggers on properties + properties_extension) + one-shot
backfill from property_details.listing_events for pre-trigger history.
Tax reassessment forecast LA · Resets to sale price
- Current annual tax
- $1,573 · $131/mo
- Projected year-2 tax
- $1,573 · $131/mo
- Expected delta
- $0/yr ($0/mo · 0.0%)
ⓘ Screening estimate from a state-policy table — verify with the county assessor before closing.
Climate risk First Street
- Flood 8/10 Severe FEMA zone X (shaded) · 60% chance over 30 yrs
- Wildfire 1/10 Low
- Heat 10/10 Extreme 7 d/yr ≥108°F today · 21 d/yr by 30 yrs out
- Wind 10/10 Extreme 99% chance of damaging wind over 30 yrs
- Air quality 3/10 Moderate 3 unhealthy d/yr today · 3 by 30 yrs out
Nearby sold comps map
Loading sold comps map…
Walkable amenities ~0.75 mi
Loading nearby amenities…
Taxation est. · year 1
- Rental income
- $35,676
- − Mortgage interest
- −$13,948
- − Property taxes
- −$1,573
- − Insurance
- −$2,042
- − Repairs & maintenance
- −$2,854
- − Management
- −$2,854
- − Depreciation
- −$7,244
- Taxable income
- $5,161
- Est. tax owed @ 24.0%
- −$1,239
- After-tax cash flow
- $7,661/yr
For passive investors: Depreciation is non-cash, so a rental often shows a tax loss while cash-flowing — sheltering income. Rental losses are passive: they offset passive income freely, and up to $25,000/yr can offset ordinary (W-2) income if you actively participate and your MAGI is under $100k (phasing out to $0 by $150k); unused losses carry forward. On sale, claimed depreciation is recaptured at up to 25%, and gains may owe capital-gains tax (a 1031 exchange can defer both). Figures are a year-1 estimate at your 24.0% rate — not tax advice; consult a CPA.
Schools (NCES district)
No district data.
Livability — Chalmette
- Score
- 65/100
- State rank
- #137
- US rank
- #12500
Category grades
Schools grade is shown separately in the Schools card above.
Census & demographics
- Census place
- Chalmette, LA
- County
- Saint Bernard Parish · 22,638 people
- City population
- 22,638
- Metro
- New Orleans-Metairie, LA
- Population (ZIP)
- 22,638
- Household income
- $55,068
- Rent vs Own
- Severe rent burden
- 881.0
Population outlook (St. Bernard County) Hauer SSP2
- Today (2025)
- 66,513 people
- By 2030
- 77,768 · +16.9%
- By 2040
- 101,296 · +52.3%
- By 2050
- 125,770 · +89.1%
- By 2075
- 188,160 · +182.9%
- By 2100
- 239,339 · +259.8%
Race, ethnicity, and origin ACS 2023
- Neighborhood character
- Diverse neighborhood (Simpson 0.61)
- Race & ethnicity
- White 55% Black 26% Hispanic / Latino 12% Two or more races 10% Asian 2%
- Hispanic origin (detail)
- Mexican 2%
- Common ancestry
- Lithuanian 13% Slovak 2%
- Foreign-born
- 6% · Canada, Vietnam
- Languages at home
- 88% English-only · Spanish 8% Arabic 1% Vietnamese 1%
Political lean MEDSL · St. Bernard
- 2024 margin
- Strong R (+29.3) · D 34.5% · R 63.8% · Other 1.7%
- 2008→2024 swing
- +16.1pp toward D · 2008: -45.4pp · 2024: -29.3pp
- All cycles
- 2024: R+29.3 2020: R+28.5 2016: R+33.4 2012: R+24.7 2008: R+45.4
Not yet ingested
- Civics
- —
Market trends
- HPI YoY
- ▼ -211.77%
- Current HPI
- 194.8123
- Rent YoY
- ▲ 3.11%
- Metro
- New Orleans-Metairie, LA
- State GDP YoY
- ▲ 3.29%
- F500 in state
- 10
Industry mix (Fortune 500 HQ in LA)
| Industry | F500 HQs | Revenue |
|---|---|---|
| Telecommunications | 2 | $23B |
|
||
| Utilities | 1 | $12B |
|
||
| Wholesale / Distribution | 1 | $5B |
|
||
| Advertising | 1 | $2B |
|
||
Price history
+352.7% since first listed4 events — show timeline
- 2026-06-03 Listed $249,000 AcadianaMLS
- 2026-06-03 Listed $240,000 GSREIN
- 2026-06-03 Price Changed $249,000 GSREIN
- 2007-04-23 Sold (Public Records) $55,000 Public Records
Property tax history
+1.0%/yrLatest (2025): $1,573 · -0.7% YoY. Source: county tax records.
Cash-flow waterfall
monthlySold comps — $/sqft
last 12 mo · ≤1 miLoading sold comps…