 5-Plex
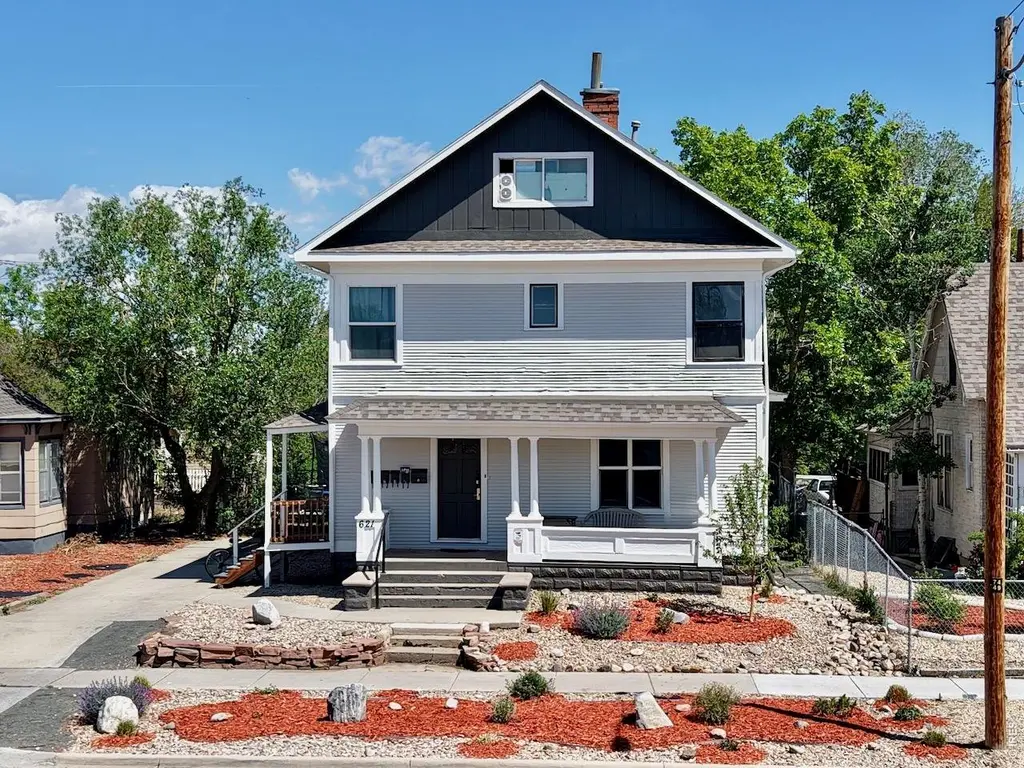
621 13th St · Greeley, CO
Flood risk 1/10 · Minimal
- FEMA flood zone
- X (unshaded)
- Chance of flooding over 30 yrs
- 0.0%
- Est. flood insurance / yr
- $473 – $860
Fire risk 4/10 · Minor
- Est. fire insurance / yr
- $939 – $1,743
Heat risk 4/10 · Minor
- Hot days now (above 94°F)
- 8 days/yr
- Hot days in 30 yrs
- 20 days/yr
Wind risk 2/10 · Minimal
- Chance of severe wind over 30 yrs
- —
Air-quality risk 4/10 · Minor
- Unhealthy air days now
- 5 days/yr
- Unhealthy air days in 30 yrs
- 5 days/yr
Risk factors via First Street. Map © Google.
Why this score? — see what drove the B grade
The composite is a weighted blend of 9 inputs, each scored 0–100. Each bar is that input's sub-score; the figure is the points it added to the 100-point composite (weight × sub-score).
- Cash flow +30.0/30.0
- ARV discount +10.1/15.0
- 1% rule +10.0/10.0
- DSCR +10.0/10.0
- Livability +3.4/5.0
- Condition / age +2.5/5.0
- Rent growth +2.3/5.0
- Schools +2.0/10.0
- Appreciation +0.0/10.0
$575,000
🖨 Deal sheet 📄 Offer letter ✓ Due diligence
Multi-family units
County records classify this as Multi-Family (5+ Unit). Listing-text estimate: 5 units. confirmed
5+ unit building — per-unit beds/baths from public records are typically unavailable; the breakdown below (if shown) is an estimate from the listing text.
Listing remarks MLS
Fantastic Investment Opportunity. New roof and newer sewer line. All units currently occupied.
Key facts
- Fresh coat of paint
- Cash flowing
- Fully xeriscaped
Tags
Property features AI
Finance
- Other: Property zoned for multi-family; Not new construction; previously owned; No water rights
- Financial info: Five total units; Gross income reported: $70,233; Net operating income reported: $53,232; Income sources include rents/leases, forfeited deposits, and laundry
Exterior
- Utilities: City water (meter installed); Natural gas available (Atmos Gas); Electricity available
- Home design: Two-story duplex (residential income property)
- Construction: Frame construction with composition siding; Composition roof
- Exterior features: Sprinkler system; City street frontage; Minimal flood or C rating (low flood risk)
Interior
- Kitchen: All appliances included; Disposal
- Bedrooms: Five rental units total consisting of: one 1-bed unit, two 2-bed units, and two additional 1-bed units
- Bathrooms: Each unit includes one bathroom
- Heating & cooling: Forced-air heating; Wall/window air conditioning units
- Interior features: Window coverings; Fire alarm
- Laundry & utility: On-site laundry income (laundry listed as income source)
Neighborhood map
What this means for you Summary
Snapshot
- This is a 5 × 8-bed/5.0-bath units multifamily listed at $575k.
Deal economics
- At list price, monthly cash flow is $4k ($46k/yr) — positive. Per door: $773/mo.
- The deal already cash-flows at list — no discount required.
- Meets the 1% rule at list price ($9k rent vs $575k).
- Recommended offer: $558k (3.0% below list) — sets the bar for market timing.
- Cap rate 14.4% vs local median 3.3% in Greeley — top-decile yield for the area; either an underpriced asset or a hidden risk that comps aren't pricing in. Stress-test before assuming the spread holds.
Location & tenants
- Location reads 68/100 on livability (#115 in CO) — a middle-class / working-renter tenant base. Strengths: commute A+, housing A+, health & safety A; Watch: cost of living C-, crime F, amenities F.
- Greeleyschool District No. 6 In The County Of Weld And Sta (urban): math 15% / reading 31% proficiency, ranked #71 of 86 in CO (top 83%) — low school quality limits family demand, transient renter base, plan for 1-2y turnover.
- Zoned schools: Maplewood Elementary School (math 8% / reading 17%, grade F, #869 of 966 statewide, top 91%, 559 students, 91% FRL); Northridge High School (math 13% / reading 36%, grade F, #266 of 381 statewide, top 79%, 1,253 students, 64% FRL) — zoned schools average 77% FRL vs 54% district-wide (23 pts higher); higher-poverty schools than district average — tighter screening recommended.
- Market conditions: Rents soft (-0.7%/yr); 180 active listings in the ZIP; 4 comparable units currently listed for rent nearby; rentals at typical pace (median 23d on market — plan ~3-4 weeks tenant-placement turnaround); 3,170 units permitted in Weld County in 2024 (278 in 5+ unit buildings).
- At $9,354/mo this rent would consume 206% of the median local household income ($55k/yr) (locally 3061% of renters already pay >50% of income on rent) — very limited rent-growth headroom before tenants either downsize or default.
Forward outlook
- Local home prices are declining (-3.0%/yr); year-one equity from $4k of loan paydown is wiped out by about $17k of value loss. Plan a longer hold.
- Weld County population projected at +46% by 2050 — long-run rental-demand tailwind backs the buy-and-hold thesis.
- At projected returns (-3.0% appreciation + 0.0% rent growth), your $161k cash investment doubles in ~5 years — after that, you're playing with house money.
Negotiation context
- It's been on market 41 days — a 3% lower offer ($558k) is reasonable based on typical stale-listing flexibility.
- 8 sale attempts since 21y ago with the ask held roughly flat each time — persistent listings suggest the price (not the market) is what's stuck; bring a comps-based counter.
- Current owner paid $265k; list at $575k implies a 117% gain — meaningful room to come down on a strong offer.
Risks & watch-outs
- Watch-outs: built in 1900 — expect roof / HVAC / electrical / plumbing capex.
Questions for the listing agent
- It's been on market 41 days. Have you received any prior offers? Is the seller open to a 3% concession, seller financing, or rate buy-down credit?
- Can we see the unit-by-unit rent roll, current vacancy, and any below-market leases? What's the average tenancy length?
- What capital expenditures (roof, boiler, parking lot, exteriors) have been made in the last 5 years, and what's planned in the next 2?
- Built in 1900 — when were the roof, HVAC, electrical panel, plumbing, and water heater last replaced?
- Is there a deadline driving the sale (1031 exchange, divorce, estate, relocation)? That informs how much negotiation room exists.
- Schools are D-rated, which usually means shorter tenancies and higher turnover. Who's the typical renter profile here, and what's been the actual vacancy rate?
- Crime grade is F in this area — have there been break-ins, vandalism, or insurance claims at this property in the last 3 years? What carrier currently insures it and at what premium?
- What's the average days-on-market for RENTAL listings here right now (not sales)? A rising rental-DOM trend means longer vacancies and softer asking-rent achievability than the comps imply.
- What's the recent tenant-quality profile in this submarket — average credit score on applications, eviction rate, late-payment / NSF rate, and stable-employment percentage? A property-management company in the area should have these aggregated.
- How much new apartment / multifamily construction is in the pipeline within 1–3 miles? Heavy new supply (>2% of stock underway) typically softens rents 12–24 months out; light construction supports rent growth.
Investment metrics
- 1% rule
- 1.63% ✓
- Cap rate
- 14.36%
- Cash-on-cash
- 28.81%
- DSCR
- 2.28
- GRM
- 5.1
CMA / ARV
- ARV (on-the-fly)
- $610,812
- Comps found
- 2
Show comp detail 2 sales within ~0.75 mi
| Address | Dist | Beds/Ba | Sqft | Sold | Price | $/sf | Match |
|---|---|---|---|---|---|---|---|
| 1824 7th Ave | 0.67mi | 6/4.0 (+1) | 3,223 (-10%) | 22mo | $551,000 | $171 | 25 |
| 1822 7th Ave | 0.66mi | 5/1.0 | 3,041 (-15%) | 24mo | $397,902 | $131 | 9 |
Match score weights: distance 35% · size 25% · config 20% · recency 20%. Top-matched comps best support the ARV.
Projected returns pro-forma
-3.0% appreciation · 0.0% rent growth · sell at horizon
- IRR
- 19.9%
- Equity multiple
- 1.78×
- Total profit
- $125,483
- Equity at exit
- $85,734
- IRR
- 26.1%
- Equity multiple
- 2.99×
- Total profit
- $319,808
- Equity at exit
- $49,715
Cash invested: $161,000 (down + closing). Projections, not guarantees.
Landlord ↔ Tenant lean methodology
- Overall (STATE)
- 38 Tenant-Leaning
- State Colorado
- 38 Tenant-Leaning · D+4
- County
- — inherits STATE
- City
- — inherits STATE
ZIP-level market 80631
- Rents YoY
- -0.7%
- Active inventory
- 180
- Price-to-rent
- 25.6×
Monthly cashflow live
- Estimated rent
- $9,354 medium interval (Pro) →
- Mortgage (P&I)
- −$3,015
- Tax from tax record
- −$269 /mo · $3,229/yr
- Insurance
- −$240
- HOA
- −$0
- Vacancy / Maint / Mgmt
- −$1,964
- Net cashflow
- $3,866
Break-even live
5-unit breakdown (identical units grouped — click to expand)
| Units | Beds | Baths | Est. rent |
|---|---|---|---|
| 5× units | 8 | 5 | $9,355 |
| #1 | 8 | 5 | $1,871 |
| #2 | 8 | 5 | $1,871 |
| #3 | 8 | 5 | $1,871 |
| #4 | 8 | 5 | $1,871 |
| #5 | 8 | 5 | $1,871 |
| Total (5 units) | $9,354 | ||
UW: 25.0% down · 7.5% · 30yr · 1.5% tax · 5.0% vac · 8.0% maint · 8.0% mgmt
Financing live
Cash to close
- Down payment
- $143,750
- Closing costs
- $17,250
- Reserves months
- —
- Total cash needed
- —
Loan-product check · same deal, 3 products live
Conventional
25% down · 7.5% · 30yr
- Down + closing
- —
- Monthly P&I
- —
- Monthly cashflow
- —
- DSCR
- —
- Eligible?
- —
Personal DTI + credit; lowest rate.
DSCR
20% down · 8.5% · 30yr
- Down + closing
- —
- Monthly P&I
- —
- Monthly cashflow
- —
- DSCR
- —
- Eligible?
- —
No personal income docs; deal must DSCR.
Hard money
10% down · 12.0% · 12mo
- Down + closing
- —
- Monthly P&I
- —
- Monthly cashflow
- —
- DSCR
- —
- Eligible?
- —
Short-term bridge; refi at stabilization.
Rent comps 4 comps
| Address | Beds | Baths | Sqft | Rent | $/sqft | DOM | Units | Dist |
|---|---|---|---|---|---|---|---|---|
| 1614 8th Ave Greeley, CO | 6.0 | 3.0 | 2615 | $3,150 | $1.20 | 13d | 1 | 0.43mi |
| 1121 15th St Greeley, CO | 6.0 | 2.0 | 2498 | $3,390 | $1.36 | 23d | 1 | 0.54mi |
| 1229 12th St Greeley, CO | 4.0 | 2.0 | 2966 | $2,395 | $0.81 | 13d | 1 | 0.62mi |
| 1031 20th St Greeley, CO | 3.0–6.0 | 1.0–3.0 | 2309 | $2,745 | $1.19 | 23d | 2 | 0.97mi |
Listing history 34 events
-
2026-06-18days on market $575,000 Active 41 DOM
-
2026-06-17days on market $575,000 Active 40 DOM
-
2026-06-16days on market $575,000 Active 39 DOM
-
2026-06-15days on market $575,000 Active 38 DOM
-
2026-06-14days on market $575,000 Active 36 DOM
-
2026-06-10days on market $575,000 Active 33 DOM
-
2026-06-09days on market $575,000 Active 32 DOM
-
2026-06-08days on market $575,000 Active 31 DOM
-
2026-06-07days on market $575,000 Active 30 DOM
-
2026-06-03days on market $575,000 Active 26 DOM
-
2026-06-02days on market $575,000 Active 25 DOM
-
2026-06-01days on market $575,000 Active 24 DOM
-
2026-05-31days on market $575,000 Active 23 DOM
-
2026-05-30days on market $575,000 Active 22 DOM
-
2026-05-08$575,000 Active
-
2017-06-12soldstatus $265,000
-
2017-06-09soldstatus $265,000 Sold 94-char remark
Show marketing remark (94 chars)
Fantastic Investment Opportunity. New roof and newer sewer line. All units currently occupied.
-
2017-06-09soldstatus $265,000 Sold 94-char remark
Show marketing remark (94 chars)
Fantastic Investment Opportunity. New roof and newer sewer line. All units currently occupied.
-
2017-04-06status Under Contract 94-char remark
Show marketing remark (94 chars)
Fantastic Investment Opportunity. New roof and newer sewer line. All units currently occupied.
-
2017-04-06status Pending 94-char remark
Show marketing remark (94 chars)
Fantastic Investment Opportunity. New roof and newer sewer line. All units currently occupied.
-
2017-03-31$265,000 Active 94-char remark
Show marketing remark (94 chars)
Fantastic Investment Opportunity. New roof and newer sewer line. All units currently occupied.
-
2017-03-04status Active 94-char remark
Show marketing remark (94 chars)
Fantastic Investment Opportunity. New roof and newer sewer line. All units currently occupied.
-
2017-02-25status Under Contract 94-char remark
Show marketing remark (94 chars)
Fantastic Investment Opportunity. New roof and newer sewer line. All units currently occupied.
-
2017-02-22status Active 94-char remark
Show marketing remark (94 chars)
Fantastic Investment Opportunity. New roof and newer sewer line. All units currently occupied.
-
2017-02-09status Under Contract 94-char remark
Show marketing remark (94 chars)
Fantastic Investment Opportunity. New roof and newer sewer line. All units currently occupied.
-
2017-02-04$265,000 Active 94-char remark
Show marketing remark (94 chars)
Fantastic Investment Opportunity. New roof and newer sewer line. All units currently occupied.
-
2010-10-14historical
-
2009-06-25$185,000
-
2008-01-14historical
-
2007-05-23$198,800
-
2005-09-30soldstatus $216,900
-
2005-09-28soldstatus $216,900
-
2005-07-27$216,900
-
1992-08-12soldstatus $60,000
ⓘ Source: listings_history table (triggers on properties + properties_extension) + one-shot
backfill from property_details.listing_events for pre-trigger history.
Tax reassessment forecast CO · Resets to sale price
- Current annual tax
- $3,229 · $269/mo
- Projected year-2 tax
- $3,229 · $269/mo
- Expected delta
- $0/yr ($0/mo · 0.0%)
ⓘ Screening estimate from a state-policy table — verify with the county assessor before closing.
Climate risk First Street
- Flood 1/10 Low FEMA zone X (unshaded) · 0% chance over 30 yrs
- Wildfire 4/10 Moderate
- Heat 4/10 Moderate 8 d/yr ≥94°F today · 20 d/yr by 30 yrs out
- Wind 2/10 Low
- Air quality 4/10 Moderate 5 unhealthy d/yr today · 5 by 30 yrs out
Nearby sold comps map
Loading sold comps map…
Walkable amenities ~0.75 mi
Loading nearby amenities…
Taxation est. · year 1
- Rental income
- $112,248
- − Mortgage interest
- −$32,209
- − Property taxes
- −$3,229
- − Insurance
- −$2,875
- − Repairs & maintenance
- −$8,980
- − Management
- −$8,980
- − Depreciation
- −$16,727
- Taxable income
- $39,248
- Est. tax owed @ 24.0%
- −$9,420
- After-tax cash flow
- $36,968/yr
For passive investors: Depreciation is non-cash, so a rental often shows a tax loss while cash-flowing — sheltering income. Rental losses are passive: they offset passive income freely, and up to $25,000/yr can offset ordinary (W-2) income if you actively participate and your MAGI is under $100k (phasing out to $0 by $150k); unused losses carry forward. On sale, claimed depreciation is recaptured at up to 25%, and gains may owe capital-gains tax (a 1031 exchange can defer both). Figures are a year-1 estimate at your 24.0% rate — not tax advice; consult a CPA.
Schools (NCES district)
- District
- Greeleyschool District No. 6 In The County Of Weld And Sta
- NCES district ID
- 0804410
- Math proficiency
- 15% ▼ -7.00%
- Reading proficiency
- 31% ▼ -4.00%
- Median HH income
- $46,417
- Composite
- 19.99/100
- National rank
- #8667
- State rank
- #71 of 86 in CO
Livability — Greeley
- Score
- 68/100
- State rank
- #115
- US rank
- #9841
Category grades
Schools grade is shown separately in the Schools card above.
Census & demographics
- Census place
- Greeley, CO
- County
- Weld County · 332,652 people
- City population
- 119,344
- Metro
- Greeley, CO
- Population (ZIP)
- 53,722
- Household income
- $54,591
- Rent vs Own
- Severe rent burden
- 3061.0
Population outlook (Weld County) Hauer SSP2
- Today (2025)
- 351,957 people
- By 2030
- 385,304 · +9.5%
- By 2040
- 451,818 · +28.4%
- By 2050
- 514,478 · +46.2%
- By 2075
- 648,733 · +84.3%
- By 2100
- 720,400 · +104.7%
Race, ethnicity, and origin ACS 2023
- Neighborhood character
- Diverse neighborhood (Simpson 0.55)
- Race & ethnicity
- Hispanic / Latino 54% White 39% Two or more races 15% Black 3% Native American 2% Asian 1%
- Hispanic origin (detail)
- Mexican 45%
- Common ancestry
- Italian 2% Slovak 2% Portuguese 2%
- Foreign-born
- 19% · Canada, Philippines
- Languages at home
- 65% English-only · Spanish 33%
Political lean MEDSL · Weld
- 2024 margin
- Strong R (+21.0) · D 38.2% · R 59.2% · Other 2.6%
- 2008→2024 swing
- -12.2pp toward R · 2008: -8.7pp · 2024: -21.0pp
- All cycles
- 2024: R+21.0 2020: R+18.0 2016: R+22.4 2012: R+13.2 2008: R+8.7
Not yet ingested
- Civics
- —
Market trends
- HPI YoY
- ▼ -329.59%
- Current HPI
- 295.4309
- Rent YoY
- ▼ -0.65%
- Metro
- Greeley, CO
- State GDP YoY
- ▲ 1.95%
- F500 in state
- 14
Industry mix (Fortune 500 HQ in CO)
| Industry | F500 HQs | Revenue |
|---|---|---|
| Technology Distribution | 1 | $31B |
|
||
| Food / Agriculture | 1 | $18B |
|
||
| Packaging | 1 | $14B |
|
||
| Healthcare | 1 | $13B |
|
||
| Energy | 1 | $10B |
|
||
| Technology | 1 | $4B |
|
||
Price history
+858.3% since first listed20 events — show timeline
- 2026-05-08 Listed $575,000 IRES
- 2017-06-12 Sold (Public Records) $265,000 Public Records
- 2017-06-09 Sold (MLS) $265,000 REColorado as Distributed by MLS Grid
- 2017-06-09 Sold (MLS) $265,000 IRES
- 2017-04-06 Pending — REColorado as Distributed by MLS Grid
- 2017-04-06 Pending — IRES
- 2017-03-31 Listed $265,000 IRES
- 2017-03-04 Relisted — REColorado as Distributed by MLS Grid
- 2017-02-25 Pending — REColorado as Distributed by MLS Grid
- 2017-02-22 Relisted — REColorado as Distributed by MLS Grid
- 2017-02-09 Pending — REColorado as Distributed by MLS Grid
- 2017-02-04 Listed $265,000 REColorado as Distributed by MLS Grid
- 2010-10-14 Listing Removed — IRES
- 2009-06-25 Listed $185,000 IRES
- 2008-01-14 Listing Removed — IRES
- 2007-05-23 Listed $198,800 IRES
- 2005-09-30 Sold (Public Records) $216,900 Public Records
- 2005-09-28 Sold (MLS) $216,900 IRES
- 2005-07-27 Listed $216,900 IRES
- 1992-08-12 Sold (Public Records) $60,000 Public Records
Property tax history
+6.7%/yrLatest (2025): $3,229 · +10.7% YoY. Source: county tax records.
Cash-flow waterfall
monthlySold comps — $/sqft
last 12 mo · ≤1 miLoading sold comps…