8091 Carriage Ln · Morley, MI
Flood risk 3/10 · Minor
- FEMA flood zone
- X (unshaded)
- Chance of flooding over 30 yrs
- 0.2%
- Est. flood insurance / yr
- $507 – $1,088
Fire risk 3/10 · Minor
- Est. fire insurance / yr
- $784 – $1,456
Heat risk 2/10 · Minimal
- Hot days now (above 95°F)
- 7 days/yr
- Hot days in 30 yrs
- 15 days/yr
Wind risk 1/10 · Minimal
- Chance of severe wind over 30 yrs
- —
Air-quality risk 2/10 · Minimal
- Unhealthy air days now
- 1 days/yr
- Unhealthy air days in 30 yrs
- 1 days/yr
Risk factors via First Street. Map © Google.
Why this score? — see what drove the B- grade
The composite is a weighted blend of 9 inputs, each scored 0–100. Each bar is that input's sub-score; the figure is the points it added to the 100-point composite (weight × sub-score).
- Cash flow +30.0/30.0
- 1% rule +10.0/10.0
- DSCR +10.0/10.0
- ARV discount +7.5/15.0
- Livability +3.0/5.0
- Rent growth +2.5/5.0
- Schools +2.4/10.0
- Condition / age +2.2/5.0
- Appreciation +0.0/10.0
$55,000
🖨 Deal sheet 📄 Offer letter ✓ Due diligence
Listing remarks MLS
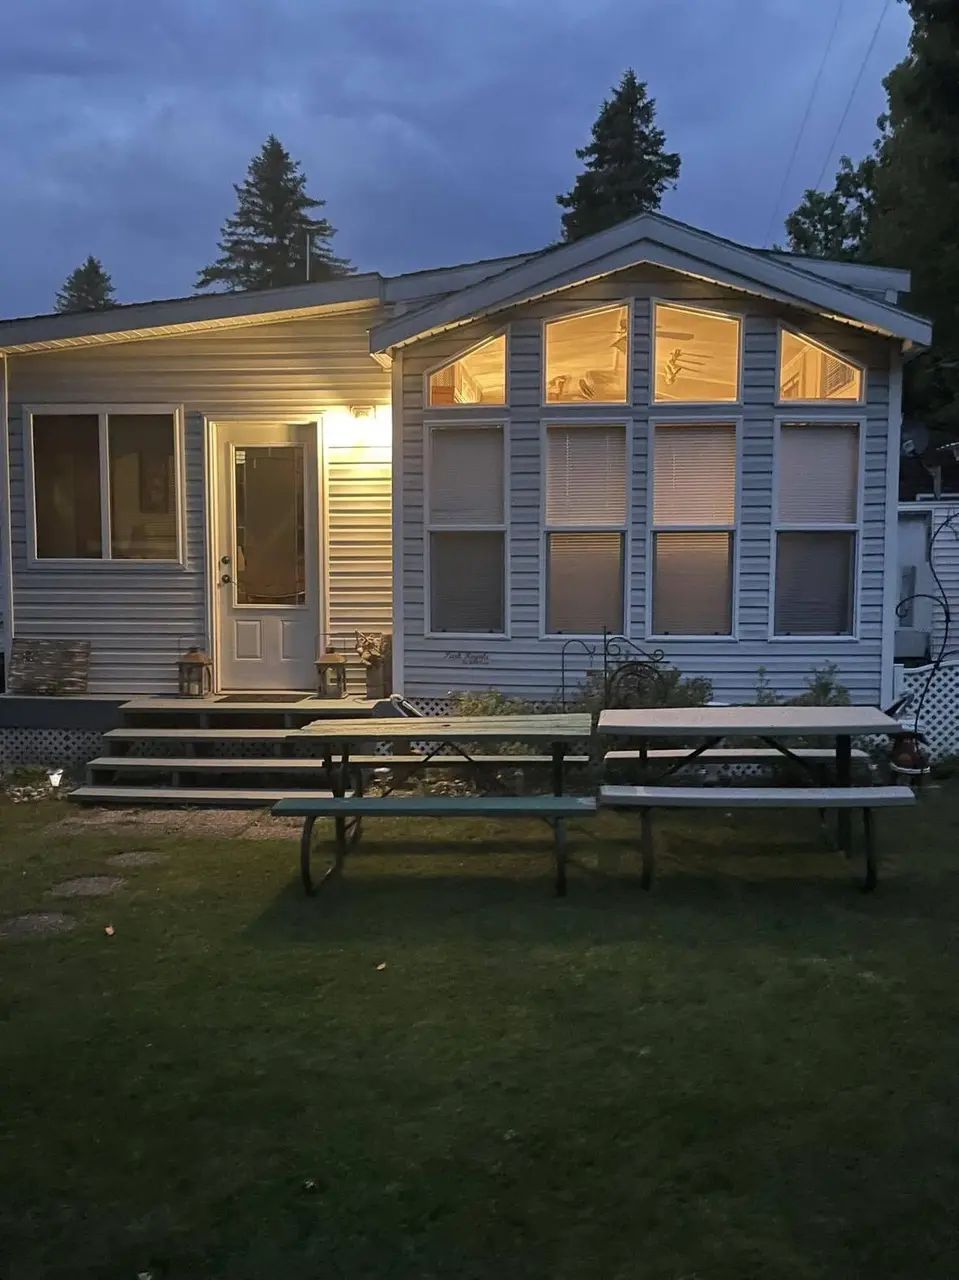
8091 Carriage Lane is a vacant piece of land. Park Model is in the Canadian Lakes Campground that is private, you need to own land to have a camper or park model in there. There are association dues on the land around 880.00 annually, around 850.00 for campground, which includes electric and mowing, and 150.00 to leave it at the campground annually. You also can get 30 extra days after park closes anytime in the winter, there is no water, but they will turn electric on. Campground d is open April 1st(weather permitting) to Oct 31st(weather permitting). Association includes fitness place, golfing, parks, beaches, pools, so much to do in the community. Tons to do in the campground as well, water, sewer, electric included, bathhouses, play areas. Park Model has one bedroom, one bathroom, living room, dining area, deck, porch, larger sewer tank and gray water tank, wifi is wired
Key facts
- 0.55 acre lot
- Built 2006
- Listed 16 days
Property features AI
Finance
- Other: Living area approximately 744; Lot size approximately 0.55 acres; Property located in Canadian Lakes campground lot (use GPS directions provided)
- HOA & community: Association with an annual fee of $1,000 (includes electricity)
Exterior
- Utilities: Electricity available; High-speed internet available; No public sewer; No water source
- Home design: Residential property; Other architectural style; Built in 2006
- Construction: Vinyl siding; Composition and flat roof
- Exterior features: Shed(s); Paved road access
Interior
- Kitchen: Microwave; Range; Refrigerator
- Bedrooms: Primary bedroom
- Bathrooms: 1 full bathroom
- Heating & cooling: Forced air heating; Window unit(s) for cooling
- Interior features: Eat-in kitchen; Fireplace; Total of 5 rooms
- Laundry & utility: Electric water heater
Neighborhood map
What this means for you Summary
Snapshot
- This is a 1-bed/1.0-bath manufactured listed at $55k. Condition is rated fair.
Deal economics
- At list price, monthly cash flow is $630 ($8k/yr) — positive.
- The deal already cash-flows at list — no discount required.
- Meets the 1% rule at list price ($1k rent vs $55k).
- Recommended offer: $54k (1.5% below list) — sets the bar for market timing.
Location & tenants
- Location reads 60/100 on livability (#586 in MI) — a middle-class / working-renter tenant base. Strengths: cost of living A+, housing A+; Watch: schools F, crime F, amenities F.
- Morley Stanwood Community Schools (rural): math 24% / reading 33% proficiency, ranked #390 of 540 in MI (top 72%) — low school quality limits family demand, transient renter base, plan for 1-2y turnover.
- Market conditions: 24 active listings in the ZIP; 116 units permitted in Mecosta County in 2024 (0 in 5+ unit buildings).
Forward outlook
- Local home prices are declining (-3.0%/yr); year-one equity from $380 of loan paydown is wiped out by about $2k of value loss. Plan a longer hold.
- Mecosta County population projected to shrink 9% by 2050 — rents likely to lag national; underwrite the cash flow, not the appreciation.
- At projected returns (-3.0% appreciation + 3.0% rent growth), your $15k cash investment doubles in ~3 years — after that, you're playing with house money.
Negotiation context
- It's been on market 17 days — a 2% lower offer ($54k) is reasonable based on typical stale-listing flexibility.
- 5 sale attempts since 2y ago with the ask held roughly flat each time — persistent listings suggest the price (not the market) is what's stuck; bring a comps-based counter.
Questions for the listing agent
- Have any recent inspections been done? Can we get a copy of the seller's disclosures and any deferred-maintenance estimates?
- What does the HOA fee cover, when was the last increase, and are there any pending special assessments or reserve-fund shortfalls?
- Is there a deadline driving the sale (1031 exchange, divorce, estate, relocation)? That informs how much negotiation room exists.
- Schools are F-rated, which usually means shorter tenancies and higher turnover. Who's the typical renter profile here, and what's been the actual vacancy rate?
- Crime grade is F in this area — have there been break-ins, vandalism, or insurance claims at this property in the last 3 years? What carrier currently insures it and at what premium?
- What's the average days-on-market for RENTAL listings here right now (not sales)? A rising rental-DOM trend means longer vacancies and softer asking-rent achievability than the comps imply.
- What's the recent tenant-quality profile in this submarket — average credit score on applications, eviction rate, late-payment / NSF rate, and stable-employment percentage? A property-management company in the area should have these aggregated.
- How much new for-sale + rental construction is in the pipeline within 1–3 miles? Heavy new supply typically softens prices + rents 12–24 months out; constrained supply supports both.
Investment metrics
- 1% rule
- 2.52% ✓
- Cap rate
- 20.04%
- Cash-on-cash
- 49.11%
- DSCR
- 3.19
- GRM
- 3.3
CMA / ARV
No comps found within radius.
Projected returns pro-forma
-3.0% appreciation · 3.0% rent growth · sell at horizon
- IRR
- 46.8%
- Equity multiple
- 3.03×
- Total profit
- $31,298
- Equity at exit
- $8,201
- IRR
- 52.5%
- Equity multiple
- 6.14×
- Total profit
- $79,231
- Equity at exit
- $4,755
Cash invested: $15,400 (down + closing). Projections, not guarantees.
Landlord ↔ Tenant lean methodology
- Overall (STATE)
- 62 Landlord-Friendly
- State Michigan
- 62 Landlord-Friendly · EVEN
- County
- — inherits STATE
- City
- — inherits STATE
ZIP-level market 49336
- Home prices YoY
- -11.7%
- Active inventory
- 24
- Price-to-rent
- 3.3×
Monthly cashflow live
- Estimated rent
- $1,384 medium interval (Pro) →
- Mortgage (P&I)
- −$288
- Tax est. 1.5%
- −$69 /mo · $825/yr
- Insurance
- −$23
- HOA
- −$83
- Vacancy / Maint / Mgmt
- −$291
- Net cashflow
- $630
Break-even live
UW: 25.0% down · 7.5% · 30yr · 1.5% tax · 5.0% vac · 8.0% maint · 8.0% mgmt
Financing live
Cash to close
- Down payment
- $13,750
- Closing costs
- $1,650
- Reserves months
- —
- Total cash needed
- —
Loan-product check · same deal, 3 products live
Conventional
25% down · 7.5% · 30yr
- Down + closing
- —
- Monthly P&I
- —
- Monthly cashflow
- —
- DSCR
- —
- Eligible?
- —
Personal DTI + credit; lowest rate.
DSCR
20% down · 8.5% · 30yr
- Down + closing
- —
- Monthly P&I
- —
- Monthly cashflow
- —
- DSCR
- —
- Eligible?
- —
No personal income docs; deal must DSCR.
Hard money
10% down · 12.0% · 12mo
- Down + closing
- —
- Monthly P&I
- —
- Monthly cashflow
- —
- DSCR
- —
- Eligible?
- —
Short-term bridge; refi at stabilization.
HOA detail
- Monthly dues
- $83 · $996/yr
- Likely covers
- watersewerelectricinternetpool
Listing history 14 events
-
2026-06-19days on market $55,000 Active 17 DOM
-
2026-06-18days on market $55,000 Active 16 DOM
-
2026-06-17days on market $55,000 Active 15 DOM
-
2026-06-16days on market $55,000 Active 14 DOM
-
2026-06-15days on market $55,000 Active 13 DOM
-
2026-06-14days on market $55,000 Active 11 DOM
-
2026-06-12days on market $55,000 Active 10 DOM
-
2026-06-09days on market $55,000 Active 7 DOM
-
2026-06-08days on market $55,000 Active 6 DOM
-
2026-06-07days on market $55,000 Active 5 DOM
-
2026-06-05days on market $55,000 Active 3 DOM
-
2026-06-05days on market $55,000 Active 2 DOM
-
2026-06-03remarks 699-char remark
-
2026-06-03$55,000 Active 1 DOM
ⓘ Source: listings_history table (triggers on properties + properties_extension) + one-shot
backfill from property_details.listing_events for pre-trigger history.
Climate risk First Street
- Flood 3/10 Moderate FEMA zone X (unshaded) · 20% chance over 30 yrs
- Wildfire 3/10 Moderate
- Heat 2/10 Low 7 d/yr ≥95°F today · 15 d/yr by 30 yrs out
- Wind 1/10 Low
- Air quality 2/10 Low 1 unhealthy d/yr today · 1 by 30 yrs out
Nearby sold comps map
Loading sold comps map…
Walkable amenities ~0.75 mi
Loading nearby amenities…
Taxation est. · year 1
- Rental income
- $16,607
- − Mortgage interest
- −$3,081
- − Property taxes
- −$825
- − Insurance
- −$275
- − Repairs & maintenance
- −$1,329
- − Management
- −$1,329
- − HOA
- −$996
- − Depreciation
- −$1,600
- Taxable income
- $7,173
- Est. tax owed @ 24.0%
- −$1,722
- After-tax cash flow
- $5,841/yr
For passive investors: Depreciation is non-cash, so a rental often shows a tax loss while cash-flowing — sheltering income. Rental losses are passive: they offset passive income freely, and up to $25,000/yr can offset ordinary (W-2) income if you actively participate and your MAGI is under $100k (phasing out to $0 by $150k); unused losses carry forward. On sale, claimed depreciation is recaptured at up to 25%, and gains may owe capital-gains tax (a 1031 exchange can defer both). Figures are a year-1 estimate at your 24.0% rate — not tax advice; consult a CPA.
Condition & rehab AI · 12 photos
Vacant park model in a private campground with association fees. Exterior and landscaping improvements can significantly enhance its value.
Repairs flagged
- Minor Exterior siding — Weathered appearance suggests minor damage.
- Minor Exterior painting — Paint appears faded and could benefit from repainting.
- Minor Landscaping — Basic landscaping could be improved for curb appeal.
Value-add opportunities
- Both Painting exterior siding — Improves curb appeal and home value.
- Both Landscaping — Enhances curb appeal and adds value to the property.
Renovation cost estimate screening
| Repair item | Severity | Est. cost |
|---|---|---|
| Exterior siding · Weathered appearance suggests minor damage. | Minor | $500–3,000 |
| Exterior painting · Paint appears faded and could benefit from repainting. | Minor | $500–3,000 |
| Landscaping · Basic landscaping could be improved for curb appeal. | Minor | $500–3,000 |
| Total estimated repair cost · 3 items | $1,500–9,000 |
Value-add ROI direction
- Both Painting exterior siding — Improves curb appeal and home value. ↑
- Both Landscaping — Enhances curb appeal and adds value to the property. ↑
ⓘ Cost ranges are severity-bucket heuristics (US national rule-of-thumb). Get contractor quotes + a written scope before underwriting a rehab budget.
Schools (NCES district)
- District
- Morley Stanwood Community Schools
- NCES district ID
- 2624600
- Math proficiency
- 24% ▼ -1.00%
- Reading proficiency
- 33% ▲ 1.00%
- Median HH income
- $40,617
- Composite
- 24.03/100
- National rank
- #7769
- State rank
- #390 of 540 in MI
Livability — Morley
- Score
- 60/100
- State rank
- #586
- US rank
- #19006
Category grades
Schools grade is shown separately in the Schools card above.
Census & demographics
- Population (ZIP)
- 4,727
Population outlook (Mecosta County) Hauer SSP2
- Today (2025)
- 42,954 people
- By 2030
- 42,954 · +0.0%
- By 2040
- 41,574 · -3.2%
- By 2050
- 39,250 · -8.6%
- By 2075
- 32,628 · -24.0%
- By 2100
- 27,476 · -36.0%
Race, ethnicity, and origin ACS 2023
- Neighborhood character
- Predominantly White (93%)
- Race & ethnicity
- White 93% Hispanic / Latino 3% Black 2% Two or more races 2% Native American 1%
- Common ancestry
- Iranian 8% Lithuanian 6% Romanian 3%
- Foreign-born
- 2% · Canada, China
- Languages at home
- 80% English-only · German/W. Germanic 18% Spanish 2%
Political lean MEDSL · Mecosta
- 2024 margin
- Solid R (+30.0) · D 34.2% · R 64.2% · Other 1.6%
- 2008→2024 swing
- -29.3pp toward R · 2008: -0.7pp · 2024: -30.0pp
- All cycles
- 2024: R+30.0 2020: R+28.0 2016: R+26.1 2012: R+9.8 2008: R+0.7
Not yet ingested
- Civics
- —
Market trends
- HPI YoY
- ▼ -29.70%
- Current HPI
- 225.2541
- Rent YoY
- —
- Metro
- —
- State GDP YoY
- ▲ 1.37%
- F500 in state
- 28
Industry mix (Fortune 500 HQ in MI)
| Industry | F500 HQs | Revenue |
|---|---|---|
| Automotive Parts | 3 | $48B |
|
||
| Automotive | 2 | $372B |
|
||
| Chemicals | 1 | $45B |
|
||
| Automotive Retail | 1 | $29B |
|
||
| Healthcare / Medical Devices | 1 | $23B |
|
||
| Automotive Technology | 1 | $20B |
|
||
Price history
-8.3% since first listed7 events — show timeline
- 2026-06-02 Listed $55,000 SW Michigan MLS
- 2026-06-02 Listed $55,000 MiRealSource-MiMLS
- 2026-06-02 Listed $55,000 REALCOMP
- 2025-09-05 Listing Removed — MiRealSource-MiMLS
- 2025-09-04 Listing Removed — REALCOMP
- 2024-09-04 Listed $60,000 REALCOMP
- 2024-09-04 Listed $60,000 MiRealSource-MiMLS
Cash-flow waterfall
monthlySold comps — $/sqft
last 12 mo · ≤1 miLoading sold comps…